Fabrics for the twenty-first century - The Courtauld Institute of Art
Fabrics for the twenty-first century - The Courtauld Institute of Art
Fabrics for the twenty-first century - The Courtauld Institute of Art

Create successful ePaper yourself
Turn your PDF publications into a flip-book with our unique Google optimized e-Paper software.
Young and Jardine <strong>Fabrics</strong> <strong>for</strong> <strong>the</strong> <strong>twenty</strong>-<strong>first</strong> <strong>century</strong><br />
14<br />
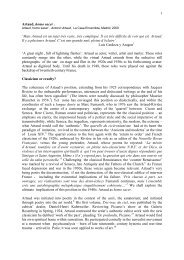
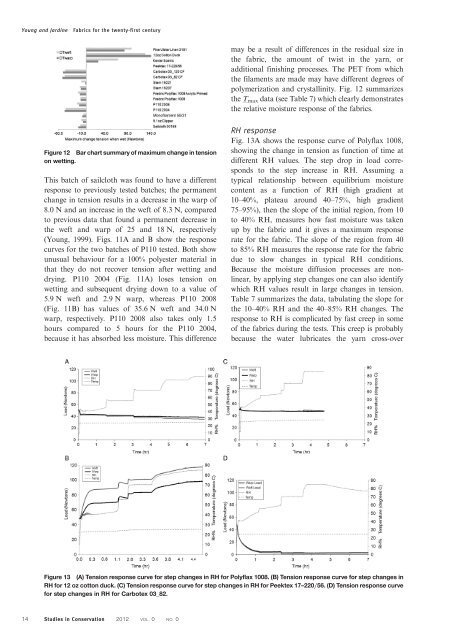
Figure 12 Bar chart summary <strong>of</strong> maximum change in tension<br />
on wetting.<br />
This batch <strong>of</strong> sailcloth was found to have a different<br />
response to previously tested batches; <strong>the</strong> permanent<br />
change in tension results in a decrease in <strong>the</strong> warp <strong>of</strong><br />
8.0 N and an increase in <strong>the</strong> weft <strong>of</strong> 8.3 N, compared<br />
to previous data that found a permanent decrease in<br />
<strong>the</strong> weft and warp <strong>of</strong> 25 and 18 N, respectively<br />
(Young, 1999). Figs. 11A and B show <strong>the</strong> response<br />
curves <strong>for</strong> <strong>the</strong> two batches <strong>of</strong> P110 tested. Both show<br />
unusual behaviour <strong>for</strong> a 100% polyester material in<br />
that <strong>the</strong>y do not recover tension after wetting and<br />
drying. P110 2004 (Fig. 11A) loses tension on<br />
wetting and subsequent drying down to a value <strong>of</strong><br />
5.9 N weft and 2.9 N warp, whereas P110 2008<br />
(Fig. 11B) has values <strong>of</strong> 35.6 N weft and 34.0 N<br />
warp, respectively. P110 2008 also takes only 1.5<br />
hours compared to 5 hours <strong>for</strong> <strong>the</strong> P110 2004,<br />
because it has absorbed less moisture. This difference<br />
may be a result <strong>of</strong> differences in <strong>the</strong> residual size in<br />
<strong>the</strong> fabric, <strong>the</strong> amount <strong>of</strong> twist in <strong>the</strong> yarn, or<br />
additional finishing processes. <strong>The</strong> PET from which<br />
<strong>the</strong> filaments are made may have different degrees <strong>of</strong><br />
polymerization and crystallinity. Fig. 12 summarizes<br />
<strong>the</strong> Tmax data (see Table 7) which clearly demonstrates<br />
<strong>the</strong> relative moisture response <strong>of</strong> <strong>the</strong> fabrics.<br />
RH response<br />
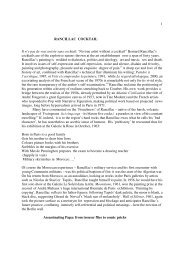
Fig. 13A shows <strong>the</strong> response curve <strong>of</strong> Polyflax 1008,<br />
showing <strong>the</strong> change in tension as function <strong>of</strong> time at<br />
different RH values. <strong>The</strong> step drop in load corresponds<br />
to <strong>the</strong> step increase in RH. Assuming a<br />
typical relationship between equilibrium moisture<br />
content as a function <strong>of</strong> RH (high gradient at<br />
10–40%, plateau around 40–75%, high gradient<br />
75–95%), <strong>the</strong>n <strong>the</strong> slope <strong>of</strong> <strong>the</strong> initial region, from 10<br />
to 40% RH, measures how fast moisture was taken<br />
up by <strong>the</strong> fabric and it gives a maximum response<br />
rate <strong>for</strong> <strong>the</strong> fabric. <strong>The</strong> slope <strong>of</strong> <strong>the</strong> region from 40<br />
to 85% RH measures <strong>the</strong> response rate <strong>for</strong> <strong>the</strong> fabric<br />
due to slow changes in typical RH conditions.<br />
Because <strong>the</strong> moisture diffusion processes are nonlinear,<br />
by applying step changes one can also identify<br />
which RH values result in large changes in tension.<br />
Table 7 summarizes <strong>the</strong> data, tabulating <strong>the</strong> slope <strong>for</strong><br />
<strong>the</strong> 10–40% RH and <strong>the</strong> 40–85% RH changes. <strong>The</strong><br />
response to RH is complicated by fast creep in some<br />
<strong>of</strong> <strong>the</strong> fabrics during <strong>the</strong> tests. This creep is probably<br />
because <strong>the</strong> water lubricates <strong>the</strong> yarn cross-over<br />
Figure 13 (A) Tension response curve <strong>for</strong> step changes in RH <strong>for</strong> Polyflax 1008. (B) Tension response curve <strong>for</strong> step changes in<br />
RH <strong>for</strong> 12 oz cotton duck. (C) Tension response curve <strong>for</strong> step changes in RH <strong>for</strong> Peektex 17–220/56. (D) Tension response curve<br />
<strong>for</strong> step changes in RH <strong>for</strong> Carbotex 03_82.<br />
Studies in Conservation 2012 VOL. 0 NO. 0