The GPI-Phospholipase C of Trypanosoma brucei Is Nonessential ...
The GPI-Phospholipase C of Trypanosoma brucei Is Nonessential ...
The GPI-Phospholipase C of Trypanosoma brucei Is Nonessential ...

You also want an ePaper? Increase the reach of your titles
YUMPU automatically turns print PDFs into web optimized ePapers that Google loves.
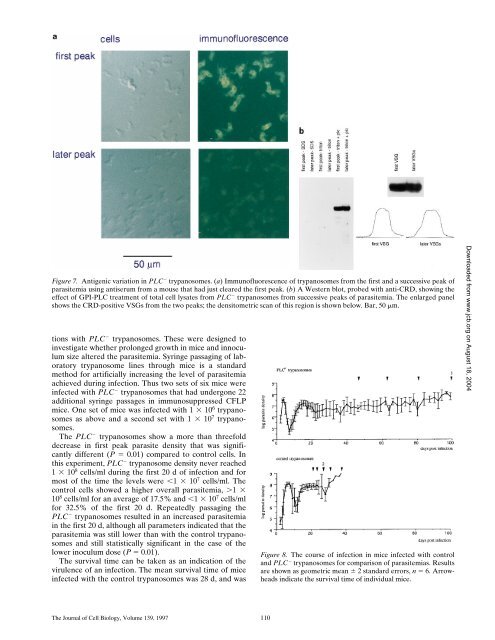
Figure 7. Antigenic variation in PLC � trypanosomes. (a) Immun<strong>of</strong>luorescence <strong>of</strong> trypanosomes from the first and a successive peak <strong>of</strong><br />
parasitemia using antiserum from a mouse that had just cleared the first peak. (b) A Western blot, probed with anti-CRD, showing the<br />
effect <strong>of</strong> <strong>GPI</strong>-PLC treatment <strong>of</strong> total cell lysates from PLC � trypanosomes from successive peaks <strong>of</strong> parasitemia. <strong>The</strong> enlarged panel<br />
shows the CRD-positive VSGs from the two peaks; the densitometric scan <strong>of</strong> this region is shown below. Bar, 50 �m.<br />
tions with PLC � trypanosomes. <strong>The</strong>se were designed to<br />
investigate whether prolonged growth in mice and innoculum<br />
size altered the parasitemia. Syringe passaging <strong>of</strong> laboratory<br />
trypanosome lines through mice is a standard<br />
method for artificially increasing the level <strong>of</strong> parasitemia<br />
achieved during infection. Thus two sets <strong>of</strong> six mice were<br />
infected with PLC � trypanosomes that had undergone 22<br />
additional syringe passages in immunosuppressed CFLP<br />
mice. One set <strong>of</strong> mice was infected with 1 � 10 6 trypanosomes<br />
as above and a second set with 1 � 10 7 trypanosomes.<br />
<strong>The</strong> PLC � trypanosomes show a more than threefold<br />
decrease in first peak parasite density that was significantly<br />
different (P � 0.01) compared to control cells. In<br />
this experiment, PLC � trypanosome density never reached<br />
1 � 10 8 cells/ml during the first 20 d <strong>of</strong> infection and for<br />
most <strong>of</strong> the time the levels were �1 � 10 7 cells/ml. <strong>The</strong><br />
control cells showed a higher overall parasitemia, �1 �<br />
10 8 cells/ml for an average <strong>of</strong> 17.5% and �1 � 10 7 cells/ml<br />
for 32.5% <strong>of</strong> the first 20 d. Repeatedly passaging the<br />
PLC � trypanosomes resulted in an increased parasitemia<br />
in the first 20 d, although all parameters indicated that the<br />
parasitemia was still lower than with the control trypanosomes<br />
and still statistically significant in the case <strong>of</strong> the<br />
lower inoculum dose (P � 0.01).<br />
<strong>The</strong> survival time can be taken as an indication <strong>of</strong> the<br />
virulence <strong>of</strong> an infection. <strong>The</strong> mean survival time <strong>of</strong> mice<br />
infected with the control trypanosomes was 28 d, and was<br />
<strong>The</strong> Journal <strong>of</strong> Cell Biology, Volume 139, 1997 110<br />
Figure 8. <strong>The</strong> course <strong>of</strong> infection in mice infected with control<br />
and PLC � trypanosomes for comparison <strong>of</strong> parasitemias. Results<br />
are shown as geometric mean � 2 standard errors, n � 6. Arrowheads<br />
indicate the survival time <strong>of</strong> individual mice.<br />
Downloaded from<br />
www.jcb.org on August 18, 2004