

Download complete issue (pdf 3360kb) - Academic Journals
Download complete issue (pdf 3360kb) - Academic Journals
Download complete issue (pdf 3360kb) - Academic Journals

Create successful ePaper yourself
Turn your PDF publications into a flip-book with our unique Google optimized e-Paper software.
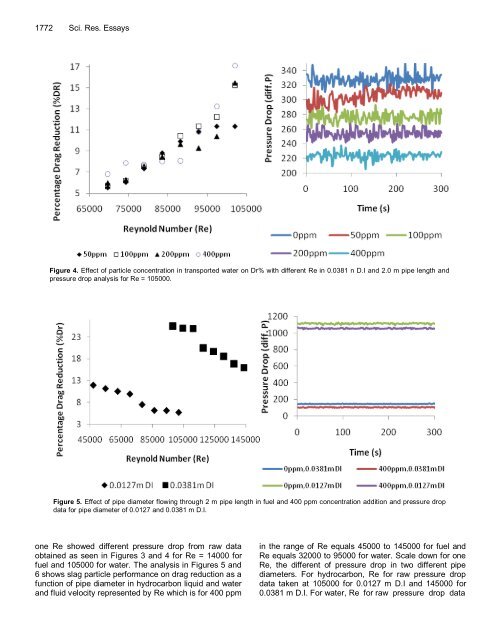
1772 Sci. Res. Essays<br />
Figure 4. Effect of particle concentration in transported water on Dr% with different Re in 0.0381 n D.I and 2.0 m pipe length and<br />
pressure drop analysis for Re = 105000.<br />
Figure 5. Effect of pipe diameter flowing through 2 m pipe length in fuel and 400 ppm concentration addition and pressure drop<br />
data for pipe diameter of 0.0127 and 0.0381 m D.I.<br />
one Re showed different pressure drop from raw data<br />
obtained as seen in Figures 3 and 4 for Re = 14000 for<br />
fuel and 105000 for water. The analysis in Figures 5 and<br />
6 shows slag particle performance on drag reduction as a<br />
function of pipe diameter in hydrocarbon liquid and water<br />
and fluid velocity represented by Re which is for 400 ppm<br />
in the range of Re equals 45000 to 145000 for fuel and<br />
Re equals 32000 to 95000 for water. Scale down for one<br />
Re, the different of pressure drop in two different pipe<br />
diameters. For hydrocarbon, Re for raw pressure drop<br />
data taken at 105000 for 0.0127 m D.I and 145000 for<br />
0.0381 m D.I. For water, Re for raw pressure drop data


