

Download complete issue (pdf 3360kb) - Academic Journals
Download complete issue (pdf 3360kb) - Academic Journals
Download complete issue (pdf 3360kb) - Academic Journals

You also want an ePaper? Increase the reach of your titles
YUMPU automatically turns print PDFs into web optimized ePapers that Google loves.
1780 Sci. Res. Essays<br />
deviation .<br />
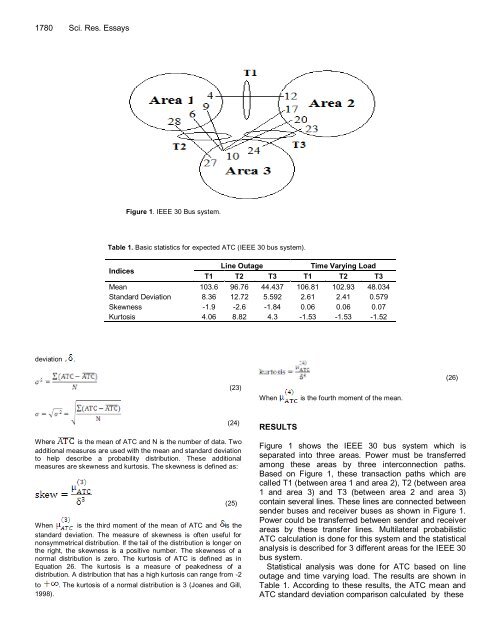
Figure 1. IEEE 30 Bus system.<br />
Table 1. Basic statistics for expected ATC (IEEE 30 bus system).<br />
Indices<br />
T1<br />
Line Outage<br />
T2 T3<br />
Time Varying Load<br />
T1 T2 T3<br />
Mean 103.6 96.76 44.437 106.81 102.93 48.034<br />
Standard Deviation 8.36 12.72 5.592 2.61 2.41 0.579<br />
Skewness -1.9 -2.6 -1.84 0.06 0.06 0.07<br />
Kurtosis 4.06 8.82 4.3 -1.53 -1.53 -1.52<br />
(23)<br />
(24)<br />
Where is the mean of ATC and N is the number of data. Two<br />
additional measures are used with the mean and standard deviation<br />
to help describe a probability distribution. These additional<br />
measures are skewness and kurtosis. The skewness is defined as:<br />
(25)<br />
When is the third moment of the mean of ATC and is the<br />
standard deviation. The measure of skewness is often useful for<br />
nonsymmetrical distribution. If the tail of the distribution is longer on<br />
the right, the skewness is a positive number. The skewness of a<br />
normal distribution is zero. The kurtosis of ATC is defined as in<br />
Equation 26. The kurtosis is a measure of peakedness of a<br />
distribution. A distribution that has a high kurtosis can range from -2<br />
to . The kurtosis of a normal distribution is 3 (Joanes and Gill,<br />
1998).<br />
When is the fourth moment of the mean.<br />
RESULTS<br />
(26)<br />
Figure 1 shows the IEEE 30 bus system which is<br />
separated into three areas. Power must be transferred<br />
among these areas by three interconnection paths.<br />
Based on Figure 1, these transaction paths which are<br />
called T1 (between area 1 and area 2), T2 (between area<br />
1 and area 3) and T3 (between area 2 and area 3)<br />
contain several lines. These lines are connected between<br />
sender buses and receiver buses as shown in Figure 1.<br />
Power could be transferred between sender and receiver<br />
areas by these transfer lines. Multilateral probabilistic<br />
ATC calculation is done for this system and the statistical<br />
analysis is described for 3 different areas for the IEEE 30<br />
bus system.<br />
Statistical analysis was done for ATC based on line<br />
outage and time varying load. The results are shown in<br />
Table 1. According to these results, the ATC mean and<br />
ATC standard deviation comparison calculated by these


