Mandea et.al. - The magnetic field changing over
Mandea et.al. - The magnetic field changing over
Mandea et.al. - The magnetic field changing over
- TAGS
- mandea
- magnetic
- inkaba.org

You also want an ePaper? Increase the reach of your titles
YUMPU automatically turns print PDFs into web optimized ePapers that Google loves.
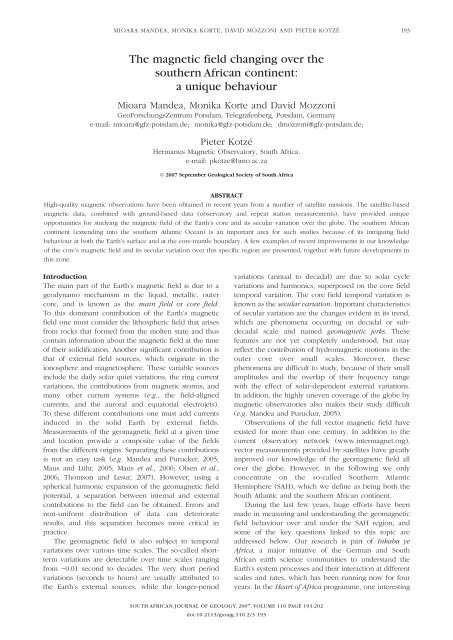
MIOARA MANDEA, MONIKA KORTE, DAVID MOZZONI AND PIETER KOTZÉ 193<br />
<strong>The</strong> magn<strong>et</strong>ic <strong>field</strong> <strong>changing</strong> <strong>over</strong> the<br />
southern African continent:<br />
a unique behaviour<br />
Mioara <strong>Mandea</strong>, Monika Korte and David Mozzoni<br />
GeoForschungsZentrum Potsdam, Telegrafenberg, Potsdam, Germany<br />
e-mail: mioara@gfz-potsdam.de; monika@gfz-potsdam.de; dmozzoni@gfz-potsdam.de;<br />
Introduction<br />
<strong>The</strong> main part of the Earth’s magn<strong>et</strong>ic <strong>field</strong> is due to a<br />
geodynamo mechanism in the liquid, m<strong>et</strong><strong>al</strong>lic, outer<br />
core, and is known as the main <strong>field</strong> or core <strong>field</strong>.<br />
To this dominant contribution of the Earth’s magn<strong>et</strong>ic<br />
<strong>field</strong> one must consider the lithospheric <strong>field</strong> that arises<br />
from rocks that formed from the molten state and thus<br />
contain information about the magn<strong>et</strong>ic <strong>field</strong> at the time<br />
of their solidification. Another significant contribution is<br />
that of extern<strong>al</strong> <strong>field</strong> sources, which originate in the<br />
ionosphere and magn<strong>et</strong>osphere. <strong>The</strong>se variable sources<br />
include the daily solar qui<strong>et</strong> variations, the ring current<br />
variations, the contributions from magn<strong>et</strong>ic storms, and<br />
many other current systems (e.g., the <strong>field</strong>-<strong>al</strong>igned<br />
currents, and the auror<strong>al</strong> and equatori<strong>al</strong> electroj<strong>et</strong>s).<br />
To these different contributions one must add currents<br />
induced in the solid Earth by extern<strong>al</strong> <strong>field</strong>s.<br />
Measurements of the geomagn<strong>et</strong>ic <strong>field</strong> at a given time<br />
and location provide a composite v<strong>al</strong>ue of the <strong>field</strong>s<br />
from the different origins. Separating these contributions<br />
is not an easy task (e.g. <strong>Mandea</strong> and Purucker, 2005;<br />
Maus and Lühr, 2005; Maus <strong>et</strong> <strong>al</strong>., 2006; Olsen <strong>et</strong> <strong>al</strong>.,<br />
2006; Thomson and Lesur, 2007). However, using a<br />
spheric<strong>al</strong> harmonic expansion of the geomagn<strong>et</strong>ic <strong>field</strong><br />
potenti<strong>al</strong>, a separation b<strong>et</strong>ween intern<strong>al</strong> and extern<strong>al</strong><br />
contributions to the <strong>field</strong> can be obtained. Errors and<br />
non-uniform distribution of data can d<strong>et</strong>eriorate<br />
results, and this separation becomes more critic<strong>al</strong> in<br />
practice.<br />
<strong>The</strong> geomagn<strong>et</strong>ic <strong>field</strong> is <strong>al</strong>so subject to tempor<strong>al</strong><br />
variations <strong>over</strong> various time sc<strong>al</strong>es. <strong>The</strong> so-c<strong>al</strong>led shortterm<br />
variations are d<strong>et</strong>ectable <strong>over</strong> time sc<strong>al</strong>es ranging<br />
from ~0.01 second to decades. <strong>The</strong> very short period<br />
variations (seconds to hours) are usu<strong>al</strong>ly attributed to<br />
the Earth’s extern<strong>al</strong> sources, while the longer-period<br />
Pi<strong>et</strong>er Kotzé<br />
Hermanus Magn<strong>et</strong>ic Observatory, South Africa.<br />
e-mail: pkotze@hmo.ac.za<br />
© 2007 September Geologic<strong>al</strong> Soci<strong>et</strong>y of South Africa<br />
ABSTRACT<br />
High-qu<strong>al</strong>ity magn<strong>et</strong>ic observations have been obtained in recent years from a number of satellite missions. <strong>The</strong> satellite-based<br />
magn<strong>et</strong>ic data, combined with ground-based data (observatory and repeat station measurements), have provided unique<br />
opportunities for studying the magn<strong>et</strong>ic <strong>field</strong> of the Earth’s core and its secular variation <strong>over</strong> the globe. <strong>The</strong> southern African<br />
continent (extending into the southern Atlantic Ocean) is an important area for such studies because of its intriguing <strong>field</strong><br />
behaviour at both the Earth’s surface and at the core-mantle boundary. A few examples of recent improvements in our knowledge<br />
of the core’s magn<strong>et</strong>ic <strong>field</strong> and its secular variation <strong>over</strong> this specific region are presented, tog<strong>et</strong>her with future developments in<br />
this zone.<br />
variations (annu<strong>al</strong> to decad<strong>al</strong>) are due to solar cycle<br />
variations and harmonics, superposed on the core <strong>field</strong><br />
tempor<strong>al</strong> variation. <strong>The</strong> core <strong>field</strong> tempor<strong>al</strong> variation is<br />
known as the secular variation. Important characteristics<br />
of secular variation are the changes evident in its trend,<br />
which are phenomena occurring on decad<strong>al</strong> or subdecad<strong>al</strong><br />
sc<strong>al</strong>e and named geomagn<strong>et</strong>ic jerks. <strong>The</strong>se<br />
features are not y<strong>et</strong> compl<strong>et</strong>ely understood, but may<br />
reflect the contribution of hydromagn<strong>et</strong>ic motions in the<br />
outer core <strong>over</strong> sm<strong>al</strong>l sc<strong>al</strong>es. More<strong>over</strong>, these<br />
phenomena are difficult to study, because of their sm<strong>al</strong>l<br />
amplitudes and the <strong>over</strong>lap of their frequency range<br />
with the effect of solar-dependent extern<strong>al</strong> variations.<br />
In addition, the highly uneven c<strong>over</strong>age of the globe by<br />
magn<strong>et</strong>ic observatories <strong>al</strong>so makes their study difficult<br />
(e.g. <strong>Mandea</strong> and Purucker, 2005).<br />
Observations of the full vector magn<strong>et</strong>ic <strong>field</strong> have<br />
existed for more than one century. In addition to the<br />
current observatory n<strong>et</strong>work (www.intermagn<strong>et</strong>.org),<br />
vector measurements provided by satellites have greatly<br />
improved our knowledge of the geomagn<strong>et</strong>ic <strong>field</strong> <strong>al</strong>l<br />
<strong>over</strong> the globe. However, in the following we only<br />
concentrate on the so-c<strong>al</strong>led Southern Atlantic<br />
Hemisphere (SAH), which we define as being both the<br />
South Atlantic and the southern African continent.<br />
During the last few years, huge efforts have been<br />
made in measuring and understanding the geomagn<strong>et</strong>ic<br />
<strong>field</strong> behaviour <strong>over</strong> and under the SAH region, and<br />
some of the key questions linked to this topic are<br />
addressed below. Our research is part of Inkaba ye<br />
Africa, a major initiative of the German and South<br />
African earth science communities to understand the<br />
Earth’s system processes and their interaction at different<br />
sc<strong>al</strong>es and rates, which has been running now for four<br />
years. In the Heart of Africa programme, one interesting<br />
SOUTH AFRICAN JOURNAL OF GEOLOGY, 2007,VOLUME 110 PAGE 193-202<br />
doi:10.2113/gssajg.110.2/3 193
194<br />
THE MAGNETIC FIELD CHANGING OVER THE SOUTHERN AFRICAN CONTINENT<br />
Figure 1. Distribution of magn<strong>et</strong>ic data <strong>over</strong> the Southern Atlantic Hemisphere (SAH) provided by INTERMAGNET magn<strong>et</strong>ic observatories<br />
(circles); new magn<strong>et</strong>ic observatories, inst<strong>al</strong>led or planned (diamonds); repeat stations (stars). <strong>The</strong> named repeat stations are used in<br />
Figure 4.<br />
topic is tracking the behaviour of the geomagn<strong>et</strong>ic <strong>field</strong><br />
<strong>over</strong> the southern African region. A project named<br />
COMPASS (Comprehensive Magn<strong>et</strong>ic Processes under<br />
the African Southern Sub-continent), a study of the<br />
geomagn<strong>et</strong>ic <strong>field</strong> in this region, supported by the glob<strong>al</strong><br />
monitoring of the magn<strong>et</strong>ic <strong>field</strong> from satellites like<br />
CHAMP, is helping to b<strong>et</strong>ter explain and predict the<br />
secular variation.<br />
In this paper we firstly present the available data<br />
<strong>over</strong> our region of interest, some of the geomagn<strong>et</strong>ic<br />
<strong>field</strong> particularities in this area, and conclude with<br />
proposed measurements and studies to b<strong>et</strong>ter<br />
understand the <strong>field</strong> behaviour in the SAH.<br />
Geomagn<strong>et</strong>ic data for Southern Atlantic<br />
Hemisphere (SAH)<br />
Ground-based data<br />
Observatory data<br />
Modern land-based magn<strong>et</strong>ic observatories use similar<br />
instrumentation to produce similar data products.<br />
<strong>The</strong> fundament<strong>al</strong> measurements recorded are oneminute<br />
v<strong>al</strong>ues of the vector components and<br />
sc<strong>al</strong>ar intensity; however, a recent INTERMAGNET<br />
(www.intermagn<strong>et</strong>.org) recommendation is to develop<br />
and inst<strong>al</strong>l instruments able to record one-second v<strong>al</strong>ues.<br />
From the one-minute data, hourly, daily, monthly and<br />
annu<strong>al</strong> mean v<strong>al</strong>ues are produced. <strong>The</strong> monthly<br />
and annu<strong>al</strong> mean v<strong>al</strong>ues are used to d<strong>et</strong>ermine the<br />
secular variation originating inside the Earth’s core.<br />
For our region of interest, the number of observatories<br />
is dramatic<strong>al</strong>ly reduced (Figure 1), when compared<br />
with an equiv<strong>al</strong>ent area in either Europe or North<br />
America.<br />
SOUTH AFRICAN JOURNAL OF GEOLOGY<br />
<strong>The</strong> observatory distribution is a key param<strong>et</strong>er in<br />
d<strong>et</strong>ermining the secular variation. This is the reason why<br />
in some regions, like the SAH, the secular variation<br />
uncertainty is higher than in b<strong>et</strong>ter-c<strong>over</strong>ed regions such<br />
as Europe, where it is a few nT/yr (e.g. Verbanac <strong>et</strong> <strong>al</strong>.,<br />
2007). More<strong>over</strong>, d<strong>et</strong>ailed studies of geomagn<strong>et</strong>ic jerks<br />
are not well suited, as the magn<strong>et</strong>ic observatories<br />
operating in the area are far apart and present a very<br />
different and intriguing behaviour from one site to<br />
another (see below).<br />
Repeat station data<br />
In order to improve the data distribution <strong>over</strong> this<br />
region, the southern African continent repeat station<br />
n<strong>et</strong>work is taken into account (Figure 1). During the last<br />
few decades, efforts have been taken by Hermanus<br />
Magn<strong>et</strong>ic Observatory to establish and measure a<br />
n<strong>et</strong>work of repeat stations, today c<strong>over</strong>ing the territories<br />
of South Africa, Namibia and Botswana (Kotzé <strong>et</strong> <strong>al</strong>.,<br />
2007a). During the last two years these stations were reoccupied<br />
and measured on a yearly basis in the frame of<br />
the COMPASS project. At the time of writing, the repeat<br />
station measurements done in 2005 have been<br />
processed and the data are available. <strong>The</strong> 2006<br />
campaign measurements will be available in 2007.<br />
For more d<strong>et</strong>ail on the survey m<strong>et</strong>hod, data processing<br />
and uncertainty estimates, the reader is requested to<br />
consult the paper by Korte <strong>et</strong> <strong>al</strong>. (2007b).<br />
Satellite data<br />
<strong>The</strong> first satellite that provided v<strong>al</strong>uable vector data was<br />
MAGSAT, which supplied magn<strong>et</strong>ic measurements <strong>over</strong><br />
a six-month period b<strong>et</strong>ween 1979 and 1980.
MIOARA MANDEA, MONIKA KORTE, DAVID MOZZONI AND PIETER KOTZÉ<br />
Figure 2. Map of the change in the core magn<strong>et</strong>ic <strong>field</strong> intensity b<strong>et</strong>ween the MAGSAT (1980) and CHAMP (2002) epochs.<br />
<strong>The</strong> following 20 years were without satellite magn<strong>et</strong>ic<br />
c<strong>over</strong>age. However, in recent years, the geomagn<strong>et</strong>ic<br />
community has been provided with a we<strong>al</strong>th of new<br />
high-qu<strong>al</strong>ity data from sever<strong>al</strong> near-Earth satellites:<br />
Ørsted (www.dmi.dk) (1999 to present), CHAMP<br />
3a<br />
3b 3c<br />
SOUTH AFRICAN JOURNAL OF GEOLOGY<br />
195<br />
(www.gfz-potsdam.de) (2000 to present) and SAC-C<br />
(www.dnsc.dk) (2000 to present). Currently, Ørsted and<br />
SAC-C are less useful: Ørsted because of its long time<br />
period in space (note that its nomin<strong>al</strong> life was just<br />
14 months), and SAC-C because the vector data cannot<br />
be directly used, as the star camera has given no<br />
information during the course of the mission.<br />
<strong>The</strong> CHAMP satellite, with its highly precise,<br />
multifunction<strong>al</strong> and complementary payload elements<br />
(magn<strong>et</strong>om<strong>et</strong>er, accelerom<strong>et</strong>er, star sensor, GPS receiver,<br />
laser r<strong>et</strong>ro reflector, ion-drift m<strong>et</strong>er) and its orbit<strong>al</strong><br />
characteristics (near polar, low <strong>al</strong>titude, long duration),<br />
currently provides high-precision gravity and magn<strong>et</strong>ic<br />
<strong>field</strong> measurements. <strong>The</strong> <strong>al</strong>most circular and near-polar<br />
orbit (87.3º with respect to the equator) <strong>al</strong>lows for a<br />
homogeneous and <strong>al</strong>most compl<strong>et</strong>e glob<strong>al</strong> c<strong>over</strong>age of<br />
the Earth. <strong>The</strong> CHAMP sc<strong>al</strong>ar magn<strong>et</strong>om<strong>et</strong>er provides an<br />
absolute in-flight c<strong>al</strong>ibration capability for the vector<br />
magn<strong>et</strong>ic <strong>field</strong> measurements.<br />
Figure 3. Tempor<strong>al</strong> evolution for the magn<strong>et</strong>ic <strong>field</strong> components: D (declination) H (horizont<strong>al</strong> component) and F (tot<strong>al</strong> <strong>field</strong> intensity) for<br />
the Hermanus (HER), Hartebeesthoek (HBK) and Tsumeb (TSU) observatories.
196<br />
4a<br />
4b<br />
THE MAGNETIC FIELD CHANGING OVER THE SOUTHERN AFRICAN CONTINENT<br />
Figure 4 Tempor<strong>al</strong> evolution for the magn<strong>et</strong>ic <strong>field</strong> components: D (declination) H (horizont<strong>al</strong> component) and F (tot<strong>al</strong> <strong>field</strong> intensity) and<br />
their secular variation for eight repeat stations distributed <strong>over</strong> the southern African continent (see Figure 1 for their spati<strong>al</strong> distribution).<br />
<strong>The</strong>se three satellite datas<strong>et</strong>s have been used for<br />
computing various models based on satellite data only,<br />
or by combining satellite data with ground data.<br />
<strong>The</strong> intern<strong>al</strong> part of the geomagn<strong>et</strong>ic <strong>field</strong> is gener<strong>al</strong>ly<br />
described mathematic<strong>al</strong>ly by a spheric<strong>al</strong> harmonic<br />
expansion. This is the representation of the magn<strong>et</strong>ic<br />
<strong>field</strong> potenti<strong>al</strong> as a series of multipoles: n=1 represents<br />
the dipole contribution, n=2 that from a quadrupole, n=3<br />
SOUTH AFRICAN JOURNAL OF GEOLOGY<br />
from octopole and so on. <strong>The</strong> degrees thus are a<br />
measure for spati<strong>al</strong> wavelength. At sm<strong>al</strong>ler degrees the<br />
<strong>field</strong> from the core is dominant. B<strong>et</strong>ween approximately<br />
degrees n=13 and 15, or 3000 to 2600 km wavelength,<br />
the observed <strong>field</strong> is strongly influenced by both core<br />
and lithospheric <strong>field</strong> contributions. For degrees larger<br />
than n=15, the short wavelengths of the core <strong>field</strong> are<br />
masked by the lithospheric sign<strong>al</strong>, and the long
4c<br />
4d<br />
MIOARA MANDEA, MONIKA KORTE, DAVID MOZZONI AND PIETER KOTZÉ 197<br />
Figure 4 continued. Tempor<strong>al</strong> evolution for the magn<strong>et</strong>ic <strong>field</strong> components: D (declination) H (horizont<strong>al</strong> component) and F (tot<strong>al</strong> <strong>field</strong><br />
intensity) and their secular variation for eight repeat stations distributed <strong>over</strong> the southern African continent (see Figure 1 for their spati<strong>al</strong><br />
distribution).<br />
wavelength features of the lithospheric <strong>field</strong> are buried<br />
under the large core <strong>field</strong> amplitudes. Some of these<br />
glob<strong>al</strong> models, representing both the static <strong>field</strong> and the<br />
secular variation to different degree/order, are used in<br />
the following discussions. However, for the region<strong>al</strong><br />
modelling, information of the main <strong>field</strong> evolution can<br />
be obtained from the ground-stations (Kotzé <strong>et</strong> <strong>al</strong>.,<br />
2007). Mainly in the southern African continent the<br />
SOUTH AFRICAN JOURNAL OF GEOLOGY<br />
repeat station data are very useful for accurately<br />
monitoring the secular variation.<br />
Tempor<strong>al</strong> changes of the geomagn<strong>et</strong>ic <strong>field</strong> at the<br />
Earth’s surface<br />
Secular variation and geomagn<strong>et</strong>ic jerks<br />
Modelling of the secular variation (with characteristic<br />
time sc<strong>al</strong>es of the order of years to decades) can be
198<br />
4e<br />
4f<br />
THE MAGNETIC FIELD CHANGING OVER THE SOUTHERN AFRICAN CONTINENT<br />
Figure 4 continued. Tempor<strong>al</strong> evolution for the magn<strong>et</strong>ic <strong>field</strong> components: D (declination) H (horizont<strong>al</strong> component) and F (tot<strong>al</strong> <strong>field</strong><br />
intensity) and their secular variation for eight repeat stations distributed <strong>over</strong> the southern African continent (see Figure 1 for their spati<strong>al</strong><br />
distribution).<br />
significantly improved by using the recent satellite<br />
vector magn<strong>et</strong>ic surveys carried out by the Ørsted,<br />
CHAMP and SAC-C missions. <strong>The</strong>se missions permit the<br />
study of the geographic<strong>al</strong> pattern of the secular variation<br />
during each satellite’s lif<strong>et</strong>ime, and <strong>al</strong>so <strong>al</strong>low a<br />
comparison with former data from the MAGSAT mission<br />
in 1979 to 1980 (Langlais <strong>et</strong> <strong>al</strong>., 2003). Comparisons of<br />
MAGSAT and CHAMP satellite data indicate that the<br />
SOUTH AFRICAN JOURNAL OF GEOLOGY<br />
relative decrease of the geomagn<strong>et</strong>ic <strong>field</strong> is particularly<br />
strong in the Atlantic and American sector (Figure 2).<br />
This coincides partly with the South Atlantic Anom<strong>al</strong>y,<br />
where the geomagn<strong>et</strong>ic <strong>field</strong> is significantly weaker than<br />
<strong>over</strong> the rest of the Earth at equiv<strong>al</strong>ent <strong>al</strong>titudes. Besides<br />
the <strong>field</strong> intensity, the orientation of the geomagn<strong>et</strong>ic<br />
<strong>field</strong> in the southern African continent is <strong>al</strong>so <strong>changing</strong><br />
rapidly. To compl<strong>et</strong>ely describe the vector <strong>field</strong>,
MIOARA MANDEA, MONIKA KORTE, DAVID MOZZONI AND PIETER KOTZÉ<br />
Figure 5. Secular variation plotted for the Y (magn<strong>et</strong>ic east) component of two European observatories (Chambon la Forêt and Niemegk)<br />
and two southern African observatories (Hermanus and Tsumeb). Note that data from Chambon la Forêt and Niemegk observatories are<br />
used only after 1940, in order to c<strong>over</strong> the time-span with available data from Hermanus and Tsumeb.<br />
Figure 3 shows the evolution for the three <strong>field</strong><br />
components (D – declination, H – the horizont<strong>al</strong><br />
component and F – the tot<strong>al</strong> <strong>field</strong> intensity). In the<br />
northwest part of southern Africa the declination of the<br />
magn<strong>et</strong>ic <strong>field</strong> is propagating eastward (Tsumeb) while<br />
in the south-east part it propagates westward (Hermanus<br />
and Hartebeesthoek). It is obvious that a spati<strong>al</strong> gradient<br />
SOUTH AFRICAN JOURNAL OF GEOLOGY<br />
199<br />
<strong>over</strong> the subcontinent exists that presently increases<br />
with time. Continuous observations by scientists at the<br />
Hermanus Magn<strong>et</strong>ic Observatory have documented a<br />
decrease in the magn<strong>et</strong>ic <strong>field</strong> strength of about 26%<br />
since the 1920s. When an<strong>al</strong>ysing the long-term evolution<br />
of the data obtained from repeat stations, a different<br />
behaviour is observed b<strong>et</strong>ween stations situated in the<br />
Figure 6. Map of the secular variation of the radi<strong>al</strong> <strong>field</strong> at the Earth’s surface computed from the CHAOS model for epoch 2002.5 and<br />
degree n=14. Units nT/yr.
200<br />
THE MAGNETIC FIELD CHANGING OVER THE SOUTHERN AFRICAN CONTINENT<br />
Figure 7. Map of the tot<strong>al</strong> <strong>field</strong> intensity for epoch 2005, computed from the CHAOS model. <strong>The</strong> South Atlantic Anom<strong>al</strong>y is well defined<br />
by its weaker <strong>field</strong> v<strong>al</strong>ues. <strong>The</strong> track of the minimum of this anom<strong>al</strong>y <strong>over</strong> the last four centuries is shown by the green (GUFM) and yellow<br />
(CHAOS) lines with white labels indicating the approximate year. Sever<strong>al</strong> nearby magn<strong>et</strong>ic observatories are highlighted in red (HUA -<br />
Huancayo, VSS - Vassouras, TRW - Trelew, TSU - Tsumeb, HBK - Hartebeesthoek, HER - Hermanus). Units nT.<br />
south-east, centre, and south-west parts of the continent<br />
(Figure 4).<br />
From the examination of the geomagn<strong>et</strong>ic series<br />
provided by the three southern African observatories,<br />
the intriguing observation is made that the date of<br />
change in the declination trend coincides with that of a<br />
well-documented geomagn<strong>et</strong>ic jerk (<strong>Mandea</strong> <strong>et</strong> <strong>al</strong>.,<br />
2000). This simple observation, evident in Figure 3,<br />
brings to light new questions about geomagn<strong>et</strong>ic jerks<br />
and their role on sm<strong>al</strong>l spati<strong>al</strong> sc<strong>al</strong>es. More<strong>over</strong>,<br />
considering two European observatories (Chambon-la-<br />
Forêt and Niemegk) separated by a comparable distance<br />
as the two southern African ones (Tsumeb and<br />
Hermanus), makes it possible to underline the<br />
different behaviour b<strong>et</strong>ween these two regions<br />
(Figure 5). Chambon-la-Forêt and Niemegk show the<br />
same tempor<strong>al</strong> changes, whereas Tsumeb and<br />
Hermanus change dramatic<strong>al</strong>ly in declination behaviour<br />
after 1980.<br />
A recent model, CHAOS (Olsen <strong>et</strong> <strong>al</strong>., 2006),<br />
c<strong>over</strong>ing more than 6.5 years, brings important<br />
improvements in describing the secular variation from<br />
solely satellite data. Indeed, secular variation, no longer<br />
considered just linear, has its non-linear time changes<br />
described by means of splines in order to avoid<br />
unreasonable v<strong>al</strong>ues near the limits of the time interv<strong>al</strong>.<br />
This model <strong>al</strong>lows us to estimate the changes in the<br />
geomagn<strong>et</strong>ic <strong>field</strong> during the last few years, without any<br />
biases introduced by data qu<strong>al</strong>ity or by various<br />
approaches in modelling. Figure 6 illustrates the secular<br />
SOUTH AFRICAN JOURNAL OF GEOLOGY<br />
variation of the radi<strong>al</strong> <strong>field</strong> at the Earth’s surface<br />
obtained from this model. <strong>The</strong> radi<strong>al</strong> <strong>field</strong> is shown here,<br />
as this component and its secular variation are the ones<br />
expressed at the top of the core in order to infer outer<br />
core fluid motion.<br />
South Atlantic Anom<strong>al</strong>y.<br />
It is in this region that the shielding effect of the<br />
magn<strong>et</strong>ic <strong>field</strong> is severely reduced, thus <strong>al</strong>lowing high<br />
energy particles of the hard radiation belt to pen<strong>et</strong>rate<br />
deep into the upper atmosphere to <strong>al</strong>titudes below<br />
100 km. <strong>The</strong> region has an impact for spacecraft orbiting<br />
at sever<strong>al</strong> hundred km <strong>al</strong>titude with inclinations<br />
b<strong>et</strong>ween 35° and 60°, as they are exposed to sever<strong>al</strong><br />
minutes of strong radiation on each orbit. <strong>The</strong> South<br />
Atlantic Anom<strong>al</strong>y (SAA) is clearly observed when the<br />
magn<strong>et</strong>ic <strong>field</strong> intensity is computed from satellite<br />
measurements. Once more, the CHAOS model is used,<br />
and Figure 7 shows that the magn<strong>et</strong>ic <strong>field</strong> is becoming<br />
gener<strong>al</strong>ly weaker in this specific region. To find out how<br />
this anom<strong>al</strong>y has changed in time, we <strong>al</strong>so plot in<br />
Figure 7 the location of the minimum of the magn<strong>et</strong>ic<br />
<strong>field</strong> intensity in time. <strong>The</strong> v<strong>al</strong>ues computed here are<br />
based on two models, c<strong>over</strong>ing various time-spans: 1590<br />
to 1990 from the GUFM model (Jackson <strong>et</strong> <strong>al</strong>., 2000) and<br />
1999 to 2005 from the CHAOS model (Olsen <strong>et</strong> <strong>al</strong>.,<br />
2006). <strong>The</strong> SAA minimum has moved <strong>over</strong> the last four<br />
centuries, from the southern African continent to South<br />
America, with a notable rate during the last few<br />
centuries.
MIOARA MANDEA, MONIKA KORTE, DAVID MOZZONI AND PIETER KOTZÉ<br />
Figure 8. Map of the secular variation of the radi<strong>al</strong> <strong>field</strong> at the core-mantle boundary (Rcmb=3480 km) for epoch 2002.5. <strong>The</strong> <strong>field</strong> v<strong>al</strong>ues<br />
are computed from the CHAOS secular variation model up to degree n=14. Units nT/yr.<br />
At the core-mantle boundary<br />
<strong>The</strong> robust CHAOS model resolves secular variation<br />
coefficients beyond degree 13, which means that for the<br />
first time it is possible to infer the tempor<strong>al</strong> changes of<br />
the core <strong>field</strong> to sm<strong>al</strong>ler sc<strong>al</strong>es than the <strong>field</strong> itself and to<br />
ev<strong>al</strong>uate structures with short wavelengths at the coremantle<br />
boundary never before observed (Figure 8).<br />
This figure shows that the southern African continent is<br />
one of two regions of very active variations of the<br />
secular variation, where wave-like structures propagate<br />
(Dormy and <strong>Mandea</strong>, 2005). <strong>The</strong> magn<strong>et</strong>ic activity<br />
within these structures directly relates to the<br />
geomagn<strong>et</strong>ic jerks previously reported at the Earth’s<br />
surface (<strong>Mandea</strong> <strong>et</strong> <strong>al</strong>., 2000).<br />
Another interesting feature is linked to changes in<br />
the glob<strong>al</strong> magn<strong>et</strong>ic flux. Considering the CM4 model<br />
(1960 to 2002) published by Sabaka <strong>et</strong> <strong>al</strong>. (2002) and a<br />
20-year time span (to keep the same time interv<strong>al</strong> as in<br />
Figure 2), the tot<strong>al</strong> flux for the epochs 1980 and 2000<br />
was computed. Figure 9 shows that 20 years is enough<br />
to change the flux patterns. Glob<strong>al</strong>ly speaking, the most<br />
evident change is the transition of the reverse patch in<br />
the Pacific Ocean to the north, becoming part of the<br />
large Northern Hemisphere patch. Under the region of<br />
interest, patches 1 and 2 have <strong>al</strong>so a clear evolution in<br />
time. Patch 1 is round and its surface area increased by<br />
nearly 52% <strong>over</strong> 20 years. Patch 2, having previously<br />
co<strong>al</strong>esced from three distinct, sm<strong>al</strong>ler patches, is more<br />
extended and shows only a modest increase in<br />
surface area by <strong>al</strong>most 2%. However, its morphology<br />
has changed significantly <strong>over</strong> this time and shows signs<br />
that it might split again into two segments (near 60˚S,<br />
35˚W).<br />
9a<br />
9b<br />
SOUTH AFRICAN JOURNAL OF GEOLOGY<br />
201<br />
Figure 9. Maps comparing the glob<strong>al</strong> flux c<strong>al</strong>culated from the CM4<br />
model to degree n=10 for epochs 1980 (a) and 2000 (b). Note <strong>over</strong><br />
the intervening time the reconnection of a sm<strong>al</strong>l reverse flux patch<br />
in the Pacific with the large northern patch. Two other larger<br />
reverse flux patches are labelled and show an increase in surface<br />
area <strong>over</strong> the time interv<strong>al</strong>. Patch 1 increases by nearly 52% while<br />
Patch 2 increases by <strong>al</strong>most 2%.
202<br />
THE MAGNETIC FIELD CHANGING OVER THE SOUTHERN AFRICAN CONTINENT<br />
Conclusion<br />
During the last few years, sever<strong>al</strong> new satellites (Ørsted,<br />
CHAMP, SAC-C) were launched to measure the Earth’s<br />
magn<strong>et</strong>ic <strong>field</strong> from space; these new data serve as an<br />
important complement to the ground-based data<br />
provided by magn<strong>et</strong>ic observatory and repeat station<br />
n<strong>et</strong>works. <strong>The</strong> biggest benefit of this huge new amount<br />
of magn<strong>et</strong>ic <strong>field</strong> data (from ground and space) comes<br />
from the ability to g<strong>et</strong> a b<strong>et</strong>ter insight into the hidden<br />
interior of the plan<strong>et</strong> and its place in the magn<strong>et</strong>ic solar<br />
system.<br />
We have taken advantage of these exception<strong>al</strong><br />
datas<strong>et</strong>s for a d<strong>et</strong>ailed investigation of the SAH.<br />
This region shows a very interesting behaviour of the<br />
magn<strong>et</strong>ic <strong>field</strong> and its tempor<strong>al</strong> variations. An important<br />
question is how well does the secular change derived<br />
from satellite models fit the ground-based measurements<br />
in this very dynamic region? If differences are observed,<br />
how can they be explained? Are they due to<br />
imperfections in the model? Do induction anom<strong>al</strong>ies in<br />
the ground adversely affect the model? <strong>The</strong>se questions<br />
can only be answered when high-qu<strong>al</strong>ity data for a few<br />
annu<strong>al</strong> repeat stations campaigns becomes available<br />
during the coming years. More<strong>over</strong>, this region with its<br />
rapidly <strong>changing</strong> intern<strong>al</strong> magn<strong>et</strong>ic <strong>field</strong> is ide<strong>al</strong>ly suited<br />
to test the idea that rapid secular variation can induce<br />
currents in highly conductive later<strong>al</strong> structures in the<br />
lithosphere or upper mantle. <strong>The</strong> magn<strong>et</strong>ic signature<br />
caused by these confined currents is expected to change<br />
at the rate of the secular variation and not of the <strong>field</strong><br />
itself. From the results obtained in such an investigation,<br />
it will be possible to decide wh<strong>et</strong>her similar studies<br />
in other parts of the world can be expected to be<br />
successful.<br />
<strong>The</strong> Earth’s magn<strong>et</strong>ic <strong>field</strong> will remain under<br />
observation with the European Space Agency’s<br />
forthcoming Swarm mission. Three satellites will be<br />
launched in 2010 to measure the magn<strong>et</strong>ic <strong>field</strong> and its<br />
variations with unprecedented accuracy. However, a<br />
comprehensive separation and understanding of the<br />
processes contributing to the geomagn<strong>et</strong>ic <strong>field</strong> is<br />
possible only by joint an<strong>al</strong>ysis of satellite and groundbased<br />
data, despite <strong>al</strong>l the difficulties that combining<br />
such different datas<strong>et</strong>s entails. Continuous space-borne<br />
and ground-based monitoring of the magn<strong>et</strong>ic <strong>field</strong> aim<br />
to address such needs, and in the SAH, as one of the<br />
most interesting and intriguing regions, such<br />
measurements should to be continued. During the next<br />
few years the COMPASS project will be extended, with<br />
the hope that for at least every two years the southern<br />
African repeat station n<strong>et</strong>work will be measured.<br />
More<strong>over</strong>, repeat stations can be inst<strong>al</strong>led in some<br />
nearby countries, such as Mozambique. Fin<strong>al</strong>ly, l<strong>et</strong> us<br />
stress the efforts made by GFZ Potsdam to inst<strong>al</strong>l a new<br />
magn<strong>et</strong>ic observatory at the St. Helena Island (see again<br />
Figure 1). At the time of this writing, the magn<strong>et</strong>ic<br />
SOUTH AFRICAN JOURNAL OF GEOLOGY<br />
instruments (three-components fluxgate FGE, DI-flux<br />
Zeiss 010B with a mounted magn<strong>et</strong>om<strong>et</strong>er MAG01H and<br />
two Overhauser magn<strong>et</strong>om<strong>et</strong>ers – GSM19 and GSM90)<br />
to be inst<strong>al</strong>led at the St. Helena are currently being<br />
tested in Niemegk observatory, <strong>al</strong>though some<br />
administrative work remains. With these efforts we hope<br />
to support the Swarm mission data with a b<strong>et</strong>ter<br />
distributed ground datas<strong>et</strong>.<br />
Acknowledgements<br />
All figures were produced with GMT (28). We would<br />
like to thank Alexander Jordan and Martin Rother for<br />
graphic support. We express our sincere thanks to<br />
Angelo De Santis and an anonymous referee for their<br />
comments that improved our paper. To Maarten de Wit<br />
and Brian Hors<strong>field</strong> a speci<strong>al</strong> thanks is definitely<br />
deserved for editing this speci<strong>al</strong> INKABA issue. This is<br />
Inkaba ye Africa contribution number 05.<br />
References<br />
Dormy, E. and <strong>Mandea</strong>, M. (2005). Tracking geomagn<strong>et</strong>ic impulses down to<br />
the core-mantle boundary, Earth and Plan<strong>et</strong>ary Science L<strong>et</strong>ters,<br />
237, 300-309.<br />
Langlais, B., <strong>Mandea</strong>, M. and Ultré-Guèrard, P. (2003). High-resolution<br />
magn<strong>et</strong>ic <strong>field</strong> modeling: application to MAGSAT and Ørsted data, Physics<br />
of Earth and Plan<strong>et</strong>ary Interiors, 135, 77-92.<br />
Jackson, A., Jonkers, A.R.T. and W<strong>al</strong>ker, M.R. (2000). Four centuries of<br />
geomagn<strong>et</strong>ic secular variation from historic<strong>al</strong> records, Philosphic<strong>al</strong><br />
Transactions of the Roy<strong>al</strong> Soci<strong>et</strong>y, London, 358, 957-990.<br />
Korte, M., <strong>Mandea</strong>, M., Kotzé, P., Nahayo, E. and Pr<strong>et</strong>orius, B. (2007a).<br />
Improved observations at the Southern African geomagn<strong>et</strong>ic repeat station<br />
n<strong>et</strong>work, South African Journ<strong>al</strong> of Geology, 110, 175-186.<br />
Kotzé, P., <strong>Mandea</strong>, M. and Korte, M. (2007b). Modelling the Southern African<br />
geomagn<strong>et</strong>ic <strong>field</strong> secular variation using ground survey data for 2005,<br />
South African Journ<strong>al</strong> of Geology, 110, 187-192.<br />
<strong>Mandea</strong>, M., Bellanger, E. and Le Mouël, J.-L. (2000). A geomagn<strong>et</strong>ic jerk for<br />
the end of 20th century? Earth and Plan<strong>et</strong>ary Science L<strong>et</strong>ters, 183, 369-373.<br />
<strong>Mandea</strong>, M. and Purucker, M. (2005). Measurements of the Earth’s magn<strong>et</strong>ic<br />
<strong>field</strong> from space, Surveys in Geophysics, 26, doi:10.1007/s10712-005-3857-x,<br />
415-459.<br />
Maus, S. and Lühr H. (2005). Signature of the qui<strong>et</strong>-time magn<strong>et</strong>ospheric<br />
magn<strong>et</strong>ic <strong>field</strong> and its electromagn<strong>et</strong>ic induction in the rotating Earth,<br />
Geophysic<strong>al</strong> Journ<strong>al</strong> Internation<strong>al</strong>, 162, 755-763, doi:101111/j.1365-<br />
246.2005.02691.x.<br />
Maus, S., Rother, M., Stolle, C., Mai, W., Choi, S., Lühr, H., Cook, D. and Roth,<br />
C. (2006). Third generation of the Potsdam Magn<strong>et</strong>ic Model of the Earth<br />
(POMME), Geochemistry, Geophysics and Geosystems, 7, Q07008, doi:<br />
10.1029/2006GC001269, 2006.<br />
Olsen, N., Lühr, H., Sabaka, T., <strong>Mandea</strong>, M., Rother, M., Toffner-Clausen, L.<br />
and Choi, S. (2006). CHAOS - A Model of Earth’s Magn<strong>et</strong>ic Field derived<br />
from CHAMP, Orsted, and SAC-C magn<strong>et</strong>ic satellite data, Geophysic<strong>al</strong><br />
Journ<strong>al</strong> Internation<strong>al</strong>, 165, doi:10.1111/j.1365-246X.2006.03059.x.<br />
Sabaka, T.L., Olsen, N. and Langel, R.A. (2002). A comprehensive model of<br />
the qui<strong>et</strong>-time, near-Earth magn<strong>et</strong>ic <strong>field</strong>: Phase 3, Geophysic<strong>al</strong> Journ<strong>al</strong><br />
Internation<strong>al</strong>, 151, 32-68.<br />
Thomson, A.W.P. and Lesur, V. (2007). An improved geomagn<strong>et</strong>ic data<br />
selection <strong>al</strong>gorithm for glob<strong>al</strong> geomagn<strong>et</strong>ic <strong>field</strong> modelling, Geophysic<strong>al</strong><br />
Journ<strong>al</strong> Internation<strong>al</strong>, 168, doi:10.1111/j.1365-246X.2007.03354.x.<br />
Verbanac, G., Korte, M. and <strong>Mandea</strong>, M. (2007). On long-term trends in<br />
European geomagn<strong>et</strong>ic observatory biases, Earth Plan<strong>et</strong>s Space, (in press).<br />
Editori<strong>al</strong> handling: M.J. de Wit and Brian Hors<strong>field</strong>