NCAR-TN-76-1 Structure of an Evolving Hailstorm.
NCAR-TN-76-1 Structure of an Evolving Hailstorm.
NCAR-TN-76-1 Structure of an Evolving Hailstorm.

Create successful ePaper yourself
Turn your PDF publications into a flip-book with our unique Google optimized e-Paper software.
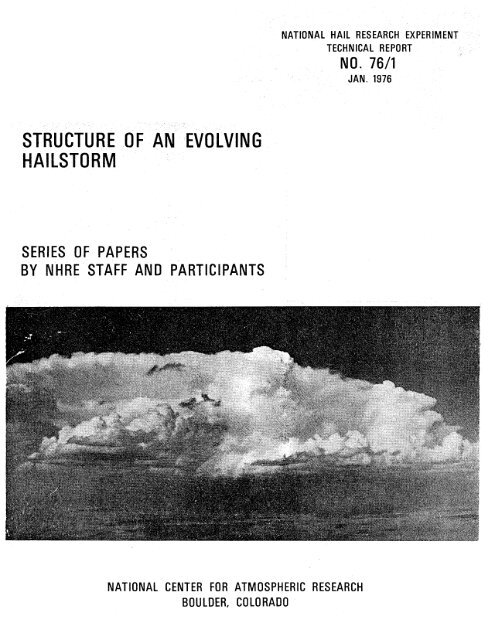
STRUCTURE OF AN 'EVOLVING<br />
HAILSTORM<br />
SERIES OF PAPERS<br />
BY NHRE STAFF AND PARTICIPANTS<br />
NATIONAL CENTER FOR ATMOSPHERIC RESEARCH<br />
BOULDER, COLORADO<br />
NATIONAL HAIL RESEARCH EXPERIMENT<br />
TECHNICAL REPORT<br />
NO. <strong>76</strong>/1<br />
JAN. 19<strong>76</strong>
STRUCTURE OF AN EVOLVING HAILSTORM<br />
PART I<br />
General Characteristics <strong>an</strong>d Cellular <strong>Structure</strong><br />
by<br />
J.-P. Chalon, J. C. F<strong>an</strong>khauser, <strong>an</strong>d P. J. Eccles<br />
National Center for Atmospheric Research<br />
Boulder, Colorado<br />
PART II<br />
Thermodynamic <strong>Structure</strong> <strong>an</strong>d Airflow in the Near Environment<br />
by<br />
J. C. F<strong>an</strong>khauser<br />
National Center for Atmospheric Research<br />
Boulder, Colorado<br />
PART III<br />
Internal <strong>Structure</strong> from Doppler Radar<br />
by<br />
R. G. Strauch <strong>an</strong>d F. H. Merrem<br />
NOAA/ERL/Wave Propagation Laboratory<br />
Boulder, Colorado<br />
PART IV<br />
Internal <strong>Structure</strong> from Penetrating Aircraft<br />
by<br />
D. J. Musil, E. L. May, P. L. Smith, Jr., <strong>an</strong>d W. R. S<strong>an</strong>d<br />
Institute <strong>of</strong> Atmospheric Sciences, South Dakota School<br />
<strong>of</strong> Mines <strong>an</strong>d Technology, Rapid City, South Dakota<br />
PART V<br />
a Synthesis <strong>an</strong>d Implications for Hail Growth <strong>an</strong>d Hail Suppression<br />
by<br />
K. A. Browning, J. C. F<strong>an</strong>khauser, J.-P. Chalon,<br />
P. J. Eccles, R. G. Strauch, F. H. Merrem,<br />
D. J. Musil, E. L. May, <strong>an</strong>d W. R. S<strong>an</strong>d
<strong>Structure</strong> <strong>of</strong> <strong>an</strong> <strong>Evolving</strong> <strong>Hailstorm</strong>. Part I:<br />
General Characteristics <strong>an</strong>d Cellular <strong>Structure</strong><br />
by<br />
J.-P. Chalon, J. C. F<strong>an</strong>khauser, <strong>an</strong>d P. J. Eccles<br />
National Center for Atmospheric Research 2<br />
Boulder, Colorado<br />
Scientific visitor on leave from "Meteorologie Nationale," Paris, Fr<strong>an</strong>ce, on<br />
a fellowship from the "Delegation Generale a la Recherche Scientifique et<br />
Technique."<br />
2 This research was performed as part <strong>of</strong> the National Hail Research Experiment,<br />
m<strong>an</strong>aged by the National Center for Atmospheric Research <strong>an</strong>d sponsored by the<br />
Weather Modification Program, Research Applications Directorate, National<br />
Science Foundation.
ABSTRACT<br />
The detailed structure <strong>an</strong>d evolution <strong>of</strong> radar echoes observed in a<br />
multicellular hailstorm are <strong>an</strong>alyzed. General environmental conditions,<br />
overall radar echo development <strong>an</strong>d precipitation measurements are briefly<br />
discussed but the <strong>an</strong>alysis is mainly concerned with a particular event which<br />
was thoroughly observed by several different field facilities <strong>of</strong> the National<br />
Hail Research Experiment. This hailstorm which evolved in a systematic <strong>an</strong>d<br />
periodic m<strong>an</strong>ner is the subject <strong>of</strong> four comp<strong>an</strong>ion papers appearing in this<br />
issue.<br />
Overall storm characteristics are found to compare closely to earlier<br />
descriptions <strong>of</strong> multicell hailstorms occurring in the High Plains. The motion<br />
<strong>of</strong> the main system was to the right <strong>of</strong> the me<strong>an</strong> wind vector in the cloud layer.<br />
Cell velocity was along but less th<strong>an</strong> the wind in the mid-troposphere.<br />
Propagation by new cell growth in a preferred location with respect to<br />
existing radar echoes dominated the motion <strong>of</strong> the overall system. Study <strong>of</strong><br />
the formation <strong>an</strong>d evolution <strong>of</strong> individual cells showed that discrete new<br />
echoes formed near the altitude <strong>of</strong> 7 km MSL (-12 C) on the storm's right<br />
forward fl<strong>an</strong>k 5 to 10 km ahead <strong>of</strong> existing echo components at approximately<br />
15 min intervals. Each grew rapidly in intensity <strong>an</strong>d height <strong>an</strong>d by moving<br />
more slowly th<strong>an</strong> the overall echo complex soon became the main storm component.<br />
Average lifetime <strong>of</strong> individual cells, including the period from visually<br />
perceptible turrets, to 'first echo,' to echo decay, was 45 min. Thus, as<br />
m<strong>an</strong>y as three cells were found to coexist in varying stages <strong>of</strong> development.<br />
The ascent rate <strong>of</strong> visual cloud turrets <strong>an</strong>d the history <strong>of</strong> maximum radar<br />
reflectivity <strong>of</strong> individual cells after the appear<strong>an</strong>ce <strong>of</strong> first echo indicate<br />
that the longest in-cloud residence time available for particle growth to the<br />
largest observed hail size (1.5 cm diameter) was between 30 <strong>an</strong>d 35 min.
1. Introduction<br />
I-1<br />
One <strong>of</strong> the objectives <strong>of</strong> the National Hail Research Experiment (NHRE) is<br />
the definition <strong>of</strong> thermodynamic structure <strong>an</strong>d airflow patterns characteristic<br />
<strong>of</strong> the different types <strong>of</strong> hail-producing thunderstorms. Aside from the<br />
motivation <strong>of</strong> gaining increased underst<strong>an</strong>ding <strong>of</strong> all aspects <strong>of</strong> convective<br />
cloud dynamics, incisive case studies are required to establish a firmer<br />
physical basis for conduct <strong>an</strong>d evaluation <strong>of</strong> a hail suppression experiment.<br />
Of particular import<strong>an</strong>ce is the interdependence between airflow patterns <strong>an</strong>d<br />
the m<strong>an</strong>ner in which precipitation products are generated, dispersed <strong>an</strong>d deposited<br />
at the ground. To establish the interrelationship <strong>of</strong> the import<strong>an</strong>t hailstorm<br />
parameters it is necessary to adopt a case study approach wherein m<strong>an</strong>y observa-<br />
tional techniques are brought to bear simult<strong>an</strong>eously on the same storm. Because<br />
<strong>of</strong> the sophistication <strong>of</strong> the required observational techniques, the difficulties<br />
in coordinating them, <strong>an</strong>d the infrequency <strong>of</strong> large hailstorms within the compass<br />
<strong>of</strong> fixed instrumentation, <strong>an</strong> adequately comprehensive data base is only<br />
occasionally achieved.<br />
On 9 July 1973 a number <strong>of</strong> thunderstorms moved over <strong>an</strong>d produced hail<br />
within the field facilities <strong>of</strong> NIRE located in northeastern Colorado. A full<br />
complement <strong>of</strong> observing systems, including conventional <strong>an</strong>d Doppler radars,<br />
surface <strong>an</strong>d upper-air networks <strong>an</strong>d instrumented aircraft, gathered data pertinent<br />
to a particular unseeded multicell storm near the town <strong>of</strong> Raymer. This<br />
paper is the first <strong>of</strong> a series <strong>of</strong> five appearing in this issue which describes<br />
the diverse observations (Parts I, II, III <strong>an</strong>d IV) <strong>an</strong>d which culminates in a<br />
synthesis <strong>of</strong> the airflow <strong>an</strong>d associated microphysical processes relev<strong>an</strong>t to<br />
hail formation in multicell storms (Part V).<br />
We present a brief review <strong>of</strong> signific<strong>an</strong>t larger scale features, the general<br />
radar echo development patterns as they occurred on this day, <strong>an</strong>d some
characteristics <strong>of</strong> the precipitation, but our <strong>an</strong>alysis here concerns mainly<br />
1-2<br />
the detailed radar echo structure <strong>an</strong>d evolution in the multicell storm which<br />
was the focus <strong>of</strong> the other observations. Our primary data base is the three-<br />
dimensional radar reflectivity patterns produced by computer using digital<br />
data from high-speed raster sc<strong>an</strong>s by the NHRE S-b<strong>an</strong>d research radar located<br />
near Grover, Colorado. A complete set <strong>of</strong> PPI sc<strong>an</strong>s was available from near<br />
ground level to storm top at <strong>an</strong> average interval <strong>of</strong> 2 min. A description <strong>of</strong><br />
the radar <strong>an</strong>d observational procedures is given by Eccles (1975).<br />
2. General features<br />
a. Character <strong>of</strong> the environment<br />
Circulation at the 500-mb level over northeast Colorado on the afternoon<br />
<strong>of</strong> 9 July 1973 was influenced by a large <strong>an</strong>ticyclone centered over the plateau<br />
region <strong>of</strong> the western United States (Fig. 1). Diffluent northerly flow advected<br />
cooler air southward during the day <strong>an</strong>d had a destabilizing effect favoring<br />
convective development which beg<strong>an</strong> in the NHRE research area by mid-afternoon.<br />
Surface <strong>an</strong>alysis at 1500 IIDT showed low pressure in western K<strong>an</strong>sas with<br />
cyclonic <strong>an</strong>d confluent northeasterly flow over northeastern Colorado. This<br />
zone <strong>of</strong> confluence is reflected in detail by <strong>an</strong>alysis <strong>of</strong> wind observations from<br />
the NHRE mesoscale surface network (Fig. 2). Surface moisture was relatively<br />
abund<strong>an</strong>t with the mixing ratio (r) r<strong>an</strong>ging between 8 <strong>an</strong>d 10 g/kg <strong>an</strong>d showing a<br />
typical decrease from southeast to northwest across the network. Potential<br />
temperature (0) on the other h<strong>an</strong>d increased from the southeast toward the<br />
northwest largely in response to upward sloping terrain <strong>an</strong>d associated decreasing<br />
surface pressure. The opposing potential temperature <strong>an</strong>d moisture gradients<br />
produced a field <strong>of</strong> equivalent potential temperature (0e) which, with the excep-<br />
tion <strong>of</strong> two stations on the southern extremity <strong>of</strong> the network, could be regarded<br />
as nearly uniform.<br />
3 All subsequent references to time will denote Mountain Daylight Time (MDT).
-13./ 5790<br />
I-4<br />
KIMBALL, NEBR.<br />
8~ 7~^3><br />
4 ; 6^ ^r9 316.Z44.2 / (SNY)<br />
c o.3- ' .8 SIDNE EBR.<br />
W YO.^_ __ ___J<br />
O 36 \ 45 34-9oo--'-W.<br />
18.4, 344.7 f<br />
1)<br />
4<br />
18.. ! I<br />
17.<br />
3 4 4 . 9<br />
8.2 37.1 345.<br />
GROVER, COLO'~ 344ROVER, 5474.<br />
COLO.<br />
\ ~(GRO)j~ ^ ~34515 3 .5<br />
. / / ^- 4 / 318 4 4.7<br />
17 <strong>76</strong>346.96.9<br />
food 45-5.6-_~ . 4 3-4664<br />
\ / /'~9.2 D/<br />
345.8 346.5 3 .-9-( 4<br />
. 4<br />
19. / 34568 f<br />
STERLING,<br />
____,. F.~ MORGANCOLO. (4F) ~<br />
(STK)<br />
^^siT.~ 3 9 ~ ~ ~~i .1 ~4<br />
/ r /, . f 9 JULY 73<br />
o10 , sec-<br />
317.5 3 49" 1<br />
;0. I I0<br />
20 30<br />
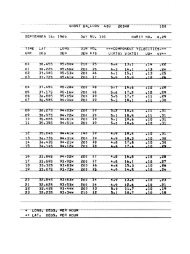
Fig. 2 SuArace 4stAeamlines at 1610 MPT, 9 Juty 1973, oveA NHRE meuoscale<br />
netokh. Ptotting model (Raowet left) incudeu wind (m s- 1 ), potential<br />
tempeatuwr e (e), equivalent potntieat tempoatwire (ee), <strong>an</strong>d mixing<br />
ratio (t). Special' awisonde sites are aocated neat Grover (GRO), Ft. Morg<strong>an</strong><br />
(4FM), <strong>an</strong>d SteQting (STK), Colorado <strong>an</strong>d at Kimball (KMB) <strong>an</strong>d Sidney (SNY),<br />
Nebraska. PPI tadoa echo contoau at 10 dB intervals above 30 dBZ show location<br />
oa e<strong>an</strong>esit thundeutorm devetopment.<br />
4<br />
.T 2
I-5<br />
Special serial soundings from five stations designated in Fig. 2 are used<br />
to identify the local static stability <strong>an</strong>d representative vertical wind shear.<br />
Temperature <strong>an</strong>d dew point curves (Fig. 3) measured during ascent <strong>of</strong> a 1630<br />
release from STK are chosen as representative <strong>of</strong> the storm's environment,<br />
because <strong>of</strong> the sounding's optimum location relative to the storm. The pseudo-<br />
adiabat having e = 345.5 K represents saturated conditions at cloud base<br />
e<br />
measured there by a research aircraft, Queen Air (NlOUW), operated by the<br />
4<br />
University <strong>of</strong> Wyoming (Part II). Cloud base altitude was 3.8 km MSL <strong>an</strong>d<br />
0, r, <strong>an</strong>d static pressure were 316.5 K, 9.5 g/kg, <strong>an</strong>d 650 mb, respectively.<br />
A lifted parcel with these properties would experience a temperature deficit<br />
up to 610 mb <strong>an</strong>d 4 to 5 C temperature excess in the layer between 550 <strong>an</strong>d 250<br />
mb. We note that cloud base 6 is 2 to 3 K colder then the environment; a<br />
common observation in updrafts beneath High Plains thunderstorms (Marwitz,<br />
1972a; Foote <strong>an</strong>d F<strong>an</strong>khauser, 1973).<br />
The inset in Fig. 3 gives the pr<strong>of</strong>ile <strong>of</strong> e with respect to pressure from<br />
the STK 1630 <strong>an</strong>d GRO 1735 soundings. Values near the surface are consistent<br />
with conditions shown in Fig. 2. Both curves indicate a decrease to near 500 mb<br />
that is characteristic <strong>of</strong> a summertime convectively unstable atmosphere in<br />
northeast Colorado. The coldest <strong>an</strong>d driest air al<strong>of</strong>t is found on the upwind<br />
GRO sounding where a layer from 550 to 475 mb has values < 330 K, with a minimum<br />
near 327 K.<br />
Wind distribution in the vertical from three soundings is plotted in Fig. 3.<br />
The lowest level designates surface wind <strong>an</strong>d all others are me<strong>an</strong>s for layers <strong>of</strong><br />
50-mb thickness. Conditions on the STK 1630 soundings are most representative<br />
<strong>of</strong> the environment in the .layer from the surface to cloud base, while those on<br />
4Unless otherwise specified all subsequent altitudes will refer to height above<br />
me<strong>an</strong> sea level (MSL). Height <strong>of</strong> the ground in the area <strong>of</strong> the storm was 41.4 km.
P(mb) P(mb) km<br />
300<br />
400x<br />
I-6<br />
200 E X 400- - LD TOP- 14 STK<br />
-T-28/<br />
500 /<br />
6 0 0 - 2 / 0<br />
-Q/A 10 UW-Q L BASE<br />
700 Q/ A<br />
N300A<br />
800 /BUFFALO N326D- //9.g/k<br />
12<br />
_ ^ xs < ><br />
^<br />
7~_ ~- _<br />
1000 /) 0 '<br />
Fig. 3 Thermodynamic cdiagram showing tempeAature (T) <strong>an</strong>d dew point<br />
4rom<br />
(Td)<br />
STK 1630 sounding. Labelted dashed curves de signate dry <strong>an</strong>d<br />
mo&st aditabats <strong>an</strong>d mixing iatio representative <strong>of</strong> measuAted cloud base conditions.<br />
Cons.tavt pessurte Zevels so<strong>an</strong>ded by instrumented iorLCAaft (Part<br />
a-e daesignated<br />
II)<br />
at lower left. Surace wind <strong>an</strong>d 50-mb tayeiL-averaged winds<br />
(m i) f{rom thiee represendtaive sou<strong>an</strong>dings ar-e on the righat. A ^ful barb<br />
4s 10 m 6*1.<br />
In4et hoWs ee (K) v 4 . pressur e (mb) for STK 1630 (4 olid) <strong>an</strong>d GRO<br />
1735 (dc&shed) sounding4.<br />
I\
the GRO 1735 <strong>an</strong>d KMB 1725 ascents best depict the environment in the'cloud-<br />
I-7<br />
bearing layer. We see that subcloud winds backed from east-northeasterly<br />
near the surface to light northerly near cloud base. Backing continued in the<br />
cloud-bearing layer from northerly to westerly near cloud top. 'Radar echo tops<br />
were recorded as high as 14 km. Wind shear in the layer *from cloud base to<br />
cloud top (650-150 mb) was computed from the average <strong>of</strong> the three wind soundings<br />
-3 -1<br />
to be 2 x 10 s . According to the classification by Marwitz (1972b),<br />
a low to moderate shear such as this is typical <strong>of</strong> environmental conditions<br />
surrounding multicell storms. Subsequent radar <strong>an</strong>alyses will show that storm<br />
features on this day were indeed characterized by periodically evolving multi-<br />
cellular echo patterns.<br />
b. Radar echo history<br />
In the early afternoon small short-lived cells emerged from convective<br />
clouds forming near the foothills <strong>of</strong> the Rocky Mountains to the west <strong>an</strong>d south-<br />
west <strong>of</strong> the NHRE area. By 1530 radar echoes appeared about 50 km northeast<br />
<strong>of</strong> the Grover site in convection developing over the Plains. A complex <strong>of</strong><br />
multicellular thunderstorms moved southward from the position <strong>of</strong> PPI echoes<br />
shown in Fig. 2 <strong>an</strong>d passed over the western portions <strong>of</strong> the NHRE precipitation<br />
<strong>an</strong>d mesonetworks while under the surveill<strong>an</strong>ce <strong>of</strong> the diverse observational<br />
facilities. A major sp<strong>an</strong> <strong>of</strong> this system's lifetime, which extended from 1603<br />
to 1821 (2.3 hrs.), is represented by the low-level PPI sc<strong>an</strong>s shown at 15-min<br />
intervals in Fig. 4. At about 1830 a new echo cluster appeared in western<br />
Nebraska <strong>an</strong>d was tracked as it proceeded southwestward across the sensor network.<br />
Finally a third development following essentially the same path as its predecessor<br />
moved from the vicinity <strong>of</strong> Sidney, Nebraska <strong>an</strong>d eventually dissipated within the<br />
NHRE area around 2230. 'In conjunction with these three major systems <strong>an</strong> enormous
1-8<br />
20 30 40 50 60 70 20 30 40 50 60 70<br />
_ 161b- - ------------ - 1710-<br />
20 "/0<br />
VH<br />
L IM ________________________<br />
' -- J<br />
-- -- l -- "1625 -40<br />
-0 O<br />
-210<br />
40<br />
(,Yn - I<br />
-5<br />
20 -2<br />
t OtOu (at 10 d- te above. 30 dZ t appo t<br />
I -200<br />
20 0 40 50 60 70 20 /70 0 40<br />
60 70<br />
Fg. 4 Low tCit (J4° EL; ^3 km MSL)<br />
d beag,<br />
compwteJ-geneLw)texj<br />
V <strong>an</strong>d ou top,<br />
PPI 'adcv<br />
e<br />
'jc-<br />
0 m -= 0 . Sta on<br />
4-tonm tenm on 9 JwCy 1973. Two po&ncm enchoe compnng -the. ovwef2VL<br />
Fiadaglz<br />
aogacaL<br />
ocagtio.<br />
vae abte,0<br />
wind<br />
<strong>an</strong>d<br />
veltou<br />
p Ae.cpaton<br />
on 161<br />
tom Etomn Wwe ca. Lame d. beaz<br />
0 ~ 3 nEL kS)mpteneaed sPPI radar reflec-<br />
/110 p<strong>an</strong>e de^gnaote.<br />
ocat9ono9 J 7ace. ot<br />
mez onetwozk Ltmp whg the ovte.oo- m
number <strong>of</strong> "initial" radar echoes developed both.within <strong>an</strong>d adjacent to their<br />
I-9<br />
primary areas <strong>of</strong> influence. Of these, %80% were shortlived <strong>an</strong>d did not mature<br />
to become major cells.<br />
Although firm statistics are not yet available, the multicellular develop-<br />
ments on this day seem to be typical <strong>of</strong> the most frequent type <strong>of</strong> thunderstorm<br />
occurring in northeast Colorado. Less typical were the observed storm movements.<br />
In contrast to the normal case where the surface wind has a component opposite<br />
to the general storm motion individual storms moved virtually parallel to <strong>an</strong>d<br />
faster th<strong>an</strong> the local surface wind vector. The position <strong>of</strong> early echo developments<br />
is shown in Fig. 2 to be just north <strong>of</strong> a surface confluence zone. Echoes<br />
forming to the north <strong>of</strong> the confluent asymptote moved with a predominately<br />
northerly component while those forming to the south moved from the northeast.<br />
This behavior essentially reflects the surface wind flow.<br />
Analyses to follow will focus on the individual storm, located on the<br />
western edge <strong>of</strong> the earliest echo complex, identified in Fig. 4 by the letter W.<br />
Cellular patterns at the times chosen to demonstrate echo configurations <strong>an</strong>d<br />
tr<strong>an</strong>slation do not reveal <strong>an</strong>y obvious evidence <strong>of</strong> discrete propagation.<br />
Subsequent detailed <strong>an</strong>alyses will, however, reveal this to be a primary feature<br />
<strong>of</strong> the storm's behavior pattern.<br />
c. Precipitation<br />
Hailpads <strong>an</strong>d weighing rain gages at four locations, designated on the 1710<br />
p<strong>an</strong>el in Fig. 4, recorded hailstone size <strong>an</strong>d total precipitation during the<br />
direct overhead passage <strong>of</strong> the intense core <strong>of</strong> storm W. Average rainfall<br />
accumulation at the four sites amounted to 12 mm <strong>an</strong>d the peak rainfall rate<br />
was near 120 - mm 1 hr . Of the m<strong>an</strong>y thunderstorms <strong>of</strong> the day, storm W was the<br />
Basic characteristics <strong>an</strong>d measurement capability <strong>of</strong> the hailpad used in NHRE<br />
aredescribed by Nicholas (1975).
1-10<br />
only one to pass over hailpads located at the four sites. Thus, although<br />
hailpad data is not time-resolved, recorded events could be attributed uniquely<br />
to storm W. Analysis <strong>of</strong> these pads showed that hailstone size r<strong>an</strong>ged from<br />
0.3 cm to 1.6 cm, diameter, with a medi<strong>an</strong> size <strong>of</strong> 0.5 cm. Although no hail-<br />
stones were collected beneath storm W, ground chase crews did retrieve<br />
specimens which fell from storm E. Laboratory <strong>an</strong>alysis (Knight, et al, 1974).<br />
<strong>of</strong> these revealed that about 75% grew from graupel embryos <strong>an</strong>d 25% had centers<br />
comprised primarily <strong>of</strong> frozen drops. A rough comparison <strong>of</strong> rain gage <strong>an</strong>d<br />
hailpad data indicates that less th<strong>an</strong> 5% <strong>of</strong> the total mass <strong>of</strong> precipitation<br />
from storm W fell as hail.<br />
From aircraft wind <strong>an</strong>d moisture measurements, F<strong>an</strong>khauser (1974) found that<br />
the rate <strong>of</strong> water vapor inflow to storm W was 42.5 kt s 1<br />
The corresponding<br />
rate <strong>of</strong> water deposition measured at the ground was ^1.0 kt s 1 , leading to<br />
a precipitation efficiency <strong>of</strong> about 40%. Both the inflow <strong>an</strong>d output were<br />
nearly <strong>an</strong> order <strong>of</strong> magnitude less th<strong>an</strong> that found by Foote <strong>an</strong>d F<strong>an</strong>khauser (1973)<br />
for a hailstorm <strong>of</strong> the supercell type which formed in a highly sheared environ-<br />
ment, but precipitation efficiency was somewhat greater in the present case.<br />
This result is in line with the inverse relationship between shear <strong>an</strong>d precipi-<br />
tation efficiency proposed by Marwitz (1972c).<br />
3. Formation <strong>an</strong>d evolution <strong>of</strong> the cells<br />
a. The evolving three-dimensional structure<br />
As shown in Fig. 4, both storm W <strong>an</strong>d storm E were at most times composed<br />
<strong>of</strong> numerous cells which on first inspection appeared to grow <strong>an</strong>d decay in <strong>an</strong><br />
apparent r<strong>an</strong>dom m<strong>an</strong>ner. Close examination <strong>of</strong> cells comprising storm W, however,<br />
revealed that they evolved with a systematic behavior. The three-dimensional<br />
structure <strong>of</strong> this storm is shown as a function <strong>of</strong> time in Fig. 5 by PPI tilt<br />
sequences. Stepped altitude sc<strong>an</strong>s presented at 415 min intervals are chosen
I-11<br />
12.7 iWO o WI W2<br />
woo W<br />
W16O W21 W3<br />
10.9 wI" wW4<br />
W o . A WI!OW<br />
RaWOda K W2 £ WO W2: W3 3<br />
-. 1 WI E<br />
~~~~~~~~~~~~WI<br />
0~~~~~~~<br />
W3,<br />
Wa ·WI a g ~ 18~3<br />
72 7.2 '<br />
W2 W3 4<br />
2.6<br />
_ II WW<br />
the. ne abeed at the botom o eac. W A<br />
n W ug<br />
WS WL. >de~nted n: boxe. ov d t ng da2d Ln g m o<br />
0 iO 20I 30 40 km<br />
1616 1631 1647 1'703 703 1716 (MDT)<br />
VCCwao,/ <strong>an</strong>d conn y o ce wtpo Wgh 4. VuW dahd n<br />
1cdaA. 'eZec-tu&t contow' LpLeSent 10 dB nt&vaOW above. 30 dBZ.<br />
lndcv/cduaZ Individual tilt'sequences t&^t jeqaences were wve. obtaZnead obtained kn in a pevod period <strong>of</strong> ]20 120 z cejvteWd centered s abowt about<br />
the<br />
Fig.<br />
time<br />
5<br />
labeled<br />
PP<br />
at<br />
c<strong>an</strong><br />
the bottom<br />
at<br />
<strong>of</strong><br />
evatio<br />
each. D isetee<br />
entred new<br />
at c<br />
ceil<br />
at ud<br />
formation<br />
t y wc ind<br />
WI<br />
icattd<br />
thtough<br />
W5 tab onu hed. ent.<br />
'egm<br />
ate identified<br />
Radarhow oectinvity<br />
in boxes. Downward<br />
contour repteaent C0<br />
Isopivng dashed tines<br />
dB interval<br />
give examples<br />
above<br />
<strong>of</strong><br />
vertical <strong>an</strong>d tempoal continulty <strong>of</strong> ceW WI thvough W4.<br />
30 dBZ.<br />
Thow<br />
Verticat<br />
vSQtceatZ<br />
dashed gines<br />
contnutL oj mna twL at ach tme. Indcvtduat C aW2<br />
segments~ show orien~tationz <strong>of</strong> verzt~ical sec~tionsc in F~ig. 6.
1-12<br />
to emphasize five discrete echo entities (identified by boxed labels) first<br />
appearing in the altitude r<strong>an</strong>ge <strong>of</strong> 5.6 to 9.1 km (MSL) at locations to the<br />
south <strong>an</strong>d ahead <strong>of</strong> the main echo. Cells are labeled according to their<br />
sequential order <strong>of</strong> appear<strong>an</strong>ce (e.g., Wl, W2 ... Wn) <strong>an</strong>d continuity for the<br />
four earliest developments is traced by dashed lines sloping downward with<br />
time. For example, cell W1 appearing on the 7.2 <strong>an</strong>d 9.1 km sc<strong>an</strong>s at 1616<br />
represents the first discrete development <strong>an</strong>d is seen on later sequences<br />
(1631 <strong>an</strong>d 1647) to descend <strong>an</strong>d move through the echo complex as cells W2 <strong>an</strong>d<br />
W3 form <strong>an</strong>d progress in like m<strong>an</strong>ner. Nearly vertical dashed lines are<br />
included to show vertical continuity <strong>of</strong> mature cells at the time <strong>of</strong> each new<br />
echo formation. Cross sections <strong>of</strong> radar reflectivity in Fig. 6 show the two-<br />
dimensional radar structure in vertical pl<strong>an</strong>es aligned along line segments<br />
shown at selected altitudes on the PPI sc<strong>an</strong>s in Fig. 5.<br />
Common features <strong>of</strong> cells W1 through W5, evident in Figs. 5 <strong>an</strong>d 6, are <strong>an</strong><br />
average altitude <strong>of</strong> first appear<strong>an</strong>ce near 7 km <strong>an</strong>d a tendency to form at<br />
a dist<strong>an</strong>ce <strong>of</strong> 5 to 10 km ahead <strong>of</strong> the southward-moving complex at intervals <strong>of</strong><br />
about 15 min. They all grow rapidly in size <strong>an</strong>d intensity, moving in a<br />
relative sense toward the main echo, soon becoming its primary component.<br />
As shown at 1631, 1703, <strong>an</strong>d 1716 IDT in Fig. 6, as m<strong>an</strong>y as three in the series<br />
<strong>of</strong> five cells coexist in varying stages <strong>of</strong> development. For inst<strong>an</strong>ce, when W5<br />
first appeared shortly before 1716, 1W4 was approaching maturity <strong>an</strong>d W3 was in<br />
the early part <strong>of</strong> its decaying stage. Whereas the multicell model <strong>of</strong> Marwitz<br />
(1972b) specifies lateral alignment <strong>of</strong> coexisting cells across the direction<br />
<strong>of</strong> overall storm motion, Figs. 5 <strong>an</strong>d 6 show that the cells in this case tend<br />
to be aligned along the direction <strong>of</strong> system movement.<br />
The structure on the right <strong>of</strong> the vertical reflectivity pr<strong>of</strong>iles in Fig. 6,<br />
particularly at times 1631, 1703 <strong>an</strong>d 1716 MDT, is rather similar to the weak
8 -<br />
4<br />
1 2<br />
//^^wo<br />
1-13<br />
" 001° ,-> 181°<br />
____ /1616 (MDT)<br />
0 ----------------------<br />
I W2<br />
8 '<br />
W3<br />
4 \ / - CL O/D 8ASE-<br />
1647<br />
0 ,I . I.<br />
12 12 -<br />
3600 1800<br />
8<br />
4W<br />
W4<br />
)~ m V\ /703<br />
o 0 , I I<br />
KM 50 1 20 915<br />
Fg1. 6 Vetca c con1 o tada eecvty agned aong inW<br />
1716<br />
KM 5 I 0 15 20<br />
Fig. 6 Venticat ctoss Sections6 <strong>of</strong> radar trefectivity atigned along tine<br />
zegments shown fo each time in Fig. 5. ReRectivity covtourw<br />
represent 10 dB 4teps above 30 dBZ. Cels aLe Rabeled as Zn F g. 5. HoiLzontMl<br />
<strong>an</strong>d veticae dUit<strong>an</strong>ce scales ar equtvaee nt. The heighkt oa the H<br />
ttrpopautse <strong>an</strong>d the attude <strong>of</strong> <strong>an</strong> aLctra4t penetation (Pait IV) arLe indicated<br />
on the. 1716 croa s e.ction.
1-14<br />
echo region (WER) associated with updraft regions in supercell phenomena<br />
(Browning, 1964; Marwitz, 1972a; <strong>an</strong>d Chisholm, 1973). Marwitz (1972b) <strong>an</strong>d<br />
Chisholm <strong>an</strong>d Renick (1972) point out that weak echo regions are also common<br />
features <strong>of</strong> multicell storms but that they are tr<strong>an</strong>sitory <strong>an</strong>d occur as a<br />
result <strong>of</strong> the discrete echo recurrence in the forward sector <strong>of</strong> the storm. In<br />
contrast to the persistent overh<strong>an</strong>g in the supercell case, we conclude that the<br />
echo overh<strong>an</strong>g depicted at times 1631 <strong>an</strong>d 1716 in Fig. 6 is formed by new echo<br />
developing adjacent to <strong>an</strong>d quickly joining existing mature <strong>an</strong>d decaying cells.<br />
In both the supercell <strong>an</strong>d multicell cases, however, the overh<strong>an</strong>g implies the<br />
existence <strong>of</strong> updrafts supporting suspended precipitation particles.<br />
The cells identified in Figs. 5 <strong>an</strong>d 6 were not the only cells appearing<br />
in the storm between 1610 <strong>an</strong>d 1730 MDT; there were m<strong>an</strong>y smaller ones which<br />
grew <strong>an</strong>d decayed rapidly, having only a minor effect on the storm's overall<br />
configuration <strong>an</strong>d evolution. There were also a few stronger cells which<br />
appeared periodically in a WSW direction <strong>an</strong>d close to (within 3 km) existing<br />
mature W cells, about 15 min after their appear<strong>an</strong>ce as a first echo. The<br />
evolution <strong>of</strong> these was not easily distinguishable from that <strong>of</strong> the W cells<br />
but they are thought to be peripheral developments related to updraft circula-<br />
tions supporting the primary W cells. Since the W cells labeled 1 through.5<br />
seemed to have the dominating influence on the storm's propagation, we will<br />
give special attention to their formation <strong>an</strong>d evolution.<br />
b. Location <strong>of</strong> new cells<br />
The actual horizontal location <strong>of</strong> each new cell formation is shown in<br />
Fig. 7 with time <strong>an</strong>d approximate height <strong>of</strong> first echo detection also indicated.<br />
The locus <strong>of</strong> points identifying new cell appear<strong>an</strong>ce forms nearly a straight<br />
line which represents the direction <strong>of</strong> motion for the storm as a whole. As<br />
mentioned in Section 2 this was essentially parallel to the direction <strong>of</strong> surface<br />
winds along a zone <strong>of</strong> surface streamline confluence.
1-15<br />
20 '<br />
I<br />
10<br />
WO 7/602 MDT<br />
I (7.5 KMMSL<br />
I<br />
.i~ W~~I ~<br />
.(\NWI Wl 1615<br />
GROVER I<br />
RADAR<br />
W2 /629<br />
/64/<br />
-I0 - I<br />
/65/<br />
WINDS RELATIVE W3 1 /645<br />
TO GROUND 7.0)<br />
VH |I<br />
-20 711<br />
10 W4 /702<br />
VL m sec-' ' (6.5)<br />
VH W5/7<br />
%<br />
WINDS RELATIVE<br />
L TO STORM m~V L '-ecI1 | (7.0)<br />
/ 1 72/<br />
RADAR<br />
-50 NOAA DOPPLER<br />
VM<br />
-50 -<br />
W7 16 /744 1/744<br />
1(7.0)<br />
-60- -60 -<br />
- .<br />
AVERAGE STORM MOVEMENT<br />
O(KM)<br />
I<br />
10<br />
I<br />
20<br />
I<br />
30<br />
I<br />
40 50<br />
Fig. 7 Inveited ;tAi<strong>an</strong>gte& denote the pt<strong>an</strong> pouition oCd t6t echo appear<strong>an</strong>ce<br />
o& ceed&s wo through W7. Tmne <strong>an</strong>d aJtitude (pa.nthenisu) oj6 6Lut<br />
appeat<strong>an</strong>ce aVte abso indicated. Mtvoums Thow the pacth o ceLU (Wl tthA'ough W5<br />
69om 6iZt detection to maximum etecativity. The timne when each wa Reo&t a&<br />
<strong>an</strong> entity is potte.d at the end o5 the. tepective. tkachk. Location6 o6f the<br />
G'LOveLA nttdwat <strong>an</strong>d a NOAAM oppRelt /adaA (Pattt I7T) acte. ndicate.d,<br />
Inset gives envtiomnenta Wind6 'e&attve to the. gwound <strong>an</strong>d to the.<br />
sto'm (designated by a c&tlcel) dj .theee eaQyeu; 4ubteoud, VL, middLe ttopo-<br />
4phee., VM <strong>an</strong>d u.ppei twopozpheLe, lV.
1-16<br />
New cells appear at intervals <strong>of</strong> 13 to 16 min, <strong>an</strong>d at locations approxi-<br />
mately 10 km south <strong>of</strong> the formation point <strong>of</strong> the preceding developments. This<br />
sequence is broken between 1716 <strong>an</strong>d 1744, as <strong>an</strong> <strong>an</strong>ticipated development<br />
corresponding to W6 did not occur. We note, however, that a cell identified<br />
as W7 appeared 28 min after W5 at a dist<strong>an</strong>ce <strong>of</strong> 2 x 10.5 km south <strong>of</strong> the W5<br />
formation point <strong>an</strong>d since these time <strong>an</strong>d space increments are twice the period<br />
<strong>an</strong>d separation <strong>of</strong> earlier developments we include it in the W series. The<br />
close proximity <strong>of</strong> new cell formation to the location <strong>of</strong> surface convergence<br />
maxima at the storm outflow-inflow interface (Part II) suggests that the<br />
periodicity in new cell development may have been related to the downdraft<br />
production by preceding cells during their intense <strong>an</strong>d decaying stages.<br />
c. Tracks <strong>of</strong> individual cells<br />
Paths <strong>of</strong> cells W1 through W5 are shown in Fig. 7 for the length <strong>of</strong> time<br />
each was a distinguishable entity. For the most part, this period includes<br />
the time from first radar detection through intensification to maximum<br />
reflectivity. Following first appear<strong>an</strong>ce each <strong>of</strong> the radar echoes grew<br />
rapidly in size, intensity, <strong>an</strong>d vertical extent. During these early stages<br />
they were nearly stationary with respect to the ground <strong>an</strong>d some even showed<br />
a tendency to move somewhat northward; a direction opposite to the overall<br />
storm movement. During their later developing <strong>an</strong>d mature stages the paths <strong>of</strong><br />
all cells are shown to follow about the same direction, moving from <strong>an</strong> azimuth<br />
<strong>of</strong> 340 to 350 , which is in agreement with the direction <strong>of</strong> V, in Fig. 7m<br />
(upper, inset). Since no southerly flow was observed in the subcloud or<br />
middle tropospheric layers <strong>of</strong> the environment, the short period <strong>of</strong> stationarity<br />
or slight northward movement c<strong>an</strong> be explained only by propagation <strong>of</strong> the radar<br />
echo through the updraft'due to successive particle growth preferentially to
1-17<br />
the rear (north) <strong>of</strong> the updraft. After ascending beyond 7 km the echoes<br />
apparently accommodated to environmental steering winds <strong>an</strong>d beg<strong>an</strong> their south-<br />
southeastward travel. During decay (not shown in Fig. 7) upper portions <strong>of</strong><br />
the echo comprised <strong>of</strong> particles with low terminal fall velocities moved toward<br />
the northeast with a velocity <strong>of</strong> the high level relative winds (VH, in Fig. 7,<br />
lower inset), while lower <strong>an</strong>d larger particles influenced the overall storm<br />
velocity during descent in strong downdrafts associated with the zones <strong>of</strong><br />
maximum low-level reflectivity shown in Figs. 5 <strong>an</strong>d 6 (see also Doppler radar<br />
observations discussed in Part III).<br />
d. Evolution <strong>of</strong> individual cells<br />
Intensification <strong>of</strong> cells W1 through W5 with respect to time is given by<br />
the growth curves <strong>of</strong> reflectivity factor, Z (dBZ), in Fig. 8. The 15 min<br />
periodicity for new cell development is again demonstrated here. The average<br />
rate <strong>of</strong> echo intensification for the various cells increases with time from<br />
about 1 dB min 1 for cell W1 to %4 dB min 1 for W5. The fastest growth, that<br />
<strong>of</strong> W5, is about half the rate reported by Browning <strong>an</strong>d Atlas (1965) for the<br />
early stages <strong>of</strong> a tornadic Oklahoma thunderstorm but about the same as the rate<br />
computed from data presented by Renick (1971) pertaining to a multicell hail-<br />
storm in Alberta. The indicated increase <strong>of</strong> growth rate with time may be<br />
related to a corresponding increase in the strength <strong>of</strong> updrafts supporting the<br />
later cells <strong>an</strong>d/or to ch<strong>an</strong>ges in the size <strong>an</strong>d distribution <strong>of</strong> aerosols. Since<br />
subcloud thermodynamic characteristics along the path <strong>of</strong> the storm were fairly<br />
uniform in time <strong>an</strong>d space (Part II), the increase was not likely to be dominated<br />
by static stability variations <strong>an</strong>d we look to increasing mesoscale convergence<br />
<strong>an</strong>d to the possible ingestion <strong>of</strong> larger aerosols as expl<strong>an</strong>atory mech<strong>an</strong>isms.<br />
Visible dust curtains rising at least halfway from the surface to cloud base<br />
were observed at the interface between inflowing <strong>an</strong>d outflowing air by research
N<br />
0<br />
o_<br />
0<br />
0<br />
0<br />
I<br />
1-18<br />
_ , | I _<br />
o<br />
0 1<br />
0- -<br />
" -<br />
-I~ -<br />
Fig. S Curves showing the<br />
growth <strong>of</strong> RadarL refecti.vUy (dBZ), f ot each cele<br />
as a function od time. Dashed Zines show slopes used to obtain<br />
ntens.ficaation rates indicatlve <strong>of</strong> -the early istoat <strong>of</strong> each cele.<br />
I
1-19<br />
aircraft during the latter stages <strong>of</strong> the storm's history. Surface convergence<br />
is discussed further in Part II but no direct measurements <strong>of</strong> aerosols were<br />
available in the present case.<br />
The radar history <strong>of</strong> cell W5 is represented in Fig. 9 by the development<br />
<strong>of</strong> radar reflectivity'contours as a function <strong>of</strong> height <strong>an</strong>d time. According to<br />
Fig. 8, W5 was one <strong>of</strong> the most intense cells in the series. Detailed radar data<br />
showed that its maximum reflectivity reached 68 dBZ below cloud base at about<br />
1733. Pr<strong>of</strong>iles similar to Fig. 9 constructed for the other cells showed that<br />
maximum echo tops for each cell increased progressively with time from about<br />
12 km for W1 to > 14 km for W5. The height <strong>of</strong> Z displayed a general tendency<br />
max<br />
to increase accordingly. This supports the speculation that the strength <strong>of</strong><br />
updrafts supporting successive cells also increased with time. All other charac-<br />
teristics <strong>of</strong> the evolution <strong>of</strong> the W cells were similar to those <strong>of</strong> W5 <strong>an</strong>d we will<br />
center the discussion <strong>of</strong> their general behavior around the pr<strong>of</strong>ile in Fig. 9.<br />
The locus <strong>of</strong> circles plotted at 1-rmin intervals in Fig. 9.is intended to<br />
represent the history <strong>of</strong> precipitation particles influencing the evolution <strong>of</strong><br />
cell W5. The ascent rate <strong>of</strong> visual turrets deduced from cloud photography taken<br />
between 1655 <strong>an</strong>d 1715 was between 5 <strong>an</strong>d 10 m s . This was used to approximate<br />
the particle trajectory between 1700 <strong>an</strong>d 1715 (the time <strong>of</strong> first echo for W5).<br />
From 1715 onward the path traces the history <strong>of</strong> the maximum reflectivity, assumed<br />
to be the trajectory <strong>of</strong> the largest particles. The rationale for relating the<br />
particle growth cycle to the history <strong>of</strong> the maximum reflectivity rests on the<br />
domin<strong>an</strong>t dependence <strong>of</strong> radar reflectivity on particle size.<br />
Of the 30 to 35 min total lifetime from air parcel entry at cloud base<br />
through first echo to the arrival <strong>of</strong> the Z at the ground, about 15 min is<br />
max<br />
spent in rather slow ascent in the rising turrets comprising the shelf cloud<br />
to the south <strong>of</strong> the main system (see Fig. 1, Part II). The temperature scale on<br />
the left in Fig. 9 shows that undiluted air parcels undergoing moist adiabatic
14<br />
12<br />
TROP<br />
-40<br />
1-20<br />
0 5 5 5 5 5<br />
-30<br />
-25<br />
8 --20<br />
-' 5ep 35 dBZ. The aho po e hn<br />
t<br />
I- -1<br />
-1 //<br />
2<br />
SFC<br />
I10<br />
T (OC)<br />
dBZ /ho ontou5<br />
whch<br />
55 50 45 40 35 30 25 20 15 10 05 1700 (MDT)<br />
Fig. 9 Time-hecight pr<strong>of</strong>ie. <strong>of</strong> the radat treftectivity contours fotL cett<br />
at<br />
W5<br />
5 dB intervals above 35 dBZ. The echo<br />
the<br />
pr<strong>of</strong>{ite<br />
history<br />
as shorxn<br />
<strong>of</strong><br />
/ep&sent6<br />
particles that remained al<strong>of</strong>t for the longest petiod<br />
The dazshed<br />
o 4time.<br />
35 dBZ contowL tepreseents the historty <strong>of</strong> echo uwhich descended molst<br />
tapidty adteA the dfitt echo appear<strong>an</strong>ce. The tocus <strong>of</strong> citcles pZotted<br />
mnute<br />
at<br />
inteAvats<br />
one-<br />
teptesents the hiLtoty od <strong>an</strong> ait parcel which enter<br />
ceoud<br />
thAough<br />
bae., ascendsz en the ets <strong>of</strong> the t she. cloud <strong>an</strong>d gtour<br />
enough<br />
paaticles<br />
to produce.<br />
arwge<br />
the dZt echo at <strong>an</strong> altitude <strong>of</strong> -7 km.<br />
onwatd<br />
Fhom that<br />
in<br />
point<br />
time the path foRtowm the maximum e.lec.tivty. Schematic ctoud<br />
heights in the. she.Z cloud <strong>an</strong>d at tine <strong>of</strong> fibt<br />
lapzse<br />
echo<br />
photography<br />
ate derived<br />
<strong>an</strong>d<br />
fdom<br />
were<br />
time<br />
u-sed to estimate asce.nt fist rate. pior to echo.<br />
The temperatwue scae. on tef.t rtepr&ee.nts molst adiabatic<br />
for undiiute.d<br />
condtions<br />
satwLted ascent from cloud base.
1-21<br />
ascent would have a temperature <strong>of</strong> -12 C at the average level <strong>of</strong> first echo<br />
appear<strong>an</strong>ce (7 km). Subsequent to first detection the center <strong>of</strong> highest reflecti-<br />
vity ascended rapidly to <strong>an</strong> altitude <strong>of</strong> %9 km. At about the same time two<br />
closely spaced reflectivity maxima appeared. These are evident on the vertical<br />
section at 1716 in Fig. 6. The pr<strong>of</strong>ile in Fig. 9 represents the history <strong>of</strong><br />
the reflectivity maximum nearer the forward edge <strong>of</strong> the storm. The one to the<br />
rear descended toward the surface at <strong>an</strong> earlier time <strong>an</strong>d the history <strong>of</strong> its<br />
leading edge is represented by the dashed 35-dBZ contour. In addition to this<br />
double structure in Z along the vertical pl<strong>an</strong>e, <strong>an</strong>alysis <strong>of</strong> cross sections<br />
max<br />
adjacent to those used to construct Fig. 9, indicated that radar echo in the<br />
northeast sector <strong>of</strong> W5.also formed <strong>an</strong>d descended earlier th<strong>an</strong> did the contours<br />
as shown in Fig. 9. Both <strong>of</strong> these factors account for the lack <strong>of</strong> agreement<br />
between intensification rates shown for W5 in Figs. 8 <strong>an</strong>d 9. The reflectivity<br />
contours in Fig. 9 trace the history <strong>of</strong> particles that remained al<strong>of</strong>t for the<br />
longest period <strong>of</strong> time <strong>an</strong>d these had slower intensification rates th<strong>an</strong> those<br />
used to produce the W5 curve in Fig. 8.<br />
Following ascent to near 9 km the maximum reflectivity remained suspended<br />
there for a period <strong>of</strong> 10 to 12 min. During most <strong>of</strong> this time it resided in a<br />
region where the in-cloud temperature was less th<strong>an</strong> -20 C. When radar reflectivity<br />
reached 55 dBZ, descent <strong>of</strong> Z toward the ground beg<strong>an</strong>; at first slowly but with<br />
max<br />
a rapid cascade during the final 3 to 5 min. During these latter stages the<br />
slope <strong>of</strong> the high reflectivity contours with time gives a descent rate <strong>of</strong> about<br />
-1 -1<br />
30 to 35 m s . Maximum observed downdraft was 415 m s (Part III), <strong>an</strong>d<br />
the terminal fall velocity <strong>of</strong> the largest observed hailstones (1.5 cm, diameter)<br />
would be 420 m s so that there is reasonable agreement between the radar<br />
echo history, hailstone size <strong>an</strong>d measured Doppler downdraft velocity.
1-22<br />
4. Storm motion in relation to the tr<strong>an</strong>slation <strong>an</strong>d propagation <strong>of</strong> individual<br />
cells<br />
For examining the relationship between cell motion <strong>an</strong>d the movement <strong>of</strong><br />
the overall storm we refer to Fig. 10 which gives a continuous plot <strong>of</strong> radar<br />
reflectivity contours as a function <strong>of</strong> time along a y-axis which is aligned<br />
along the north to south direction <strong>of</strong> storm movement. At <strong>an</strong>y inst<strong>an</strong>t the<br />
forward <strong>an</strong>d trailing edges <strong>of</strong> storm W, usually in the altitude r<strong>an</strong>ge <strong>of</strong> 4-8 km,<br />
are represented by the outer (30 dBZ) contours <strong>of</strong> the radar echo b<strong>an</strong>d.<br />
Interior contours similarly represent the leading <strong>an</strong>d trailing edges <strong>of</strong> the<br />
higher reflectivity levels. For the most part, the leading edge (greatest<br />
y at <strong>an</strong>y x <strong>an</strong>d z at a given t) is defined by the leading edge <strong>of</strong> the newly<br />
forming W cells whose individual histories are traced by the heavy arrows.<br />
Alternating dashed <strong>an</strong>d dotted contours, superimposed on the continuous contours<br />
show the history <strong>of</strong> the trailing edges <strong>of</strong> the individual cells for the periods<br />
that they existed as discrete entities. Since they formed mainly to the south<br />
<strong>of</strong> the main system, their trailing edges consistently appeared at y-values<br />
greater th<strong>an</strong> contours tracing the continuity <strong>of</strong> the overall storm. With time,<br />
however, the contours <strong>of</strong> individual cells show a tendency to blend toward<br />
equivalent contours along the trailing edge <strong>of</strong> the main swath as the cells.<br />
lose their identity <strong>an</strong>d become components <strong>of</strong> the main echo complex. Cell W2<br />
which formed on the right fl<strong>an</strong>k <strong>of</strong> W1, <strong>an</strong>d slightly to the north <strong>of</strong> the leading<br />
edge <strong>of</strong> existing echo (see PPI tilt sequence at 1631 in Fig. 5) was tracked<br />
along a different y-axis th<strong>an</strong> that followed by the main system until it became<br />
a part <strong>of</strong> the overall complex. This explains why its leading edge appears at<br />
smaller y in its early stages.<br />
Most <strong>of</strong> the cells; particularly W2, W4 <strong>an</strong>d W5, exhibit a tendency to move<br />
more slowly in their early stages <strong>an</strong>d to gradually tend toward the velocity<br />
<strong>of</strong> the storm as they intensify. The early period <strong>of</strong> slow movement very likely
1-23<br />
30 (dBz) 4<br />
. /I/ 0 00 I0 50<br />
30 I'0 60<br />
Vs = 0020/10.3<br />
50<br />
m sec 40 /0<br />
3 0<br />
Vc Vc = 3470/4.0 m sec- 1 /' / 5<br />
20 P 0110/6.5 o msec<br />
2S<br />
1620 / / /<br />
(MDT) c1<br />
40~~~~~~~~~~~~~~~~~~~~~~~~~~~~~~~~~~~······<br />
/ /<br />
2'1 :<br />
/ / s1 / /<br />
60<br />
··· ·· · ·<br />
~<br />
6C!/(····<br />
0 (km) 10 20 30 40 50<br />
Fig. 1JO The teadnq (/h4) <strong>an</strong>d ttaitng (zh) edge o te.ectivity contouu,<br />
uwuaaq Zn the a&tttde '<strong>an</strong>ge o 4 to I km, io/<br />
(otid),<br />
itoun W a<br />
<strong>an</strong>d<br />
a whore<br />
4Q the Cee. pe/uodicaty c o2q ing to Zwtain<br />
dashed<br />
it (altenating<br />
<strong>an</strong>d dotted), 4hown az a {unction o6 time.. The abcJZa<br />
t<strong>an</strong>ce<br />
denotes<br />
in ktomete4<br />
dLi-<br />
eentiaf4 due 4outh wom a<br />
Stoping<br />
point<br />
tneu<br />
ne.a the<br />
give<br />
otigin<br />
the.<br />
o6 WI.<br />
peed o0 the. aveage. 4tokm <strong>an</strong>d cea. motion.<br />
Vec-to dUagL<strong>an</strong> Zn the. net 4ummadZze the. iLe.h&ti~onship<br />
Ve., t0bu-on <strong>an</strong>d<br />
be.4we.e.n<br />
^tom, to the- ce.-&t,<br />
V7, motcon. o -. a The. dld^e.ence on made by beAf.een dCt the. popagaon, tNo /eLe^nt V theh con
1-24<br />
corresponds to the period <strong>of</strong> strongest updrafts <strong>an</strong>d as updrafts decreased, partly<br />
in response to water loading associated with increasing reflectivity, the cells<br />
tended to assume the velocity <strong>of</strong> the mid-level ambient wind (see Fig. 7, inset).<br />
Closed 60-dBZ contours (shaded streaks) <strong>of</strong> varying duration <strong>an</strong>d length<br />
appear in Fig. 10 toward the end <strong>of</strong> each cell's traceable history. These vary<br />
in length from 6 to 20 km <strong>an</strong>d in duration from 12 to 33 min. The one <strong>of</strong><br />
longest duration seems to have been formed successively by two or more cells<br />
(WO, W1, <strong>an</strong>d W2) so that <strong>an</strong> average length <strong>an</strong>d duration would be somewhere<br />
between 6 <strong>an</strong>d 10 km <strong>an</strong>d 10 to 12 min, respectively. Ground areas below these<br />
high reflectivity streaks are reasonably the most favored regions <strong>of</strong> hailfall<br />
<strong>an</strong>d very likely correspond to the hailstreak phenomena discussed by Ch<strong>an</strong>gnon<br />
(1970). Although "ground truth" measurements were not available, hail was<br />
apparently generated <strong>an</strong>d deposited at the ground in a cyclic m<strong>an</strong>ner related to<br />
the periodic evolution <strong>of</strong> individual updrafts through the multicellular storm.<br />
Slopes <strong>of</strong> y with respect to time shown in Fig. 10 give the average speed<br />
for both the storm, V, <strong>an</strong>d its cells, V . Directions <strong>of</strong> cell <strong>an</strong>d storm movement<br />
S c<br />
are taken from Fig. 7. Vectors representing the average storm (V ) <strong>an</strong>d cell<br />
s<br />
(Vc) velocities are plotted in the inset. Subtraction <strong>of</strong> the cell motion vector<br />
from the average overall storm motion gives the result<strong>an</strong>t labeled V . This<br />
p<br />
vector has a magnitude <strong>of</strong> 6.5 m s <strong>an</strong>d represents the component <strong>of</strong> storm<br />
velocity contributed by discrete propagation through new cell development on<br />
the right forward fl<strong>an</strong>k <strong>of</strong> the storm. Reference to Fig. 5 shows that the orien-<br />
tation <strong>of</strong> V represents the general direction for the location <strong>of</strong> new cell<br />
p<br />
formation with respect to the existing echo. Since propagation contributes<br />
-1<br />
6.5 m s to the storm movement <strong>an</strong>d discrete propagation occurs at a period<br />
<strong>of</strong> 15 min (900 s) we would expect the separation between existing radar<br />
reflectivity maxima <strong>an</strong>d new echo to be around 6 km .on the average. Figure 6
1-25<br />
shows that at the time <strong>of</strong> first echo appear<strong>an</strong>ce the dist<strong>an</strong>ce between new <strong>an</strong>d mature<br />
elements varies from 5 to 10 km, in fair agreement with the <strong>an</strong>ticipated value.<br />
Thus, in summary, the motion <strong>of</strong> the main body <strong>of</strong> the storm was the result<br />
<strong>of</strong> two components; one due to the advection <strong>of</strong> individual cells along the<br />
direction <strong>of</strong> middle level winds <strong>an</strong>d slightly to the left <strong>of</strong> the overall storm<br />
movement, <strong>an</strong>d <strong>an</strong>other due to the periodic <strong>an</strong>d discrete propagation by new<br />
cell formation on the right forward fl<strong>an</strong>k <strong>of</strong> the echo. In the present case<br />
it is clearly the propagative component that has the domin<strong>an</strong>t influence on<br />
overall storm motion. These results are similar to the general multicellular<br />
model proposed by Browning <strong>an</strong>d Ludlam (1960) which has been found applicable<br />
in other High Plains thunderstorm studies by Marwitz (1972b) <strong>an</strong>d by Chisholm<br />
<strong>an</strong>d Renick (1972).<br />
5. Summary<br />
We have <strong>an</strong>alyzed in considerable detail the radar structure <strong>of</strong> one <strong>of</strong>.the<br />
m<strong>an</strong>y multicellular thunderstorms that occurred in northeast Colorado on 9 July<br />
1973. The hailstorm receiving our concentrated attention had a lifetime <strong>of</strong><br />
nearly 2 hours <strong>an</strong>d was comprised <strong>of</strong> at least seven distinct cells which domi-<br />
nated its overall behavior. With maximum radar tops <strong>of</strong> 14 km <strong>an</strong>d maximum hail<br />
size <strong>of</strong> 1.5 cm, diameter, the storm c<strong>an</strong> be classified as moderate in intensity.<br />
A periodic mode <strong>of</strong> cell development <strong>an</strong>d evolution was characterized by<br />
discrete propagation <strong>of</strong> new cells forming at <strong>an</strong> average altitude <strong>of</strong> 7 km (-12C).<br />
*on the storm's right forward fl<strong>an</strong>k, 5 to 10 km ahead (south) <strong>of</strong> existing storm<br />
components at a frequency <strong>of</strong> about once every 15 min. This infrequent rate <strong>of</strong><br />
new cell development may be compared to <strong>an</strong> average <strong>of</strong> one every 5 min found in<br />
<strong>an</strong> Alberta hailstorm similarly <strong>an</strong>alyzed by Renick (1971).<br />
After first radar detection all cells grew rapidly in size <strong>an</strong>d intensity<br />
<strong>an</strong>d, by moving more slowly in their early stages th<strong>an</strong>.the overall echo, soon<br />
became the main storm component. Average lifetime <strong>of</strong> individual cells, including
1-26<br />
the time from visually perceptible turrets to 'first echo' through decay, was<br />
45 min. Of this period, 30 to 35 min was radar-detectable history; approxi-<br />
mately 15 min being spent in growth <strong>of</strong> precipitation particles to radar detect-<br />
able sizes during ascent from cloud base (3.8 km) to the altitude <strong>of</strong> first<br />
detection byradar. With a formation interval <strong>of</strong> 15 min <strong>an</strong>d a cell lifetime<br />
<strong>of</strong> 45 min, at <strong>an</strong>y inst<strong>an</strong>t, as m<strong>an</strong>y as three cells were found to coexist in<br />
varying stages <strong>of</strong> development. At a particular stage in the evolution <strong>of</strong> each<br />
cell, a vertical two-dimensional radar structure resembling the weak echo region<br />
<strong>an</strong>d forward overh<strong>an</strong>g typical <strong>of</strong> supercell thunderstorms was observed. In<br />
contrast to the supercell case, these features were quite tr<strong>an</strong>sitory <strong>an</strong>d a<br />
result <strong>of</strong> the new echoes joining with the main echo soon after their formation<br />
as discrete entities.<br />
Overall storm motion, from the north at <strong>an</strong> average speed <strong>of</strong> 10 m s,<br />
was dominated by the propagation <strong>of</strong> the cells on its right forward fl<strong>an</strong>k. The<br />
average speed <strong>of</strong> cells was only 40% <strong>of</strong> the storm speed, hence the propagational<br />
component contributed well over half the storm's motion. Cell motion was<br />
quite slow in early stages <strong>of</strong> growth but tended with time toward the direction<br />
<strong>of</strong> the wind in the middle troposphere <strong>an</strong>d eventually moved with about half its<br />
speed. After maturity <strong>an</strong>d during decay the upper portions <strong>of</strong> the cells were<br />
carried out in the <strong>an</strong>vil in the northeastward direction <strong>of</strong> relative winds at<br />
the high levels (10-12 km), while the lower parts moved southward as components<br />
<strong>of</strong> the main body <strong>of</strong> the storm.<br />
Although the general characteristics <strong>an</strong>d behavior <strong>of</strong> individual cells were<br />
similar, as might be expected some irregularities <strong>an</strong>d variations were observed.<br />
Maximum radar echo tops, maximum radar reflectivity, <strong>an</strong>d intensification rate<br />
all showed a tendency to increase with time, <strong>an</strong>d this increase appeared to be<br />
related to a corresponding increas e strength <strong>of</strong> updrafts supporting the<br />
successive cells.
1-27<br />
Consistent with the evolving radar structure, b<strong>an</strong>ds <strong>of</strong> high reflectivity<br />
appearing on y-t plots (Fig. 10) suggests that hail production at the ground<br />
occurred in streaks <strong>an</strong>d this b<strong>an</strong>dedness indicates that there was one major<br />
precipitation burst per cell. Largest hailstones measured at the ground were<br />
1.5 cm in diameter. Analysis <strong>of</strong> time lapse photography <strong>of</strong> growing cloud<br />
turrets <strong>an</strong>d the subsequent history <strong>of</strong> maximum reflectivity as it evolved from<br />
first echo through descent to the ground indicates that the total time avail-<br />
able for growing hailstones <strong>of</strong> the observed size within the individual cells<br />
was between 30 <strong>an</strong>d 35 min. Of this period, dwell time at temperatures lower<br />
th<strong>an</strong> -20t was on the order <strong>of</strong> 10 to 12 min.<br />
Thermodynamic variables <strong>an</strong>d airflow structure near <strong>an</strong>d beneath storm W<br />
are elaborated in Part II <strong>of</strong> this series. Parts III <strong>an</strong>d IV present internal<br />
airflow <strong>an</strong>d microphysical measurements <strong>an</strong>d Part V summarizes <strong>an</strong>d synthesizes<br />
the complete observational set.
1-28<br />
REFERENCES<br />
Browning, K. A., 1964: Airflow <strong>an</strong>d precipitation trajectories within severe<br />
local storms which travel to the right <strong>of</strong> the winds. J. Atmos. Sci.<br />
21, 634-639.<br />
_ , <strong>an</strong>d F. H. Ludlam, 1960: Radar <strong>an</strong>alysis <strong>of</strong> a hailstorm. Tech. Note<br />
No. 5, Dept. <strong>of</strong> Meteor., Imperial College, London, 106 pp.<br />
_ , <strong>an</strong>d D. Atlas, 1965: Initiation <strong>of</strong> precipitation in vigorous convective<br />
clouds. J. Atmos. Sci., 22, 678-683.<br />
Ch<strong>an</strong>gnon, S. A., Jr., 1970: Hailstreaks. J. Atmos. Sci., 27, 109-125.<br />
Chisholm, A. J., 1973: Alberta hailstorms, Part I:' Radar studies <strong>an</strong>d airflow<br />
models. Meteor. Monogr., 14 (36), 1-36.<br />
__ , <strong>an</strong>d J. H. Renick, 1972: The kinematics <strong>of</strong> multicell <strong>an</strong>d supercell<br />
Alberta hailstorms. Alberta Hail Studies 1972, Research Council <strong>of</strong><br />
Alberta, Hail Studies Report No. 72-2, 24-31.<br />
Eccles, P. J., 1975: Developments in radar meteorology in the National Hail<br />
Research Experiment to 1973. Atmospheric Technology Fall-Winter 1974-75,<br />
National Center for Atmospheric Research, Boulder, Colo., 34-45.<br />
F<strong>an</strong>khauser, J. C., 1974: Subcloud air mass <strong>an</strong>d moisture flux attending a<br />
'northeast Colorado thunderstorm complex. Preprints, Conference on Cloud<br />
Physics, Oct. 1974, Amer. Meteor. Soc. Boston, 271-2<strong>76</strong>.<br />
Foote, G. B., <strong>an</strong>d J. C. F<strong>an</strong>khauser, 1973: Airflow <strong>an</strong>d moisture budget beneath<br />
a northeast Colorado hailstorm. J. Appl. Meteor., 12, 1330-1353.<br />
Knight, C. A., N. C. Knight, J. E. Dye, <strong>an</strong>d V. Toutenho<strong>of</strong>d, 1974: The mech<strong>an</strong>ism<br />
<strong>of</strong> precipitation formation in northeastern Colorado cumulus. I. Observa-<br />
tions <strong>of</strong> the precipitation itself. J. Atmos. Sci., 31, 2142-2147.
1-29<br />
Marwitz, J. D., 1972a: The structure <strong>an</strong>d motion <strong>of</strong> severe hailstorms. Part I:<br />
Supercell storms. J. Appl. Meteor., 11, 166-179.<br />
__ , 1972b: The structure <strong>an</strong>d motion <strong>of</strong> severe hailstorms. Part II: Multi-<br />
cell storms. J. Appl. Meteor., 11, 180-188.<br />
__ 1972c: Precipitation efficiency <strong>of</strong> thunderstorms on the High Plains.<br />
Preprints, Third Conf. Wea. Modification, Rapid City, S. D., Amer. Meteor.<br />
Soc., 245-247.<br />
Nicholas, T. R., 1975: Surface hail instrumentation in the NHRE. Preprints,<br />
NHRE Symposium/Workshop on Hail <strong>an</strong>d Its Suppression, Estes Park, Colo.<br />
(unpublished m<strong>an</strong>uscript).<br />
Renick, J. H., 1971: Radar reflectivity pr<strong>of</strong>iles <strong>of</strong> individual cells in a<br />
persistent multicellular Alberta hailstorm. Preprints, Seventh Conference<br />
on Severe Local Storms, Amer. Meteor. Soc. Boston, 63-70.
<strong>Structure</strong> <strong>of</strong> <strong>an</strong> <strong>Evolving</strong> <strong>Hailstorm</strong>, Part II:<br />
Thermodynamic <strong>Structure</strong> <strong>an</strong>d Airflow in the Near Environment<br />
by<br />
J. C. F<strong>an</strong>khauser<br />
National Center for Atmospheric Researchl<br />
Boulder, Colorado<br />
1 This research was performed as part <strong>of</strong> the National Hail Research Experiment,<br />
m<strong>an</strong>aged by the National Center for Atmospheric Research <strong>an</strong>d sponsored by the<br />
Weather Modification ,Program, Research Applications Directorate, National<br />
Science Foundation.
ABSTRACT<br />
A diverse set <strong>of</strong> mesoscale observations collected in the National Hail<br />
Research Experiment in connection with <strong>an</strong> evolving Colorado hailstorm is<br />
<strong>an</strong>alyzed to determine the kinematic <strong>an</strong>d thermodynamic structure <strong>of</strong> the near<br />
environmental <strong>an</strong>d subcloud regimes. The <strong>an</strong>alysis centers on multi-level<br />
aircraft measurements in the inflow sector <strong>an</strong>d on mesoscale observations at<br />
the surface <strong>an</strong>d al<strong>of</strong>t. Although considerable evolution was observed in<br />
overall radar echo development patterns, ch<strong>an</strong>ges in one <strong>of</strong> the m<strong>an</strong>y storms<br />
detected occurred in a systematic <strong>an</strong>d periodic m<strong>an</strong>ner. The inst<strong>an</strong>t<strong>an</strong>eous<br />
structure <strong>of</strong> the subcloud inflow into this storm is emphasized in the present<br />
work.<br />
Surface <strong>an</strong>d aircraft data subst<strong>an</strong>tiate the following characteristics:<br />
Inflow air approached the front <strong>of</strong> the storm, originating from a very shallow<br />
layer (< 500 m) near the ground <strong>an</strong>d ata considerable dist<strong>an</strong>ce (> 20 km)<br />
upstream in the relative wind direction. Inflow air rose unmixed to at<br />
least cloud base, feeding the main updraft which was inclined upward in a<br />
direction opposite to the storm movement. Discrete inflow-updraft br<strong>an</strong>ches<br />
were found to be supporting coexisting cells in varying'stages <strong>of</strong> development.<br />
These had lateral widths <strong>of</strong> 6-8 km <strong>an</strong>d were separated by regions <strong>of</strong> weak<br />
subsidence. Downdraft air approached the storm from the right fl<strong>an</strong>k at mid-<br />
cloud level <strong>an</strong>d at least a portion descended unmixed to the ground in the<br />
strongest downdrafts.
1. Introduction<br />
II-1<br />
General environmental characteristics <strong>an</strong>d the detailed radar echo structure<br />
<strong>of</strong> <strong>an</strong> evolving multicellular hailstorm, the so-called Raymer storm, observed in<br />
the National Hail Research Experiment on 9 July 1973 are presented in Part I <strong>of</strong><br />
this series. This paper investigates the kinematic <strong>an</strong>d thermodynamic properties<br />
<strong>of</strong> the air near <strong>an</strong>d beneath the sorm, as deduced from multi-level aircraft<br />
measurement, primarily in the inflow sector, <strong>an</strong>d from mesoscale observations at<br />
the surface <strong>an</strong>d al<strong>of</strong>t.<br />
In Part I the subject thunderstorm has been identified as storm W, <strong>an</strong>d<br />
that nomenclature will be preserved here. Conventions adopted there for refer-<br />
encing time <strong>an</strong>d height will also be the same. During much <strong>of</strong> its radar-detectable<br />
lifetime, shown by the PPI sequence in Part I, Fig. 4, storm W was under the<br />
surveill<strong>an</strong>ce <strong>of</strong> five research aircraft. These included three Queen Airs [two<br />
from the National Center for Atmospheric Research (<strong>NCAR</strong>), Research Aviation<br />
Facility (N304D <strong>an</strong>d N306D) <strong>an</strong>d one operated by the University <strong>of</strong> Wyoming, Depart-<br />
ment <strong>of</strong> Atmospheric Sciences (NlOUW)]; the <strong>NCAR</strong> Buffalo (N326D); <strong>an</strong>d the T-28<br />
penetration aircraft flown by the South Dakota School <strong>of</strong> Mines <strong>an</strong>d Technology<br />
whose measurements are discussed in Part IV <strong>of</strong> this series. Altitudes sounded by<br />
the various aircraft near <strong>an</strong>d within the storm are indicated in Part I, Fig. 3.<br />
2. Physical cloud features<br />
To provide a point <strong>of</strong> departure <strong>an</strong>d reference for the <strong>an</strong>alysis that follows<br />
it is useful to describe features <strong>of</strong> storm W's visual appear<strong>an</strong>ce <strong>an</strong>d to put them<br />
in the context <strong>of</strong> radar characteristics presented in Part I. This purpose is<br />
served by a composite photograph (Fig. 1), constructed from sequential pictures<br />
taken at 1719 from <strong>an</strong> <strong>NCAR</strong> research aircraft flying toward the cloud on a north-<br />
easterly heading at a'position v40 km southwest <strong>of</strong> the center <strong>of</strong> the storm.<br />
The vertical pl<strong>an</strong>e has a southeast (right) to northwest orientation <strong>an</strong>d is nearly<br />
parallel to line AB in Fig. 2.
CLD BASE<br />
II-2<br />
SURFACE T<br />
-~L~L~1N~ STORM<br />
Fig. I Composite photograph <strong>of</strong> m uticedua&L t iundwsz tomi ccmplex (stosm<br />
W <strong>an</strong>d E) 6tom tesearch Acircta t fying at <strong>an</strong> atituade <strong>of</strong> 3.5 km <strong>an</strong>d<br />
at a diUt<strong>an</strong>ce <strong>of</strong> %40 km (WS( <strong>of</strong> the center o s-toIm W0 at 17J19, 9 July 1973.<br />
Ouientation o the veUtca2 pl<strong>an</strong>e is neaIly paatRel to eine AB in F.ig. 2.<br />
Signiic<strong>an</strong>t cloud eeatsUeA are RabeRed <strong>an</strong>d tocaiaons <strong>of</strong> tadac echoes assoacited<br />
wth ;the majon ceL& campnising stotm W are identidied. The point od<br />
cloud entrLy 6aor te T-28 aicraft peneattion dscussed in Pa-t IV ui designated<br />
by <strong>an</strong> X.
-<br />
11-3<br />
3 4<br />
42.3 \<br />
~ \\ \ \\9 \ 2\ 308.4 339.4<br />
\ 10.3<br />
315.7<br />
315.7<br />
343.4<br />
343.4<br />
8.9<br />
u /C_ Z~i \ 318.8\3454 ^/^ '- 31 349 1\\-<br />
30\<br />
3_58945.6.<br />
20 30 40 50 60<br />
Fig. 2 Cloud base. PPI radar echo reflectivty contoum (10 dB Lntervats, as<br />
E n a Fg. 4, Paut I) <strong>an</strong>d 3 u9tace seamines stormn euve to W <strong>an</strong>d<br />
E cft 1710. Peotted data at mesonet ites inc2ude potentia temperature<br />
edt),<br />
(upper<br />
eq.uva.ent potenta temperatue (uppeQ<br />
aight).<br />
right) <strong>an</strong>d<br />
Heavy<br />
mixing<br />
barbed<br />
ratio<br />
confuent<br />
(tower<br />
asymptote identiies boundary <strong>of</strong> outfow<br />
storms<br />
from<br />
W <strong>an</strong>d E. Hatched regions khow<br />
exceecding<br />
tocations<br />
10<br />
<strong>of</strong> horuzontaL convergence<br />
- 3 s- 1 . Dot wuh schexmatic ctoud otune. hos reati<br />
on<br />
ve<br />
new<br />
ocaion<br />
c ,el , W5, Pon oa <strong>an</strong> domcinating s&iues the evoion oi sStom W. Dahe.d<br />
cork crUe ttack at towV center e designates relative. potetiaon <strong>of</strong> aurcrate<br />
descent sownding. VDahed fine (AB) hac orntaton section <strong>of</strong>n veticc.at in<br />
Fig. 8. Border s ltabeled in kilomettes east <strong>an</strong>d south <strong>of</strong> Grover, Colorado.
11-4<br />
Cells comprising storm W form the cloud mass extending from the central<br />
foreground, leftward. The tallest cumulonimbus tower (top, center) represents<br />
the rapidly intensifying cell, W5 (see Part I, Figs. 8 <strong>an</strong>d 9). Photogrammetric<br />
<strong>an</strong>alysis places the visual top between 12 <strong>an</strong>d 13 km. Slightly to its left the<br />
more diffuse dome <strong>of</strong> cell W4 is visible. At the time <strong>of</strong> the photograph it was<br />
nearing the end <strong>of</strong> its mature stage <strong>an</strong>d was approaching the early stages <strong>of</strong> decay.<br />
Perspective <strong>an</strong>d stage <strong>of</strong> growth do not permit resolution <strong>of</strong> visual features<br />
associated with cell W3, but radar <strong>an</strong>alyses (Part I) show that it was in its<br />
late stages <strong>of</strong> decay <strong>an</strong>d is undoubtedly embedded in the cloud mass seen in the<br />
left background. Crisp cumulonimbus cloud outlines in the right background are<br />
associated with storm E, the eastern neighbor <strong>of</strong> storm W, briefly discussed in<br />
Part I <strong>an</strong>d identified in Fig. 2.<br />
Other physical features shown in Fig. 1, most <strong>of</strong> which appeared with greater<br />
clarity on original prints, are labelled for reference. A portion <strong>of</strong> the<br />
<strong>an</strong>vil is visible at the upper left but, as high altitude relative winds (Part I,<br />
Fig. 7, lower inset) dictate, the main storm "blow <strong>of</strong>f" is largely directed into<br />
the pl<strong>an</strong>e <strong>an</strong>d therefore is not seen. A layer <strong>of</strong> shallow cumulus with m<strong>an</strong>y small<br />
turrets appears in the near field <strong>of</strong> view <strong>an</strong>d to the right <strong>of</strong> storm W. This<br />
region, including the typically flat cloud bases found beneath primary updrafts,<br />
is commonly referred to as the "shelf cloud" <strong>an</strong>d, as we shall see later, is<br />
located in the general relative upwind direction with respect to the subcloud<br />
inflow. Finally, the position <strong>of</strong> heaviest precipitation is identified in the<br />
layer between cloud base altitude <strong>an</strong>d the ground. The physical signific<strong>an</strong>ce<br />
<strong>of</strong> most <strong>of</strong> these visual features will be elaborated <strong>an</strong>d clarified by <strong>an</strong>alysis<br />
to follow.
3. Mesoscale surface <strong>an</strong>alysis<br />
II-5<br />
PPI radar echo configurations in Fig. 2 were observed by the Grover<br />
radar at 1710 when storms W <strong>an</strong>d E lay over the southwest corner <strong>of</strong> the NHRE<br />
mesonetwork. This time corresponds to the middle <strong>of</strong> the period <strong>of</strong> aircraft<br />
investigation <strong>an</strong>d was tahe latest time ihen mesonetwork resolution was possible<br />
in both the inflowing <strong>an</strong>d downdraft br<strong>an</strong>ches <strong>of</strong> the storms' circulation.<br />
The surface streamline pattern in Fig. 2 represents the flow relative<br />
to the moving system. This was derived by subtracting a const<strong>an</strong>t storm<br />
velocity <strong>of</strong> 360°/10 m s - from wind measurements at each <strong>of</strong> the mesonetwork<br />
sites. Enh<strong>an</strong>ced detail, beyond that provided by the given station spacing,<br />
was gained by subjecting <strong>an</strong>alog records from the various observation points<br />
to a time-to-space conversion (see, e. g., Fujita, 1963) <strong>an</strong>d displacing<br />
<strong>of</strong>f-time estimates forward or backward from their actual positions along the<br />
storm's direction <strong>of</strong> motion at increments proportional to the storm's speed.<br />
Such a m<strong>an</strong>ipulation, <strong>of</strong> course, involves the assumption that flow patterns<br />
are steady with time; a premise that in this case is justified over only<br />
short time periods. Observations taken within 15 min <strong>of</strong> the actual map time<br />
were used to produce a field <strong>of</strong> overlapped data from adjacent stations which<br />
provided a reasonable basis for constructing the inst<strong>an</strong>t<strong>an</strong>eous flow pattern<br />
as shown. For clarity only the on-time data are presented. Exceptions are<br />
the two data points (smaller station circles) that are plotted to tle south <strong>of</strong><br />
their actual network locations. These are examples <strong>of</strong> displaced data, having<br />
been observed at stations immediately to tile north at <strong>an</strong> earlier time.<br />
Flow with respect to storm W is best resolved since its path carried it<br />
directly over the four western sites while echo patterns were evolving in a<br />
periodic <strong>an</strong>d systematic m<strong>an</strong>ner. In addition to the surface measurements, much
II-6<br />
<strong>of</strong> the flow structure beneath storm W is supported by radial Doppler velocity<br />
components reported in Part III. Features drawn for the weaker storm E have<br />
less credibility since, as mentioned in Part I, its associated echo patterns<br />
were ch<strong>an</strong>ging more rapidly <strong>an</strong>d sporadically, making the time-to-space<br />
conversion less valid.<br />
The position <strong>of</strong> the confluence line (heavy barbed line) marking the boundary<br />
between air adv<strong>an</strong>cing toward the storm from the southeast <strong>an</strong>d the spreading mass<br />
<strong>of</strong> downdraft air originating beneath the echoes' high reflectivity core coincides<br />
with the location <strong>of</strong> the "temperature break" as defined by Byers <strong>an</strong>d Braham (1949)<br />
in The Thunderstorm. The colocation <strong>of</strong> these two features agrees with the results<br />
<strong>of</strong> Foote <strong>an</strong>d F<strong>an</strong>khauser (1973). The sequential order <strong>of</strong> events observed at the<br />
inflow-outflow interface ahead <strong>of</strong> storm W was similar to the results <strong>of</strong> Charba<br />
(1974): a pressure jump, a windshift closely followed by the gust front, the<br />
temperature break <strong>an</strong>d the peak gust.<br />
The speed <strong>of</strong> the outflow boundary at the time shown was assessed from isochrone<br />
<strong>an</strong>alyses <strong>of</strong> mesonet temperature records to be 12'm s while the leading edge <strong>of</strong><br />
storm W was progressing southward at <strong>an</strong> average rate <strong>of</strong> 10 m s . Isotachs <strong>an</strong>d<br />
isogons were <strong>an</strong>alyzed for the wind field in Fig. 2 to obtain wind components at<br />
2 km intervals. These were used to compute horizontal divergence, V.V. The<br />
-3 -1<br />
locations <strong>of</strong> convergence maxima exceeding a magnitude <strong>of</strong> 10 s are indicated<br />
as stippled regions <strong>an</strong>d are found in zones <strong>of</strong> maximum streamline confluence on<br />
the left <strong>an</strong>d right forward fl<strong>an</strong>ks with respect to the adv<strong>an</strong>cing storm.<br />
Thermodynamic features <strong>of</strong> the surface air lying south <strong>of</strong> the storm are<br />
similar to those shown in Part I, Fig. 2. Potential temperature (0) increases<br />
from east to west while mixing ratio (r) shows a slight gradient <strong>of</strong> opposite<br />
sign over the same space interval. Surface conditions in the immediate.<br />
relative upwind direction from storm W are close to those <strong>of</strong> the lifted parcel<br />
in Part I, Fig. 3.
11-7<br />
The lowest equivalent potential temperature (6e) is found beneath <strong>an</strong>d<br />
e<br />
slightly to the left <strong>of</strong> the echo core <strong>of</strong> storm W. The value <strong>of</strong> 326 K is<br />
slightly colder th<strong>an</strong> the minimum near 500 mb shown for the GRO 1735 sounding<br />
in Part I, Fig. 3 (inset). Relative winds al<strong>of</strong>t (Part I, Fig. 7, lower inset)<br />
<strong>an</strong>d the conservative properties <strong>of</strong> e in moist air processes suggest that one<br />
source for air feeding the downdraft <strong>of</strong> storm W was from the layer between<br />
550 <strong>an</strong>d 450 mb (7-9 km) which was approaching the storm with a relative speed<br />
<strong>of</strong>
II-8<br />
to compensate for storm displacement during the period <strong>of</strong> observation (1704-<br />
1721). Two legs flown in opposite directions are shown in Fig. 3. The track<br />
is derived by subtracting the average storm velocity (360°/10 m s ) from the<br />
aircraft's true ground velocity <strong>an</strong>d recomputing the track relative to the storm's<br />
position as shown at 1710. Thus, only the 1710 position represents the true<br />
ground-referenced location <strong>an</strong>d all others have been adjusted to positions<br />
relative to the moving system. Similarly, wind vectors plotted at 15 s intervals<br />
along the track represent the horizontal flow relative to the storm <strong>an</strong>d are<br />
computed by subtracting storm velocity from the measured winds.<br />
The character <strong>of</strong> the relative flow at this flight altitude (800 m, AGL)<br />
is in close agreement with underlying surface conditions shown in Fig. 2. The<br />
early portion <strong>of</strong> the eastbound traverse (1704-1707) penetrates the outflow<br />
from the downdraft <strong>of</strong> storm W. An abrupt windshift from northeasterly to<br />
southeasterly occurred at about 1707 <strong>an</strong>d a general southeasterly relative flow<br />
existed from that point eastward along the track. Conditions observed on the<br />
westward pass (1714-1721) essentially reflect those <strong>of</strong> the eastward traverse<br />
except that outflow from both storms E <strong>an</strong>d W was encountered, as evidenced by<br />
thermodynamic parameters in Fig. 4 <strong>an</strong>d associated wind perturbations in Fig. 3.<br />
The different relative positions <strong>of</strong> the storm W outflow penetrations on<br />
the two opposite flight legs were helpful in determining the shape <strong>an</strong>d position<br />
<strong>of</strong> the outflow boundary in the southwestern sector<strong>of</strong> the storm. Near the<br />
location <strong>of</strong> new cell development designated as W5 in Fig. 2, vertical juxta-<br />
position <strong>of</strong> the surface inflow-outflow interface <strong>an</strong>d the sharp wind shift noted<br />
in the aircraft winds measured 800 m higher, leads to a nearly vertical outflow<br />
boundary. Surface wind data indicate a strong normal outflow component <strong>an</strong>d a<br />
weak normal inflow component at this location. Farther to the east <strong>an</strong>d more<br />
directly upwind from storm W along line AB, inflowing air at both the surface
II-9<br />
10 , o<br />
\ 10 ms-'<br />
30 .<br />
\ _ W(4) t<br />
40 1,l , B \ 6 _ 0..<br />
20 30 40 50 60<br />
Fig. 3 Taveue,6 at <strong>an</strong> attitude. o. 2.2 km (800 m, AGL) beneath the. he4<br />
ctoud hIown £n Fig. 1 <strong>an</strong>d ac&Laos the. intow to stoWns- W <strong>an</strong>d E,<br />
Ztown by the. <strong>NCAR</strong> B&Lato betwe.e.n 1704 <strong>an</strong>d 1721. The poztion o4 the. outhwcadmovcng<br />
adatdU echoeu L shown at 1710 as kn Fig. 2. Reative.<br />
compe.nsated<br />
awca{t pozation,<br />
4o&L ,to-m motion, U fabee.d at 1-mLn inteAvva& <strong>an</strong>d t.etative. wnd<br />
vecto'u (cate. at uppet k'ght) ae. ptotted at 15-4 intevwaz. The heavy baWbed<br />
tne. hows tocation o4 out4tow boundaqy at tiz alitude. No'thwatd-poLnting<br />
aOVOw 4hcw hthe. po^stion oa vvu&Lcae ve~ocity maxcma (FLg. 4) 4u.ppouting Lndu-<br />
v.duat cQ.e& a& £dewnt4e.d. Lne. AB 4how po4tton <strong>an</strong>d 0/u enut on oj vvutzecua<br />
4e.c-ton Ln Fig. 8. BtoideL -L ZabeJke.d £n kttometeAu e.cat <strong>an</strong>d 4outhi oX G/toveA,<br />
Cotoaado. Color~ado ...<br />
-
II-10<br />
<strong>an</strong>d at flight altitude had a strong component normal to the outflow boundary<br />
while the outflow component in this sector was comparatively weaker. Evidence<br />
points to a greater slope from the vertical for the outflow boundary at this<br />
location.<br />
The best thermodynamic indicators <strong>of</strong> outflow penetration in Fig. 4 are<br />
the zones <strong>of</strong> distinctly cooler 0, signifying the rain-chilled character <strong>of</strong> air<br />
originating from the spreading downdrafts. We also note in Fig. 4 that the<br />
general trends in e <strong>an</strong>d r reflect those at the surface (Fig. 2) in that e<br />
increases from east to west while r displays a decreasing trend over the same<br />
interval. Three zones <strong>of</strong> distinctly higher e are identified as tongues <strong>of</strong><br />
lifted surface air based on the fact that their peak values compare favorably<br />
with those at the surface. Ahead <strong>of</strong> cell E, e <strong>an</strong>d r at flight altitude are<br />
e<br />
somewhat greater th<strong>an</strong> surface values shown in the upwind direction in Fig. 2,<br />
but data presented in Fig. 2, Part I, indicate that air with properties observed<br />
at flight level did exist at the surface over the southeastern portion <strong>of</strong> the<br />
mesonetwork at <strong>an</strong> earlier time.<br />
Vertical velocity resolved by the inertial navigational <strong>an</strong>d gust v<strong>an</strong>e<br />
system on board the Buffalo aircraft is shown in the upper p<strong>an</strong>el <strong>of</strong> Fig. 4.<br />
We note two major peaks, > 5 m s , <strong>an</strong>d a third zone <strong>of</strong> weaker ascending air.<br />
The locations <strong>of</strong> the three vertical velocity maxima are shown in the horizontal<br />
pl<strong>an</strong>e <strong>of</strong> Fig. 3 as heavy northward pointing arrows. An average duration <strong>of</strong><br />
updraft encounter <strong>of</strong> %90 s <strong>an</strong>d <strong>an</strong> average ground speed <strong>of</strong> 90 m s indicates<br />
that the lateral width <strong>of</strong> these ascending br<strong>an</strong>ches was on the order <strong>of</strong> 8 km<br />
at this altitude.<br />
Each updraft maximum is well correlated with zones <strong>of</strong> high e in Fig. 4<br />
<strong>an</strong>d with confluent horizontal wind perturbations in Fig. 3. The easternmost
II-11<br />
02.1 1720 19 18 17 16 1715 14<br />
w(5) I VERTICAL VELOCITY<br />
(m i)<br />
£_ I i . . .<br />
o-5 F -- i i<br />
-I- ______________ - I ___ ,____________ -318<br />
IPOTENTIAL TEMPERATURE<br />
'- '16 --- 316<br />
348 1. l^<br />
38--- 'lI , I ' -<br />
EQUIVALENT POTENTIAL ,<br />
3,46 TEMPERATURE, (K)<br />
34I -<br />
34 2<br />
LIFTED<br />
SURFACE<br />
340 - AIR<br />
MIX IG RATIO K/kg) ,<br />
__ 1 'I<br />
8<br />
21 1720 19 18 17 16 1715 14<br />
Fig. 4 VeAtica velocity, potential tempeatuwe, equivatent potential tempeatwue.<br />
<strong>an</strong>d mixing Artio doL westbound dtight segment (1714-1721)<br />
-n Fig. 3. ,Dashed Unei on theAmodynamic pauameteus denote ambient conditions<br />
<strong>an</strong>d shaded depacutre identif y outflow <strong>an</strong>d inflow encounteus as indicated.<br />
Updlaft maxima a^sociated with discAte. echo entUes corLe&pond to aIoLW6 in<br />
Fig. 3. Veticat dashed line deZignates intercept od the. crLz nection in<br />
Fig. 8.<br />
-
II-12<br />
peak (X1715:15) apparently identifies the primary updraft supporting the<br />
southern cell in storm E. A weaker maximum centered on 1717:15 is located<br />
in the region <strong>of</strong> strongest relative horizontal inflow <strong>an</strong>d later <strong>an</strong>alysis will<br />
reveal this as the source <strong>of</strong> air feeding the mature cell <strong>of</strong> storm W, W4.<br />
Comparison <strong>of</strong> its position with that <strong>of</strong> the outflow boundary in Fig. 2 shows<br />
that this weaker updraft maximum was encountered farther from the inflow-<br />
outflow interface th<strong>an</strong> were the stronger updrafts to the east <strong>an</strong>d west.<br />
Strongest ascending motion was observed at "1719 near the point <strong>of</strong> outflow<br />
penetration <strong>an</strong>d near the wind shift zone discussed earlier. This updraft<br />
was supporting the new cell, W5, developing to the south-southwest <strong>of</strong> the<br />
existing storm-W echoes. It was not yet detectable at the time <strong>an</strong>d altitude<br />
<strong>of</strong> the 1710 PPI sc<strong>an</strong> in Figs. 2 <strong>an</strong>d 3, but its location relative to the main<br />
storm when first detected at r1716 is shown in Fig. 2.<br />
_l<br />
Downward motion <strong>of</strong> 4 m s was measured during the deepest penetration <strong>of</strong><br />
the outflow (1706), but the sharpest <strong>an</strong>d strongest downward gust occurred at<br />
1719:25 near the outflow boundary during the latter <strong>an</strong>d more shallow excursion<br />
through the storm W outflow. Both <strong>of</strong> these penetrations were close to the<br />
region <strong>of</strong> strongest updraft associated with the newly developing cell, W5.<br />
5. Aircraft observations at 2.8 km<br />
An <strong>NCAR</strong> Queen Air (N304D), relying on Doppler navigation for horizontal<br />
wind assessment beg<strong>an</strong> observation <strong>of</strong> the storm system at 1655. Resolution <strong>of</strong><br />
the wind measurement capability <strong>of</strong> this aircraft <strong>an</strong>d complete calibration<br />
procedures for all aircraft measurements in NHRE are discussed by Foote <strong>an</strong>d<br />
F<strong>an</strong>khauser (1973) <strong>an</strong>d Biter <strong>an</strong>d Wade (i975). Flying at <strong>an</strong> altitude <strong>of</strong> 2.8 km<br />
(731 mb; "1.4 km AGL), the aircraft completed a full circuit around storms W<br />
<strong>an</strong>d E between 1655 <strong>an</strong>d 1721. Fig. 5 shows the track segments most relev<strong>an</strong>t to
II-13<br />
"rl~ l^l'102 ~| .<br />
10<br />
A -- ^--~O, o-<br />
40 *-^-ITOO-.. | ,10 ms-'<br />
|<br />
-<br />
00 1655<br />
20 30 40 50 60<br />
Fig. 5 Acta'ft<br />
fAack <strong>an</strong>d wind vector teative. to wtadac echoeu as in Fig. 3<br />
except at <strong>an</strong> atitude o 2.f km (1.4 km, AGL), teown by the <strong>NCAR</strong> Queen<br />
Ai& (N304V), dwuxig time indicated atong the tack. Poition out4towc boundaity<br />
at ;ths attitude L indica.ted by the da hed batbed tine. Location o 0<br />
tAu. auL<br />
aoWaLt<br />
4peed maxima, courleponding to veAticat vetocity maxima<br />
aLe 4kown<br />
in Figs. 3<br />
ah<br />
<strong>an</strong>d<br />
nowaitd-phontd<br />
4,<br />
ng afutow l along the we utwd ttoaveuAe tU"LouIgh the<br />
cn{low (1715-1721:30). lHo'?zontal hatchng Ln the SE 4ec;to. oa 0 tomn<br />
Legion<br />
W indicate<br />
<strong>of</strong> 4ada!L echo "ove'h<strong>an</strong>g" at aittudeo above ctoud base.<br />
4how<br />
Line<br />
ouLentaion<br />
AB again<br />
od cor a bection in FLg. 8. Bo'Lder &tbeJed<br />
<strong>an</strong>d ouwth<br />
n kitoomete<br />
o5 GtOveA,<br />
ea&st<br />
Coito'ado.<br />
.
II-14<br />
storm W. As in Fig. 3, the actual ground track has been adjusted to positions<br />
relative to the traveling storm <strong>an</strong>d wind vectors again represent relative<br />
horizontal airflow. Thermodynamic parameters calculated from measurements<br />
along the two flight legs (1655-1703; 1715-1721) are plotted in Fig. 6. We<br />
note that the westward pass (1715-1721) through the inflow coincides closely<br />
in time with the westward traverse <strong>of</strong> N326D <strong>an</strong>d that the two aircraft were<br />
essentially vertically stacked when sounding the inflow sector. This has been<br />
a preferred mode for aircraft deployment in the NHRE field investigations<br />
because it facilitates direct comparison <strong>of</strong> data measured at the various<br />
flight levels.<br />
Relative horizontal airflow on the westward traverse is comparable in<br />
direction <strong>an</strong>d magnitude to that found at the two lower levels (Figs. 2 <strong>an</strong>d 3)<br />
<strong>an</strong>d perturbations that appear are in close horizontal alignment with similar<br />
features below. Specific attention is drawn to confluent relative flow in<br />
the vicinity <strong>of</strong> storm E (1717) <strong>an</strong>d to confluence <strong>an</strong>d cyclonic shear at 1720<br />
near the location <strong>of</strong> cell W5 shown in Fig. 2. The track skirts close to<br />
storm E <strong>an</strong>d a momentary drop in 0 at that time (1717 in Fig. 6) indicates<br />
that the aircraft briefly encountered outflow there.<br />
Trends in Fig. 6 (1715-1721) also reflect those found at lower altitudes<br />
with the coolest <strong>an</strong>d most moist air located to the southeast <strong>of</strong> the overall<br />
storm complex <strong>an</strong>d the warmest <strong>an</strong>d driest to the southwest. Thermodynamic<br />
parameters measured on the west fl<strong>an</strong>k <strong>an</strong>d to the rear <strong>of</strong> the storm are also<br />
shown in Fig. 6 (1655-1703). To the rear <strong>of</strong> storm W, e <strong>an</strong>d r best identify<br />
e<br />
the excursion through outflowing air deposited by the downdraft. 'Gradients<br />
in both parameters near 1658 <strong>an</strong>d 1701 bracket distinctly drier air. Reference
,<br />
11-15<br />
s320w s ssw<br />
SE30 ST<br />
3186<br />
3 0 ' ' 1r 19 - 3'4 6<br />
aI - I 6 -<br />
h<strong>an</strong>314 -J JJ - -- Fahdtn I _<br />
I II dnt I ----- m L- cdn |<br />
nddp-314<br />
Ic i/^,^"" 10*^ - : A~ n/ ''10<br />
>- 340. 5. VaH L4 denot<br />
1,_.j<br />
6 w 'I Il I i IJ I 6<br />
6 1 I'<br />
,<br />
030C110D 9 5 7 5 65 112 91 71<br />
60<br />
75MT<br />
Fi.6Temdnmcprmtr ln rgtlg 655103 7512<br />
shw deaie<br />
inFg8.Dse eoeabetcniin n<br />
tlWl (4 hadxed) Ldentdy4 owtw <strong>an</strong>d 'n'o' a'', as n'cat'd. ALc'al<br />
po4atio~in xhown -'Vdc&e to ^toim W Zu 4hcwn at top. Upwaid-po&nting awVoW on<br />
1715-1721<br />
c~~~soni<br />
£n 3ine Fg.. 5.<br />
potenvtia<br />
i.5 dahed<br />
tempvatw'<br />
asedptwithe on ight<br />
p<strong>an</strong>e2 coaJ&pond<br />
cross h<strong>an</strong>d<br />
am p<strong>an</strong>3e 0de'nkt ntet-<br />
to<br />
ientcnions<br />
twUe aCA 4peed max-rna<br />
<strong>an</strong>d Fig.8.<br />
cetpt &th cao 4ecQion n Fig. 8.
II-16<br />
to relative wind vectors in Fig. 5 shows that outflow boundaries are associated<br />
with zones <strong>of</strong> horizontal shear. It is worth noting that the relative aircraft<br />
position near 1656 lies downwind from the 1720 to 1721 portion <strong>of</strong> the track in<br />
Fig. 5, <strong>an</strong>d that the thermodynamic parameters observed in the two locations are<br />
essentially the same. This is evidence that, although storm W was evolving in<br />
a periodic m<strong>an</strong>ner, the near-cloud regime retained a persistent configuration.<br />
Based on the measurements at this altitude the interface between ambient<br />
<strong>an</strong>d outflow air has been drawn on Fig. 5. While a tendency for the outflow dome<br />
<strong>of</strong> storm W to shrink toward the precipitation echo in the vertical is evident in<br />
both the western <strong>an</strong>d southeastern sectors, the outflow boundary appears to be<br />
more steeply inclined near the relative upwind region <strong>of</strong> new cell generation<br />
(W5) indicated in Fig. 2.<br />
Although direct measurements <strong>of</strong> vertical velocity were not obtained from<br />
the aircraft flying at this level it is possible to identify regions <strong>of</strong><br />
ascending <strong>an</strong>d descending air motion in a qualitative m<strong>an</strong>ner. When <strong>an</strong><br />
aircraft is flown at const<strong>an</strong>t static pressure, as the NHRE research aircraft<br />
normally are, variations in true airspeed (TAS) c<strong>an</strong> be used as <strong>an</strong> indicator<br />
<strong>of</strong> vertical air motion. Ascending ambient air is correlated with increasing<br />
<strong>an</strong>d/or high values <strong>of</strong> TAS <strong>an</strong>d strong downward motions are reflected by<br />
rapidly decreasing <strong>an</strong>d/or low TAS.<br />
During the westward pass (Fig. 5, 1715-1721) three distinct TAS maxima<br />
were recorded; one at 1716:45, <strong>an</strong>other at 1718:30; <strong>an</strong>d a third shortly before<br />
1720. Each is identified by the upward pointing arrows on Figs. 5 <strong>an</strong>d 6.<br />
These maxima were well correlated in space with the vertical velocity peaks<br />
measured by N326D at the lower level, <strong>an</strong>d the vertical <strong>an</strong>d horizontal<br />
continuity from the surface through the two flight levels strengthens the<br />
evidence supporting three distinct inflow br<strong>an</strong>ches as proposed in the previous
II-17<br />
section. Indications are that the two eastern maxima tilt slightly.from east<br />
to west in the vertical while the western <strong>an</strong>d strongest updraft in Figs. 3 <strong>an</strong>d 5<br />
appears to have a more vertical alignment.<br />
·6. Cloud 'base measurements<br />
The University <strong>of</strong> Wyoming Queen Air (NlOUW) monitored thermodynamic prop-<br />
erties <strong>an</strong>d updraft structure at cloud base (3.8 km, 2.4 km AGL) in the inflow<br />
to storm W, continuously from 1643 through 1720 <strong>an</strong>d subsequently obtained <strong>an</strong><br />
inflow sounding from cloud base to near the surface between 1720 <strong>an</strong>d 1730.<br />
The total period <strong>of</strong> observation includes the development cycles <strong>of</strong> cells W3<br />
through W5 as discussed in Part I. A description <strong>of</strong> the vertical motion sensing<br />
system aboard this aircraft <strong>an</strong>d its resolution capability is presented by<br />
Marwitz (1972a). In the m<strong>an</strong>ner described in earlier sections the' actual air-<br />
craft ground position was adjusted to compensate for storm movement, <strong>an</strong>d all<br />
track segments were positioned relative to the storm's location at 1710. The<br />
horizontal field <strong>of</strong> ascending motion <strong>an</strong>alyzed following this tr<strong>an</strong>sformation is<br />
shown by isotachs <strong>of</strong> vertical velocity in Fig. 7. The updraft configuration at<br />
cloud base is based on vertical velocity measured during six traverses through<br />
the updraft zone flown on varying headings <strong>an</strong>d at different positions relative<br />
to the leading edge <strong>of</strong> storm W.<br />
Comparison with the relative flow in Figs. 2, .3, <strong>an</strong>d 5 indicates that the<br />
updraft core at cloud base is located directly downwind with respect to the<br />
org<strong>an</strong>ized southeasterly relative inflow at lower levels, some 1 to 3 km ahead<br />
<strong>of</strong> the large PPI radar echo gradient at cloud base, <strong>an</strong>d beneath the radar echo<br />
overh<strong>an</strong>g shown in Fig. 5.. Average east-west updraft extent is about 8 km,<br />
approximately the safe width as the echo at 1710, <strong>an</strong>d similar to the esti-<br />
mated updraft width at lower altitudes (Section 4). A pr<strong>of</strong>ile <strong>of</strong> the
10- A<br />
230<br />
2 0<br />
40<br />
11-18<br />
30 40 50 60<br />
Fig. 7 Veuticace veocty Zo-tach& (Uoeid contouas; m .- 1 ) at ctoud baue<br />
(3.S kIm; 2.6 km, AGL) °eetQve to PPI echo at 1710 a Zn Fig. 2,<br />
3, <strong>an</strong>d 5. Anatuysi bazed on updcait meawuArements by Univeuity od Wyoming,<br />
Queen AiL dty-ng at ceoud base in the. updraut region supporting stoaun W<br />
between 1643 <strong>an</strong>d 1720. Dotted tines show etattt iZmtz <strong>of</strong> fight paths<br />
<strong>an</strong>d denote region whee. data weAe avaiUable. Crosz-hatched region outlined<br />
by daohed contour denote, zone where. eI > 345 K. Poaition <strong>of</strong>A 4sLace outflow<br />
boundary from Fig. 2 (ba/Lbed ine. Ls hown doL LefdeLrnce. Line AB<br />
show6 oiCentation <strong>of</strong> CrOs aection in Fig. 8. BoundariUe corrLespond to<br />
Fig4. 3 <strong>an</strong>d 5.
II-19<br />
vertical velocity taken along a segment passing through the maximum <strong>an</strong>d<br />
normal to the lower level horizontal flow would reveal a bell-shaped pr<strong>of</strong>ile<br />
<strong>of</strong> updraft intensity similar to that found by Kyle, et al (19<strong>76</strong>) from<br />
penetrations <strong>of</strong> updraft zones at higher altitudes within a number <strong>of</strong><br />
Colorado thunderstorms.<br />
The position <strong>an</strong>d shape <strong>of</strong> the zero isotach in Fig. 7 is known with<br />
some confidence so that there appears to be a clear distinction between<br />
the main updraft supporting the mature cell in storm W <strong>an</strong>d the other two<br />
updraft zones detected by the lower flying aircraft. The track <strong>of</strong> N1OUW<br />
did not take it into positions favorable for observing the other ascending<br />
br<strong>an</strong>ches (see dotted lines in Fig. 11) <strong>an</strong>d in fact the updraft region as<br />
depicted was, in general, surrounded by weakly subsident motions in its<br />
immediate periphery. These are also evident in the vertical velocity data<br />
appearing in Fig. 4.<br />
As discussed in Part I, Section 2a, the pseudo-adiabat defined by 0 e =<br />
345.5 K was representative <strong>of</strong> the updraft region at cloud base. Corresponding<br />
static pressure, 6, <strong>an</strong>d r were 650 mb, 316.5 K <strong>an</strong>d 9.5 g kg 1 , respectively.<br />
The cross-hatched region in Fig. 7 shows the region where ,e' computed from<br />
data measured during the updraft traverses, equalled or exceeded 345 K.<br />
Orientation <strong>of</strong> this moist b<strong>an</strong>d is along the direction <strong>of</strong> the relative inflow<br />
at lower levels <strong>an</strong>d comparison with thermodynamic data in Figs. 2, 4 <strong>an</strong>d 6<br />
indicates that the updraft air ascends from near the surface to cloud base<br />
in <strong>an</strong> essentially unmixed m<strong>an</strong>ner. This was confirmed by the descent sounding<br />
made by N10LU at the relative position shown in Fig. 2, <strong>an</strong>d supports earlier<br />
evidence (Marwitz, 1972a) regarding the origins <strong>of</strong> air feeding High Plains<br />
thunderstorms.
7. The composite inflow structure<br />
II-20<br />
Data in preceding sections provide a basis for constructing a<br />
vertical cross-section through storm W representative <strong>of</strong> me<strong>an</strong> inflow<br />
conditions (Fig. 8). For orientation we chose <strong>an</strong> axis that is parallel to<br />
the direction <strong>of</strong> relative inflow. Its location in the horizontal pl<strong>an</strong>e<br />
is designated by the dashed line segment (AB) appearing on Figs. 2, 3, 5 <strong>an</strong>d 7.<br />
For reference, a schematic radar cross-section similar to those<br />
<strong>an</strong>alyzed in greater detail in Part I has been extracted from the three-<br />
dimensional reflectivity sc<strong>an</strong>s centered around 1710. Schematic cloud<br />
features are also superimposed from photogrametric <strong>an</strong>alysis <strong>of</strong> Fig. 1.<br />
The reflectivity maximum, > 50 dBZ, found al<strong>of</strong>t between 8 <strong>an</strong>d 10 km represents<br />
cell W(n), (n, denoting the numerical order <strong>of</strong> cell formation) near the mature<br />
stage <strong>of</strong> its life cycle. Streamline <strong>an</strong>alysis describes the structure <strong>of</strong><br />
the inflow feeding this cell. To the rear <strong>of</strong> the storm the radar cross-<br />
section intersects the edges <strong>of</strong> the decaying cell, W(n - 1), which is<br />
centered at a location somewhat into the pl<strong>an</strong>e. Weak echo from the newly<br />
forming cell, W(n + 1) also appears ahead (to the right) <strong>of</strong> W(n) <strong>an</strong>d its<br />
central core is located slightly out <strong>of</strong> the pl<strong>an</strong>e toward the reader. Other<br />
signific<strong>an</strong>t radar features include the weak echo region beneath <strong>an</strong>d ahead <strong>of</strong><br />
cell W(n), <strong>an</strong>d the high reflectivity core (> 55 dBZ) in the heart <strong>of</strong> the storm<br />
extending from %6 km to near the surface. These internal features identify<br />
zones <strong>of</strong> org<strong>an</strong>ized ascending <strong>an</strong>d descending motions (marked by heavy arrows)<br />
<strong>an</strong>d were observed in considerable detail by a vertically sc<strong>an</strong>ning Doppler<br />
radar (Part III) <strong>an</strong>d a penetrating aircraft (Part IV) at times slightly later<br />
in the storm's history.<br />
Horizontal wind vectors at the surface represent the component <strong>of</strong><br />
relative flow parallel to the vertical section <strong>an</strong>d normal to the outflow
(rnmb) '<br />
150-<br />
jO00t.<br />
600 T(C)<br />
~~~~~~~200<br />
-10 " 25<br />
600- rToC) \ 50 [\ \<br />
- /Wln/ I<br />
-50<br />
11-21<br />
MING\\^<br />
OF PL NE<br />
OUT<br />
^ ^ S ^^^^^-' M OT ION<br />
s<br />
T\<br />
1 -Ikm-~<br />
'H -<br />
B00<br />
800<br />
\5<br />
H<br />
33.0<br />
---<br />
_<br />
-,,.,. 3o~,<br />
- - - -<br />
------<br />
44.832.7 342.3<br />
- -<br />
341.9<br />
4. - 4<br />
SFCC t----~----·<br />
900 342 338 334 330<br />
3 3 3 4 3 3<br />
340 6 24 328<br />
km-20 -18 -16 -14 -12<br />
326 330 334 338 342'5<br />
3 2<br />
345 3 3<br />
8 2 336 340 344<br />
-10 -8 -6 -4 -2 0 2<br />
345.<br />
346<br />
3 4<br />
4<br />
346<br />
34<br />
6<br />
.<br />
8<br />
46<br />
10<br />
344~Q<br />
.5 km<br />
m '<br />
12 km 14<br />
Fig. 8 Composite vect ,totm t CILo4o , ection -thaough<br />
ne A3 in<br />
Wa<br />
Fegs.<br />
o'ented<br />
2,<br />
atong<br />
3, 5, <strong>an</strong>d 7. V cloud isuat<br />
n·- 4c<strong>an</strong>t<br />
boundaiLe<br />
eatutwe.<br />
<strong>an</strong>d<br />
d1om<br />
^<br />
Fig.<br />
eg-<br />
1 ae zupe imposed<br />
(iteguatr<br />
on rada<br />
otid<br />
tedfcteiv<br />
contour<br />
ty<br />
)<br />
contorws<br />
detLved dfom PPI<br />
Equivae<strong>an</strong>t<br />
catns centered<br />
potentia/<br />
atound<br />
tempenurtwue<br />
1710.<br />
pl<strong>an</strong>e<br />
<strong>an</strong>d<br />
at<br />
tettive<br />
. the w..ace<br />
wind<br />
<strong>an</strong>dat<br />
vebCto<br />
4Zight<br />
parattel<br />
atetitudes<br />
to the<br />
ounded<br />
alt<br />
by<br />
apptop/iaSe<br />
aic 4t ate<br />
tettive<br />
plotted<br />
positions. Sotid<br />
Pet<br />
hotizonta2<br />
<strong>an</strong>d tight<br />
Vectotu<br />
ae -taken<br />
on<br />
'tom<br />
the<br />
reprte,entative<br />
extteme.<br />
Part<br />
up- <strong>an</strong>d<br />
I, Fig.<br />
downwind<br />
3).<br />
s<br />
Da.hed<br />
oundings<br />
vectots<br />
(see<br />
on sthe reounding<br />
'tepzeent to the.<br />
t.eative<br />
ea& o<br />
components<br />
mthe stoam<br />
into (upw<br />
ne.nctned)<br />
incad)<br />
the<br />
<strong>an</strong>d<br />
ve.tica.<br />
out o<br />
pe<strong>an</strong>e.<br />
downwad<br />
Heavy aLow4<br />
ing<br />
indicate<br />
<strong>an</strong>d descend'ng<br />
primaty<br />
mo°tions.<br />
tegions <strong>of</strong><br />
Indexed<br />
ascend-<br />
o. -the W -4eteies.<br />
tada<br />
in<br />
rtedfectivity<br />
vayt.ng 4tage4<br />
deatures<br />
od deve.opment.<br />
identify<br />
The<br />
cetts<br />
bas<br />
tine pattern<br />
dot fi the stteam-<br />
tepresentivng &nftow to matuwe cel,. W(n), ds<br />
Inslt<br />
presented<br />
adapted<br />
in<br />
dtom<br />
the text.<br />
fHumphkrey4 (1914),<br />
(inelow,<br />
4howing:<br />
updra4t);<br />
[A]<br />
[D]<br />
acscending<br />
descending<br />
aai<br />
air (downdraft,<br />
(4held ctoud); [S] rtoUlscud (aTcus<br />
outdlow);<br />
or toQQ (gust ceoud);<br />
[C]<br />
[D']<br />
4stoAmun<br />
wind gust<br />
ca<br />
hiont); [U1] haiR; [T] ;thitzn'iha (cnotheahc<br />
(cuwmonJwimbuw .twut<br />
p v Ot<br />
t.in7tain<br />
toweu); [R]<br />
4hat). TeNlms<br />
t<br />
in LtaLc<br />
t enify<br />
s<br />
f<br />
ate<br />
eautres<br />
thoze<br />
which<br />
wed by t..wnph.ey<br />
ate cuwttenty described by tetm4 in paienth.e4sC.<br />
10:
II-22<br />
boundary. The surface location <strong>of</strong> the inflow-outflow interface is based on<br />
<strong>an</strong>alysis presented in Fig. 2, <strong>an</strong>d winds are derived from the average<br />
conditions observed at the four mesonetwork sites directly affected by the<br />
overhead passage <strong>of</strong> storm W. Two null points occur in the relative flow<br />
beneath the storm; one at the inflow-outflow interface <strong>an</strong>d <strong>an</strong>other directly<br />
beneath the low-level radar reflectivity maximum. Speed in the relative<br />
inflow toward the storm at the surface is fairly uniform <strong>an</strong>d averages near<br />
8 m s. Approximately 2 km ahead <strong>of</strong> the outflow boundary the inflow,<br />
moving from right to left, decreases abruptly with the normal component<br />
falling to zero at the interface. It is here that the horizontal mass<br />
convergence reaches a maximum, exceeding 10 - 3 s , as indicated in Fig. 2.<br />
Moving left to right from the location <strong>of</strong> maximum downdraft toward the<br />
outflow boundary, velocity increases from zero to a maximum <strong>of</strong> 4.5 m s-<br />
near the forward edge <strong>of</strong> the precipitation wall, identified by the large<br />
horizontal radar reflectivity gradient. From this point to the outflow<br />
boundary minor speed fluctuations are evident, indicating rather turbulent<br />
conditions. The outflow component decreases rapidly to zero as it nears the<br />
outflow boundary, again contributing to the maximum convergence found there.<br />
To the rear (left) <strong>of</strong> the downdraft maximum, relative outflow increases<br />
steadily from zero to values exceeding those <strong>of</strong> the inflow. This suggests<br />
that momentum has been added to the boundary layer by downward tr<strong>an</strong>sport<br />
from al<strong>of</strong>t. Horizontal divergence beneath the maximum downdraft, calculated<br />
-1<br />
from mesonetwork <strong>an</strong>alysis (Fig. 2), exceeded 4 x 10 - 3 s .<br />
Thermodynamic tr<strong>an</strong>sitions along the surface are represented by plotted<br />
values <strong>of</strong> Oe, again derived from average conditions observed at the four<br />
directly affected mesonet sites. As indicated in Fig. 2, the 8e field is<br />
nearly uniform over the area lying 15 to 20 km ahead <strong>of</strong> the storm. This is
II-23<br />
reflected by the flat gradient in the upwind inflow sector in Fig. 8, which<br />
shows surface values r<strong>an</strong>ging between 345 <strong>an</strong>d 346 K. Behind the outflow<br />
boundary values drop to a minimum <strong>of</strong> 326 K appearing slightly to the rear<br />
<strong>of</strong> the maximum downdraft. Gradual recovery toward environmental conditions'<br />
is shown to the rear <strong>of</strong> the storm. Largest e gradients are found at the<br />
e<br />
surface near the edges <strong>of</strong> the radar echo where a value <strong>of</strong> 336 K is seen to<br />
coincide with both the leading <strong>an</strong>d trailing boundaries <strong>of</strong> the precipitation<br />
shaft.<br />
Point measurements at two flight levels (2.2 <strong>an</strong>d 2.8 km) are available in<br />
the inflow from the traverses made by N326D <strong>an</strong>d N304D. The parallel relative<br />
wind components at the points where the tracks in Figs. 3 <strong>an</strong>d 5 intercept<br />
the vertical section are plotted at their respective positions in Fig. 8.<br />
-1<br />
Relative horizontal velocity at both levels is 12.5 m s . Vertical<br />
velocity is known at the lower altitude only (see Fig. 4) <strong>an</strong>d.vector addition<br />
gives the indicated slope <strong>of</strong> the inflow at this location (dashed vector). A<br />
single estimate <strong>of</strong> downdraft slope behind the outflow boundary is based on<br />
the vertical <strong>an</strong>d horizontal winds measured by N326D during outflow penetrations<br />
discussed in Section 3.<br />
Equivalent potential temperature at both flight levels is 345.5 K at<br />
the point where the respective tracks intercept the pl<strong>an</strong>e <strong>of</strong> Fig. 12 (see<br />
Figs. 4 <strong>an</strong>d 6). This value is in close agreement with surface conditions<br />
ahead <strong>of</strong> the storm (Fig. 2), Slight differences between surface <strong>an</strong>d aircraft<br />
levels are indicated, however, in mixing ratio which shows a small increase<br />
with height <strong>an</strong>d in 0 which shows about a 1 K decrease. This potential<br />
temperature decrease with height is indicative <strong>of</strong> a superadiabatic lapse<br />
rate in the lowest few decameters above the surface.
11-24<br />
To the rear <strong>of</strong> the storm at the altitude sounded by N304D no<br />
appreciable component <strong>of</strong> relative motion was found in the pl<strong>an</strong>e <strong>of</strong> Fig. 8,<br />
indicating that the air there had essentially the same momentum as the<br />
main body <strong>of</strong> the storm. The lowest 0 measured there was 338 K (Fig. 6).<br />
e<br />
This is in agreement with the surface value directly beneath the aircraft,<br />
<strong>an</strong>d close to that shown at this altitude in Part I, Fig. 3 (inset). This<br />
indicates that the subcloud layer immediately to the rear <strong>of</strong> the storm was<br />
quite well mixed, undoubtedly owing to the more turbulent flow<br />
characteristics frequently encountered by aircraft flying there (Foote<br />
<strong>an</strong>d F<strong>an</strong>khauser, 1973). We note also that 0 e measured by N326D in the<br />
forward outflow is close to the underlying surface value.<br />
Horizontal resolution at cloud base altitude is provided by the<br />
measurements <strong>of</strong> Queern Air N10UW. Vertical velocity vectors based on the<br />
isotach field in Fig. 7 have been extracted at selected intervals along<br />
line AB <strong>an</strong>d are plotted in their corresponding positions in Fig. 8.<br />
Strongest vertical motion (> 6 m s ) is found 1 to 2 km ahead <strong>of</strong> the<br />
subcloud precipitation curtain <strong>an</strong>d generally beneath the radar echo<br />
'overh<strong>an</strong>g.' If the horizontal momentum observed at lower levels is<br />
conserved in ascent to cloud base, addition to the vertical velocity<br />
vector, again, gives <strong>an</strong> estimate <strong>of</strong> updraft slope as indicated by the<br />
dashed vectors.<br />
Thermodynamic variations at cloud base are shown by the plotted<br />
values <strong>of</strong> 9e based on parameters measured' during the flight <strong>of</strong> N1OUW from<br />
the region <strong>of</strong> maximum updraft to the position <strong>of</strong> the descent sounding<br />
designated in Fig. 2. We note that in the regions <strong>of</strong> strongest ascending<br />
motion 0 e exceeds 345 K. As the aircraft approaches the edges <strong>of</strong> the<br />
shelf cloud ahead <strong>of</strong> the echo overh<strong>an</strong>g, 0 e is slightly lower <strong>an</strong>d less
II-25<br />
uniform. Immediately beyond visible cloud boundaries e diminishes further<br />
e<br />
to values less th<strong>an</strong> 342 K but recovers somewhat farther from the cloud. The<br />
increasing trend in e during the descent sounding appearing on the right <strong>of</strong><br />
e<br />
Fig. 8 is.in qualitative agreement with that shown for the STK sounding in<br />
Part I, Fig. 3 (inset), but it is not so steep. We note that values > 345 K<br />
are confined to the lowest layer above ground .at this dist<strong>an</strong>ce from the storm.<br />
The shape <strong>of</strong> the streamlines representing the me<strong>an</strong> inst<strong>an</strong>t<strong>an</strong>eous inflow<br />
<strong>an</strong>d updraft conditions for storm W is based on the few estimates <strong>of</strong> updraft<br />
slope <strong>an</strong>d on the conservative properties <strong>of</strong> e0 in moist air processes. The<br />
e<br />
shallow layer <strong>of</strong> air having high Qe observed in the relative upwind direction<br />
far from the storm suggests that the inflow streamlines originate from quite<br />
near the surface. The inflow layer is shown to exp<strong>an</strong>d to a depth <strong>of</strong> at least<br />
2 km near the edge <strong>of</strong> the shelf cloud while the relative horizontal inflow<br />
velocity increases from 8 m s near the surface to 12.5 m s in the middle<br />
<strong>of</strong> the subcloud layer. Streamline diffluence in the vertical pl<strong>an</strong>e <strong>an</strong>d <strong>an</strong><br />
increase with height in the horizontal inflow component requires that horizontal<br />
convergence also increase with height to satisfy mass continuity. A vertical<br />
mass flux convergence pr<strong>of</strong>ile from measurements in the inflowing sector <strong>of</strong><br />
storm W (F<strong>an</strong>khauser, 1974) shows that such was the case.<br />
While data presented at the surface <strong>an</strong>d at cloud base in Fig. 8 are repre-<br />
sentative <strong>of</strong> average conditions measured there over a period <strong>of</strong> 30 to 35 min,<br />
the individual data points in the inflowing sector represent essentially inst<strong>an</strong>t-<br />
<strong>an</strong>eous conditions observed by the aircraft at different times. The inflow data<br />
below cloud base was obtained, for example, some 10 min earlier th<strong>an</strong> that from<br />
the descent sounding far from the cloud. In view <strong>of</strong> this <strong>an</strong>d the periodic<br />
behavior in radar echo' development patterns demonstrated in Part I one would<br />
<strong>an</strong>ticipate some fluctuation about the me<strong>an</strong> inflow structure as drawn.
II-26<br />
Below cloud base, the inflow ascended at <strong>an</strong> average <strong>an</strong>gle <strong>of</strong> about 20°<br />
from the horizontal above a cold outflow which extended 5 to 6 km ahead <strong>of</strong> the<br />
surface precipitation. As indicated by the N326D inflow vector at 2.2 km,<br />
inflow streamlines begin a distinct upward turn in the vicinity <strong>of</strong> the surface<br />
convergence maximum ahead <strong>of</strong> the surface outflow boundary. They then follow<br />
the slope <strong>of</strong> the outflow boundary which has been drawn to extend from a point<br />
at cloud base located a few hundred meters ahead <strong>of</strong> the precipitation shaft<br />
to the known surface location. The slope <strong>of</strong> streamlines near cloud base is<br />
drawn to agree with inflow vectors based on the NlOUW updraft measurements <strong>an</strong>d<br />
conserved horizontal momentum brought from lower levels. Shape <strong>of</strong> streamlines<br />
above cloud base is <strong>of</strong> course largely speculative but is governed primarily by<br />
radar configurations surrounding the weak echo region. A steep inclination near<br />
the rear edge <strong>of</strong> the weak echo region is confirmed, however, by the observations<br />
reported in Part III.<br />
8. Summary <strong>an</strong>d conclusions<br />
Some <strong>of</strong> the features <strong>of</strong> subcloud airflow resolved in this <strong>an</strong>alysis are<br />
not at all unique; m<strong>an</strong>y having been previously constructed in amazing<br />
detail as early as the turn <strong>of</strong> this century by the atmospheric physicist,<br />
W. J. Humphreys (1914), whose <strong>an</strong>alysis, based almost solely on careful<br />
visual observations, is presented in the inset on Fig. 8. We do, however,<br />
present a broad <strong>an</strong>d comprehensive data base which supports m<strong>an</strong>y <strong>of</strong> his early<br />
speculations <strong>an</strong>d elaborates the definition <strong>of</strong> the subcloud structure <strong>of</strong><br />
the multicell thunderstorm.<br />
Prominent features resolved in the present case are worth reiterating<br />
in summary. Surface <strong>an</strong>d aircraft data show that inflow air approaches the<br />
front <strong>of</strong> the storm, originating from a very shallow layer (< 500-m) near the<br />
ground <strong>an</strong>d at a considerable dist<strong>an</strong>ce (> 20 km) upstream in the relative wind
II-27<br />
direction. Inflow rises unmixed to at least cloud base, feeding the main<br />
updraft region which is inclined upward in a direction opposite to the storm<br />
movement.<br />
Discrete well-defined inflow-updraft br<strong>an</strong>ches were detected which<br />
simult<strong>an</strong>eously supported different cells in varying stages <strong>of</strong> development,<br />
comprising the storm's overall evolving multicellular structure. These<br />
inflow zones had lateral dimensions <strong>of</strong> 6-8 km <strong>an</strong>d were separated by distinct<br />
regions <strong>of</strong> weak subsidence. Despite the storm's evolving character, updrafts<br />
to individual cells were quite long-lived. Analysis in Part I shows that for<br />
individual cells the time interval between first detection <strong>an</strong>d maximum radar<br />
reflectivity was approximately 20 min. If the decay period is included in the<br />
life cycle, radar cell life times exceed 30 min.<br />
Relative winds al<strong>of</strong>t <strong>an</strong>d conservative properties <strong>of</strong> 8 in moist air<br />
e<br />
processes indicate that some <strong>of</strong> the air feeding downdraft circulations<br />
originated in the mid-troposphere <strong>an</strong>d approached the storm from the right<br />
fl<strong>an</strong>k (see winds between 5 <strong>an</strong>d 7 km on the left in Fig. 8). At least a<br />
portion <strong>of</strong> this air descended unmixed, reaching the ground in the strongest<br />
downdrafts near the low level reflectivity maximum.<br />
Maximum surface convergence at the inflow-outflow interface was<br />
-3 -1<br />
1 to 2 x 10 s <strong>an</strong>d divergence calculated beneath the strongest down-<br />
draft was 4 x 10 3 s- 1 .<br />
In addition to high 8 observed in inflow to updrafts supporting indie<br />
vidual cells, aircraft measurements show that the overall mesoscale regime,<br />
both upwind <strong>an</strong>d downwind from the storm, was characterized by e , which at<br />
<strong>an</strong>y subcloud level above the surface was higher th<strong>an</strong> that in the environment<br />
a few kilometers away the ifrom storm (compare, e. g., descent sounding in<br />
Fig. 8 <strong>an</strong>d 8e pr<strong>of</strong>ile in inset to Part' I, Fig. 3).. : Indications are, therefore,<br />
that the entire near-cloud air mass had undergone general uplifting.
II-28<br />
A mech<strong>an</strong>ism favoring general ascent exists in the surface confluence<br />
zone as shown in Part I, Fig. 2, where mesoscale convergence values would<br />
-4 -1<br />
typically be on the order <strong>of</strong> 10 s (Fujita, 1963). Storm developments<br />
during the day were in close proximity to this surface flow feature as it<br />
-4 -l<br />
progressed southward through the network. A convergence value <strong>of</strong> 10 s<br />
averaged through the subcloud layer leads, by continuity, to a me<strong>an</strong> vertical<br />
motion <strong>of</strong> 4.15 cm s . Ascent <strong>of</strong> %2 km required to satisfy observed<br />
conditions, could therefore take place in a period <strong>of</strong> 3 to 4 hours as a<br />
result <strong>of</strong> mesoscale forcing.<br />
A potentially unstable boundary layer environment, requiring only a<br />
small degree <strong>of</strong> lift to become convectively unstable, is consistent with<br />
the large number <strong>of</strong> radar echoes which formed on this day. Only a small<br />
percent, forming in regions <strong>of</strong> strongest surface convergence such as the<br />
mesoscale confluence line (Part I, Fig. 2) <strong>an</strong>d the outflow boundaries <strong>of</strong><br />
existing storms (Fig. 2),were favored to become major thunderstorms. Low<br />
level thermodynamic structure near <strong>an</strong>d beneath supercell phenomena appears<br />
to differ from that found here in that near-cloud vertical motions in the<br />
supercell case seem to be suppressed everywhere except in the main<br />
inflow-updraft zone (Browning <strong>an</strong>d Foote, 19<strong>76</strong>).<br />
Some aspects <strong>of</strong> the. observed radar structure, such as the weak echo<br />
region <strong>an</strong>d associated forward overh<strong>an</strong>g, relate to commonly observed features<br />
<strong>of</strong> supercell storms. (Browning, 1964; Marwitz, 1972a; <strong>an</strong>d Chisholm, 1973),<br />
but we know from the evolutionary character <strong>of</strong> the storm that these are<br />
quite tr<strong>an</strong>sitory in the present case. While signific<strong>an</strong>t degrees <strong>of</strong><br />
cyclonic shear <strong>an</strong>d associated vorticity are frequently observed in the<br />
inflow to large <strong>an</strong>d persistent thunderstorms (see, e. g., McCarthy, et al,<br />
1974), the inflow to the storm studied here displayed only nominal shear in the<br />
horizontal pl<strong>an</strong>e <strong>an</strong>d each subcloud br<strong>an</strong>ch appeared to be essentially two-
II-29<br />
dimensional in the vertical pl<strong>an</strong>e, as well. These may well be import<strong>an</strong>t<br />
aspects distinguishing circulations in multicellular storms from those <strong>of</strong><br />
the supercell thunderstorm. In summary, the observed storm characteristics<br />
were closer in nature to the multicell model proposed in The Thunderstorm,<br />
where spreading downdrafts from mature <strong>an</strong>d decaying cells appear to provide<br />
the triggering mech<strong>an</strong>ism for discrete new cell formation.<br />
Acknowledgements<br />
Special recognition is due the operational <strong>an</strong>d research support staff<br />
<strong>of</strong> the <strong>NCAR</strong> Research Aviation Facility whose unstinted cooperation led to<br />
the collection <strong>of</strong> the data on which much <strong>of</strong> the <strong>an</strong>alysis rests. Appreciation<br />
is also expressed to the University <strong>of</strong> Wyoming Atmospheric Sciences group for<br />
obtaining <strong>an</strong>d making available the definitive cloud base aircraft data<br />
reported in Section 6. Credit is due G. Br<strong>an</strong>t Foote who co-directs the<br />
NHRE aircraft research program <strong>an</strong>d who provided the photograph in Fig. 1.<br />
S. Fuller performed the data reduction. C. Castillo <strong>an</strong>d R. Colem<strong>an</strong><br />
drafted the figures <strong>an</strong>d J. Krzyzosiak typed the m<strong>an</strong>uscript.
II-30<br />
REFERENCES<br />
Biter, C. J. <strong>an</strong>d C. G. Wade, 1975: Field calibration <strong>an</strong>d intercomparison <strong>of</strong><br />
aircraft meteorological measurements. Preprints, NHRE Symposium/Workshop<br />
on Hail <strong>an</strong>d Its Suppression, Estes Park, Colo. (unpublished m<strong>an</strong>uscript).<br />
Browning, K. A., 1964: Airflow <strong>an</strong>d precipitation trajectories within severe<br />
local storms which travel to the right <strong>of</strong> the winds. J. Atmos. Sci., 21,<br />
634-639.<br />
_ , <strong>an</strong>d G. B. Foote, 19<strong>76</strong>: Airflow <strong>an</strong>d hailgrowth in supercell storms <strong>an</strong>d<br />
some implications for hail suppression. Submitted to Quart. J. Roy. Meteor.<br />
Soc.<br />
Byers, H. R.. <strong>an</strong>d R. R. Braham, 1949: The Thunderstorm. U. S. Government<br />
Printing Office, Washington, D. C., 60-66.<br />
Charba, J., 1974: Application <strong>of</strong> gravity current model to <strong>an</strong>alysis <strong>of</strong><br />
squall-line gust front. Mon. Wea. Rev., 102, 140-156.<br />
Chisholm, A. J., 1973: Alberta hailstorms, Part I: Radar case studies <strong>an</strong>d<br />
airflow models. Meteor. Monogr., 14 (36), 1-36.<br />
F<strong>an</strong>khauser, J. C., 1974: Subcloud air mass <strong>an</strong>d moisture flux attending a<br />
northeast Colorado thunderstorm complex. Preprints, Conference on Cloud<br />
Physics, Oct. 1974, Amer. Meteor. Soc. Boston, 271-2<strong>76</strong>.<br />
Foote, G. B. <strong>an</strong>d J. C. F<strong>an</strong>khauser, 1973: Airflow <strong>an</strong>d moisture budget beneath<br />
a Northeast Colorado hailstorm. J. Appl. Meteor., 12, 1330-1353.<br />
Fujita, T., 1963: Analytical mesometeorology: A review. Meteor. Monogr.,<br />
5 (27), 77-125.<br />
Humphreys, W. J., 1914: The thunderstorm <strong>an</strong>d its phenomena. Mon. Wea. Rev.,<br />
42, 348-380.<br />
Kyle, T. G., W. R. S<strong>an</strong>d <strong>an</strong>d D. J. Musil, 19<strong>76</strong>: Fitting measurements <strong>of</strong> thunder-<br />
storm updraft pr<strong>of</strong>iles to model pr<strong>of</strong>iles. Submitted to Mon. Wea. Rev,
11-31<br />
McCarthy, J., G. M. Heymsfield <strong>an</strong>d S. P. Nelson, 1974: Experiment to deduce<br />
tornado cyclone inflow characteristics using chaff <strong>an</strong>d NSSL dual Doppler<br />
radars. Bull. Amer. Meteor. Soc., 55, 1130-1131.<br />
Newton, C. W., 1963: Dynamics <strong>of</strong> severe convective storms. Meteor. Monogr.,<br />
5 (27), 33-58.<br />
Telford, J. W. <strong>an</strong>d P. B. Wagner, 1974: The measurement <strong>of</strong> horizontal air<br />
motion near clouds from aircraft. J. Atmos. Sci., 31, 2066-2080.
<strong>Structure</strong> <strong>of</strong> <strong>an</strong> <strong>Evolving</strong> <strong>Hailstorm</strong>. Part III:<br />
Internal <strong>Structure</strong> from Doppler Radar<br />
by<br />
R. G. Strauch <strong>an</strong>d F. H. Merrem<br />
NOAA/ERL/Wave Propagation Laboratory 1<br />
Boulder, Colorado<br />
1 This research was performed as part <strong>of</strong> the National Hail Research Experiment,<br />
m<strong>an</strong>aged by the National Center for Atmospheric Research <strong>an</strong>d sponsored by the<br />
Weather Modification Program, Research Applications Directorate, National<br />
Science Foundation.
ABSTRACT<br />
Two X-b<strong>an</strong>d Doppler radars observed a hailstorm that passed directly over<br />
one <strong>of</strong> the radars during the 1973 National Hail Research Experiment (NHRE).<br />
While one <strong>of</strong> the radars sc<strong>an</strong>ned the radar echo at low elevation <strong>an</strong>gles the<br />
other radar, which operated simult<strong>an</strong>eously in a zenith-pointing mode, measured<br />
part <strong>of</strong> the main updraft. Observations by other NHRE particip<strong>an</strong>ts assisted in<br />
interpreting the radial velocity fields so that inflow <strong>an</strong>d outflow could be<br />
identified from the sc<strong>an</strong>ning radar measurements. The peak updrafts occurred<br />
just ahead <strong>of</strong> the highest reflectivity while the strongest downdrafts were<br />
found only 2 km behind the updraft. Strong turbulence was generated in the<br />
tr<strong>an</strong>sition region between updraft <strong>an</strong>d downdraft as evidenced by large velocity<br />
vari<strong>an</strong>ces. A subst<strong>an</strong>tial part <strong>of</strong> the downdraft appeared to have been fed by<br />
air that had ascended in the updraft. Low-level velocity fields were in<br />
general agreement with surface measurements <strong>an</strong>d showed the outflow toward the<br />
front <strong>of</strong> the storm in the gust front as well as outflow opposite the echo<br />
motion behind the storm. There was strong outflow opposite the direction <strong>of</strong><br />
echo motion at the top <strong>of</strong> the storm which agreed with photographs <strong>of</strong> the <strong>an</strong>vil<br />
overh<strong>an</strong>g.
1. Introduction<br />
III-1<br />
The observations discussed in this paper were made with two X-b<strong>an</strong>d<br />
Doppler radars on a storm that passed directly over one <strong>of</strong> the radars near<br />
Raymer during the 1973 field program <strong>of</strong> the National Hail Research Experiment<br />
(NHRE) in northeast Colorado. The two radars normally were operated as a<br />
dual-Doppler system to acquire data for <strong>an</strong>alysis <strong>of</strong> three-dimensional wind<br />
fields. However, when a storm passed directly over one radar, it was operated<br />
in a zenith-pointing mode while the second radar sc<strong>an</strong>ned <strong>an</strong> azimuth sector<br />
encompassing the zenith-pointing radar with a raster sc<strong>an</strong> stepped in elevation.<br />
Browning, et al (1968) conducted a similar experiment to observe the horizontal<br />
<strong>an</strong>d vertical air motion in a shower, except their second radar sc<strong>an</strong>ned in<br />
elevation at a single fixed azimuth. The operational mode we selected enabled<br />
us to determine the two-dimensional velocity in a vertical pl<strong>an</strong>e through the<br />
radars, <strong>an</strong>d it also allowed us to observe the reflectivity <strong>an</strong>d one component<br />
<strong>of</strong> air motion throughout the storm volume. Several storms were observed in<br />
this operating mode, but the Raymer storm <strong>of</strong> 9 July 1973 discussed here com-<br />
bines two fortuitous factors in addition to the extensive measurements obtained<br />
with other instruments:<br />
a. The storm track was within 5 deg <strong>of</strong> the line joining the radars. Thus,<br />
inflow <strong>an</strong>d outflow parallel to the direction <strong>of</strong> storm motion were observed as<br />
radial velocity. These regions were clearly seen by the sc<strong>an</strong>ning radar <strong>an</strong>d<br />
assisted in interpreting the measured radial velocity field in terms <strong>of</strong> the<br />
storm structure.<br />
b. The updraft region passed directly over the zenith-pointing radar.<br />
The vertical velocity data could therefore be used to locate the updraft pre-<br />
cisely in relation to the storm echo.
2. The Doppler radar observations<br />
III-2<br />
The location <strong>of</strong> Doppler radars A <strong>an</strong>d B relative to the NHRE operational<br />
area is shown in Fig. 1. The radars were separated by 52.2 km with a baseline<br />
<strong>an</strong>gle <strong>of</strong> 354 deg from north. The 9 July 1973 hailstorm passed directly over<br />
the southern radar (Radar A). Figure 1 also shows the reflectivity contours,<br />
just below cloud base, measured by the 10-cm radar located at Grover, Colorado<br />
at the time the storm was over Radar A. Radar A acquired data in a zenith-<br />
pointed mode from 1725:55 to 1736:15 MDT. During this same time, Radar B was<br />
sc<strong>an</strong>ning <strong>an</strong> azimuth sector at elevation <strong>an</strong>gles <strong>of</strong> 0 to 15 deg in one degree<br />
steps. The 16 elevation steps were sc<strong>an</strong>ned in 160 sec. The area covered by<br />
Radar B during its initial sc<strong>an</strong> sequence is outlined by the dashed lines <strong>of</strong><br />
Fig. 1. A representative<br />
-l<br />
echo motion was 7 m s 1 along the radar baseline<br />
during the time interval <strong>of</strong> interest for the Doppler data. Seven m s is <strong>an</strong><br />
intermediate value between the motion <strong>of</strong> the storm as a whole <strong>an</strong>d the motion<br />
<strong>of</strong> individual cells (Part I, this series). The dotted line in Fig. 1 shows<br />
the coverage <strong>of</strong> the zenith-pointing radar as the storm advected overhead. The<br />
Doppler radar observations were made on cell W4.<br />
The characteristics <strong>of</strong> the X-b<strong>an</strong>d Doppler radars have been described by<br />
Frisch, et al (1974), but will be briefly summarized here. The complex video<br />
signals were digitally recorded for post <strong>an</strong>alysis. The zenith-pointing radar<br />
acquired data at 24 fixed heights with a dwell time <strong>of</strong> 0.065 s corresponding<br />
to 128 radar samples in each height increment. From these data the complete<br />
Doppler velocity spectrum was obtainable 96 times per minute at each height.<br />
The radar beamwidth <strong>of</strong> 0.9 deg provided a horizontal resolution better th<strong>an</strong><br />
250 m at the maximum altitude. The height resolution was 75 m <strong>an</strong>d the minimum<br />
height that could be observed was 1.8 km (MSL). (The radar altitudes were
%B<br />
III-3<br />
I\ 10 cm Radar Reflectivity<br />
\ 35,45, 55,65 dBz<br />
\ 1.40Elev.<br />
AI \ 17:27:32'<br />
I \ I<br />
2.6 2.6 2.9 km (MSL)<br />
~~~~~I / \ 3.2<br />
I - /o \ /<br />
f^^ / v v\ 60 km R<strong>an</strong>ge<br />
/\\( ,1C^<br />
\ /<br />
. o<br />
Storm<br />
Motion<br />
Sc<strong>an</strong> Region <strong>of</strong> A<br />
/ --- Sc<strong>an</strong> Region <strong>of</strong> B<br />
FLg. 1 PPI ph^entation <strong>of</strong> 10 cm atadart . edRectivity conwtours neat cloud base<br />
at 1727 MT <strong>an</strong>d sc<strong>an</strong>d L egionzs oat the DoppleA Aadaus.
III-4<br />
1.5 km MSL.) The height spacing between data locations was 600 m, with the<br />
lowest location centered at 1.9 km <strong>an</strong>d the highest at 15.7 km during the period<br />
1725:55 to 1728:05. From 1728:05 to 1736:15 the height spacing was 300 m with<br />
the lowest location centered at 1.9 km <strong>an</strong>d the highest at 8.8 km.<br />
The sc<strong>an</strong>ning radar used the same dwell time (0.065 s for 128 radar<br />
samples) <strong>an</strong>d acquired data for 384 (16 azimuth x 24 r<strong>an</strong>ge) radar resolution<br />
elements in 10 s for each fixed elevation step. Four complete elevation<br />
sc<strong>an</strong> sequences were made during the 12 min observation period. The 0.9 deg<br />
beamwidth resulted in a spatial resolution <strong>of</strong> 600 to 800 m at the location <strong>of</strong><br />
the storm. The data locations were separated by 600 m in r<strong>an</strong>ge <strong>an</strong>d about 1.5<br />
deg in azimuth. The entire Doppler velocity spectrum was calculable for each<br />
measurement point <strong>of</strong> the sc<strong>an</strong>ning radar so the radial velocity, velocity<br />
vari<strong>an</strong>ce <strong>an</strong>d radar reflectivity were estimated at each data point.<br />
3. Data <strong>an</strong>alysis procedure<br />
The radar reflectivity <strong>an</strong>d the first <strong>an</strong>d second moments <strong>of</strong> the velocity<br />
spectra were estimated from the 128 radar samples recorded at each r<strong>an</strong>ge loca-<br />
tion. A Fast Fourier Tr<strong>an</strong>sform algorithm was used with a general purpose<br />
computer to calculate the Doppler velocity spectra. Each radar acquired data<br />
for approximately 28,000 velocity spectra during the 12 min observation period,<br />
so that estimates <strong>of</strong> the spectral moments <strong>of</strong> the signal had to be made by a<br />
high speed computer from the Doppler signal plus noise data. The spectra were<br />
estimated from 128 radar samples <strong>an</strong>d the moments were computed after a velocity<br />
window was applied to the spectra. The velocity window r<strong>an</strong>ged on both sides <strong>of</strong><br />
the peak <strong>of</strong> the spectrum to points where the power density fell to within 3 dB<br />
<strong>of</strong> the receiver noise level. The windowed spectra were m<strong>an</strong>ually checked to<br />
ensure that the automated method selected the correct signal spectra <strong>an</strong>d
III-5<br />
properly accounted for velocity folding. The first <strong>an</strong>d second moments <strong>of</strong> the<br />
velocity spectra were also estimated with a "pulse-pair" algorithm (Berger<br />
<strong>an</strong>d Groginsky, 1973). The radar reflectivity factor, Z, was also calculated<br />
from the signal power estimates. The radar reflectivity values were not<br />
corrected for attenuation <strong>an</strong>d are, therefore, only approximate. The vertical<br />
air motion, W, was estimated by subtracting the terminal fall speed <strong>of</strong> the<br />
particles, VT, from the measured, reflectivity-weighted particle velocity,<br />
Vz. The terminal fall speed <strong>of</strong> the particles was estimated using the empirical<br />
z<br />
0.107<br />
relation VT = 2.6 Z <strong>of</strong> Joss <strong>an</strong>d Waldvogel (1970) as suggested by Atlas,<br />
et al (1973), with a correction for air density variations proposed by Foote<br />
<strong>an</strong>d du Toit (1969). Since the V vs. Z relationship is relatively insensitive<br />
-1<br />
to Z, the estimate <strong>of</strong> V should be accurate to within + 1 m s in rain. The<br />
Joss-Waldvogel empirical equation underestimates the fall speed if hail is<br />
present in the pulse volume, consequently the updraft would be underestimated.<br />
The reflectivity factor, me<strong>an</strong> radial velocity, <strong>an</strong>d velocity vari<strong>an</strong>ce<br />
measured by the sc<strong>an</strong>ning radar were interpolated into a Cartesi<strong>an</strong> coordinate<br />
system with the y axis along the radar baseline. The various qu<strong>an</strong>tities were<br />
then contoured <strong>an</strong>d displayed in horizontal <strong>an</strong>d vertical pl<strong>an</strong>es. Interpolation<br />
smoothed out large gradients because adjacent measurement points were used to<br />
calculate values on a Cartesi<strong>an</strong> grid. Consequently, examination <strong>of</strong> the original<br />
measurements indicated that maximum gradients <strong>of</strong> the various qu<strong>an</strong>tities were<br />
reduced by a factor <strong>of</strong> about 2 after interpolation. The radial velocity sign<br />
convention is such that motion away from the radar is registered as positive.<br />
The vertical motion <strong>of</strong> the particles, V , contributes a radial velocity com-<br />
ponent <strong>of</strong> magnitude V sin 0 to the velocity measured by the sc<strong>an</strong>ning radar,<br />
where 0 is the elevation <strong>an</strong>gle <strong>of</strong> the radar <strong>an</strong>tenna. This contribution was
III-6<br />
always less th<strong>an</strong> 1.5 m s in this experiment <strong>an</strong>d was not removed from the<br />
radial velocity fields except in the vertical pl<strong>an</strong>e containing both radars<br />
because it was known only above the zenith-pointing radar.<br />
In the region where both radars acquired data, two-dimensional air motion<br />
was calculated by combining the observations <strong>of</strong> vertical air motion by the<br />
zenith-pointing radar with the horizontal air motion along the radar baseline<br />
observed by the sc<strong>an</strong>ning radar. The horizontal component <strong>of</strong> motion, Vh, in<br />
the vertical pl<strong>an</strong>e through the two radars was derived from the measured radial<br />
velocity, VR, using the relationship VR = Vz sin 0 + Vh cos 0. The two-<br />
dimensional air motion field was corrected for echo motion by removing a<br />
7 m s- 1 component from the horizontal velocity.<br />
4. Nature <strong>of</strong> the data<br />
An example <strong>of</strong> the data acquired by the zenith-pointing radar is shown in<br />
Fig. 2 to illustrate the temporal variability <strong>of</strong> the vertical structure.<br />
Sixty-four data points from a sample obtained in the updraft region over a<br />
period <strong>of</strong> 40 s are shown. The terminal fall speed computed from the Joss-<br />
Waldvogel equation varied from 8.2 to 9.4 m s for the reflectivity values<br />
shown in Fig. 2 (center), so the maximum updraft must have exceeded 13 m s- 1<br />
-1<br />
The particle velocity, V , ch<strong>an</strong>ged 6 m s 1 in 8 s with little ch<strong>an</strong>ge in<br />
reflectivity, demonstrating that rapid ch<strong>an</strong>ges c<strong>an</strong> occur in the updraft. The<br />
beamwidth was about 120 m at 9.1 km altitude, <strong>an</strong>d the pulse length was about<br />
75 m. The 6 m s velocity ch<strong>an</strong>ge, therefore, occurred while the echo was<br />
advected about ½ beamwidth. If the velocity ch<strong>an</strong>ge had been caused by horizontal<br />
shear within the updraft, a shear <strong>of</strong> 10 s would have been required. If it<br />
had been caused by a 10 m sl vertical advection <strong>of</strong> the updraft, a vertical<br />
-2 -1woul d account for the velocity ch<strong>an</strong>ge.<br />
gradient <strong>of</strong> 7x10 s would account for the velocity ch<strong>an</strong>ge.
6-<br />
III-7<br />
*.'. z=9.1 km<br />
4 _ 0 . .<br />
~ 2 *. ..<br />
E0 - o *<br />
.*<br />
.· . . 0<br />
3N 0. -. *<br />
:" ' "It0. 0<br />
-2 0<br />
-4<br />
40<br />
36 . .. 0 .<br />
_ 4 0·<br />
32 - .<br />
280 0<br />
*-<br />
5- -<br />
III-8<br />
Figure 2 c<strong>an</strong> also be used to estimate the accuracy <strong>of</strong> the measured data.<br />
The st<strong>an</strong>dard deviation <strong>of</strong> the me<strong>an</strong> particle velocity, V , (top trace) is<br />
given by Miller <strong>an</strong>d Rochwarger (1970) as:<br />
DJ<br />
where TD is the dwell time, X is the radar wavelength (0.0322 m) <strong>an</strong>d a is the<br />
width <strong>of</strong> the velocity spectrum. The dwell time is the pulse repetition period<br />
(512 Us) multiplied by the number <strong>of</strong> pulses making up the sample from each<br />
volume increment (128), so T D = 0.065 s. The average width <strong>of</strong> the spectra<br />
(bottom trace) is about 2.5 m s so the st<strong>an</strong>dard deviation <strong>of</strong> the me<strong>an</strong> velo-<br />
city estimate is about 0.5 m s . The reflectivity estimates (center trace)<br />
are calculated from 128 radar samples, but the number <strong>of</strong> independent samples<br />
is given by Nath<strong>an</strong>son (1969) as:<br />
NI =<br />
4/ a TD<br />
In this experiment there are about 30 independent samples. The st<strong>an</strong>dard<br />
deviation <strong>of</strong> the reflectivity estimates is therefore about 1 dB. The st<strong>an</strong>dard<br />
deviation <strong>of</strong> the estimates <strong>of</strong> spectral width, a, is given by<br />
[3- 2 DT] (Miller <strong>an</strong>d Rochwarger, 1970)<br />
-1<br />
<strong>an</strong>d is about 0.35 m s for the data in the lower trace <strong>of</strong> Fig. 2.<br />
Figure 3 shows examples <strong>of</strong> vertical pr<strong>of</strong>iles <strong>of</strong> vertical particle velocity<br />
measured in the 0.065 s dwell time. The spatial samplings are for r<strong>an</strong>ge gate
14<br />
E<br />
.~z<br />
x-W<br />
III-9<br />
E · xX~~~~~~~~~~~~~~<br />
i ~~~~~~~~~X\~~~~<br />
N X~~~~~~~~~~~~~~~<br />
X 10 X<br />
X<br />
X X<br />
,X I ox 4X X<br />
X X<br />
* k AI \ x II/<br />
0I. X X<br />
2 1 ;I sIei<br />
-2O -10 0 -20 -10 0 -20 -10 0 10 msec. t<br />
1735:01 1130:31 1126:01<br />
Ff2 . 3 V&Lctica pa t'c.&? v~eocityj p'4&~i~e~s mevswhed by, .teh~ ze~nith-po~iuttng<br />
/tdaILv cmd ve~'~tic~cd w&ind e~stimateA dchLve~d 6hwm -th. Jlo44-W~aedvog~e<br />
VT - Z i~~tcOJ'io.<br />
X<br />
ox<br />
'I
III-10<br />
spacings <strong>of</strong> 600 m (at 1726:01 MDT) <strong>an</strong>d 300 m (1735:01 <strong>an</strong>d 1730:31). The pr<strong>of</strong>ile<br />
measured at 1726:01 illustrates the vertical variability <strong>of</strong> the velocity struc-<br />
ture, particularly in the updraft region above 6.5 km. At 1730:31 the maximum<br />
altitude <strong>of</strong> the measurements had been reduced from 15.7 to 8.8 km. The pr<strong>of</strong>ile<br />
in the center trace <strong>of</strong> Fig. 3 indicates a downdraft existed over the radar at<br />
that time. The pr<strong>of</strong>ile measured at 1735:01 in the back portion <strong>of</strong> the storm<br />
-1<br />
shows weak downdrafts. Particle velocities as high as +12 m s 1 were measured<br />
in the updraft at 1726:01, but 4.5 min later, after the storm had advected less<br />
th<strong>an</strong> 2 km, velocities <strong>of</strong> -20 m s were measured.<br />
5. Results<br />
a. Air motion in. the vertical pl<strong>an</strong>e through the radar sites<br />
Figure 4-a shows the time vs. height plot <strong>of</strong> the 10-cm radar reflectivity<br />
above the zenith-pointing radar. The dotted line outlines the time <strong>an</strong>d height<br />
<strong>of</strong> the data acquired by the zenith-pointing radar. As c<strong>an</strong> be seen in Fig. 4-a<br />
the operator <strong>of</strong> the zenith-pointing radar reduced the maximum observed altitude<br />
shortly after the upper-level high reflectivity region had passed overhead.<br />
Radar B sc<strong>an</strong>ned all <strong>of</strong> the echo structure shown in Fig. 4-a except for the very<br />
earliest <strong>an</strong>d latest portions.<br />
Figure 4-b shows contours <strong>of</strong> vertical air motion derived from the Doppler<br />
velocities <strong>an</strong>d reflectivity measured by the zenith-pointing radar using the<br />
Joss-Waldvogel equation to remove the VT component.' Five s averages (8 values)<br />
<strong>of</strong> Z <strong>an</strong>d V were used to derive <strong>an</strong> estimate <strong>of</strong> W every 5 s, or 35 m for <strong>an</strong> echo<br />
motion <strong>of</strong> 7 m. The time-height values <strong>of</strong> W represent the region inside the<br />
motion <strong>of</strong> 7 m s . The time-height values <strong>of</strong> W represent the region inside the<br />
dotted outline <strong>of</strong> Fig. 4-a. No updrafts were observed below 6.5 km, but the<br />
trend <strong>of</strong> the data suggests that the low-level portion <strong>of</strong> the updraft had advected<br />
past Radar A before 1725. The boundary <strong>of</strong> the surface outflow passed the radar
III-ll<br />
4 Sc<strong>an</strong> onSc<strong>an</strong> Region for<br />
14 for Radar B _ _<br />
.<br />
Sc<strong>an</strong> Ri Reio.....<br />
. _ ..<br />
I .<br />
0 2 4 6 8 10 12<br />
km<br />
Vertical Velocity- IOmsec- \ \ Vari<strong>an</strong>ce <strong>of</strong> '<br />
m sec-' I e\ Verti c o l Veocity i-`2.<br />
.- m seci<br />
ec<br />
= K I" ' c -<br />
"\"~~~~' · e *p J<br />
: !. .^ -<br />
!^<br />
2<br />
\(jf^/.r ''"\\\· "!'"<br />
~. ~I .<br />
4 Cloud . . ......<br />
Fig. 4 a) Time-height presention <strong>of</strong> 10 cm reflectivity contourw meiurwed<br />
over the zenth-pointing Vopple. rtadat. <strong>an</strong>d the sc<strong>an</strong> riegiaons for<br />
the DopperL tradac s.<br />
b) Aveuaged vvetica wind contowuT measured by the zen.lth-poiLnting<br />
radarL tom 11726 to 1736 MOT.<br />
c) Two-dimensioncu& aitr motion uelative. to thee stotun echo motion -in<br />
the vetiutcaZ pl<strong>an</strong>e through the two DoppRe tadar6s.<br />
d) Averaged velocity vari<strong>an</strong>ce measuwed by the zenith-pointing tadar.
III-12<br />
at 1715 while the leading edge <strong>of</strong> the low-level echo arrived at 1725. Maximum<br />
updraft values occurred between 8.0 <strong>an</strong>d 10.3 km altitude. The slope <strong>of</strong> the<br />
updraft contours indicates that the updraft was tilted toward the north--<br />
opposite to the direction <strong>of</strong> echo motion. This tilt was about 20 deg from<br />
the vertical. Highest downdrafts were measured between 3 <strong>an</strong>d 5.5 km altitude<br />
<strong>an</strong>d occurred just behind the updraft. The back portion <strong>of</strong> the storm contained<br />
weak downdrafts in the lower levels, but near the highest altitude observed<br />
there were weak updrafts, even after the portion <strong>of</strong> the storm with highest<br />
reflectivity had advected past.<br />
The two-dimensional air motion in a vertical pl<strong>an</strong>e through the storm<br />
observed by both radars is shown in Fig. 4-c. The vector representation shows<br />
the air motion relative to the storm in the region outlined by the dotted lines<br />
in Fig. 4-a. The tr<strong>an</strong>sition between strongest updraft <strong>an</strong>d strongest downdraft<br />
probably took place over a dist<strong>an</strong>ce <strong>of</strong> about 3 km, <strong>an</strong>d as we shall show, strong<br />
turbulence was generated in this region. The most intense part <strong>of</strong> the down-<br />
draft appears to have been fed by air which had ascended in the updraft, as<br />
postulated by Newton (1963). The peak downdraft occurred in the region <strong>of</strong><br />
highest reflectivity <strong>an</strong>d water loading probably contributed to the downdraft.<br />
Reflectivity contours measured by Radar B in the vertical pl<strong>an</strong>e through<br />
the radars are shown in Fig. 5-a. The highest reflectivity factors measured<br />
by the 3-cm radar were about 50 dBZ <strong>an</strong>d occurred at <strong>an</strong> altitude <strong>of</strong> 5.5 km <strong>an</strong>d<br />
2 km west <strong>of</strong> the baseline joining the radars. The 3-cm radar reflectivity<br />
contours shown in Fig. 5-a are plotted from data acquired between 1727 <strong>an</strong>d<br />
1729:40 while the radar sc<strong>an</strong>ned through 16 elevation <strong>an</strong>gles. The time-height<br />
plot <strong>of</strong> 10 cm radar reflectivity factor shown in Fig. 4-a is a 30 min history<br />
<strong>of</strong> the reflectivity over Radar A. Reflectivity plotted in Fig. 4-a <strong>an</strong>d Fig. 5-a
z<br />
III-13<br />
354° STORM<br />
- -- ~ MOTION<br />
1727-1729:40 ,DT 8<br />
.r - 24 - 32 Reflectivity<br />
11.5|- I < = I dl)z<br />
km 401<br />
6.5 - 36<br />
1.5 L2<br />
z<br />
11.5<br />
28 -'S KI //. ~~~32I /-<br />
- 8 - 2 41<br />
2 8<br />
11.5 , j "--" -,I Velocity<br />
4,, _ _..( m sec<br />
1.5 10 - 5 OkmI.<br />
10<br />
1.5-i<br />
z ~- -<br />
22<br />
11.5 ,I/<br />
km<br />
^--O 0I < Vari<strong>an</strong>ce<br />
/' 1"/---4 ,~ l. m sec 2<br />
km<br />
Fig. 5 a) Thtee cm tadazt a etectivit ty, b) tadiat pacticte velocity, <strong>an</strong>d<br />
C) veocity va'i<strong>an</strong>ce meatwled by Radat B in .the veticat pa&ne<br />
uthAogh the twao DoppteQ Pltadee tudac <strong>of</strong>ed |ine4 . The. eglon<br />
coAte-<br />
4ponds to ;the scavn eg 'on do Rada. B s4hown in Fig. 6haded 4-a-. The<br />
t eg-on<br />
en b indicautes tadicial ve2ocQie s that exceed the echo motion <strong>of</strong> 7 m 4-1.<br />
The 4haded Legion in c indicawte4 wheh e the zenUth-pozntLng radah mea6uhed<br />
the. main uapdtrat.
III-14<br />
should have been the same if: (1) attenuation <strong>of</strong> the 3-cm radar was negli-<br />
gible, (2) the storm track was from 354 deg during the time period 1720 to<br />
1750, (3) the storm was in steady-state during this time, <strong>an</strong>d (4) both radars<br />
were properly calibrated. None <strong>of</strong> these conditions was precisely satisfied.<br />
Reflectivity gradients at the leading <strong>an</strong>d trailing edges <strong>of</strong> the storm appear<br />
similar in the two plots, although the measured reflectivity values were greatly<br />
different. Attenuation <strong>of</strong> the 3-cm radar signals would be most noticeable at<br />
mid-level <strong>of</strong> the leading edge <strong>of</strong> the storm, but the 3-cm radar reflectivity<br />
contours portray a structure similar to that depicted by the 10-cm radar.<br />
The radial velocity field (measured by Radar B) shown in Fig. 5-b corre-<br />
sponds to the time <strong>an</strong>d. location <strong>of</strong> the reflectivity data shown in Fig. 5-a.<br />
The velocity contours are absolute velocities; there is no correction for the<br />
echo motion <strong>an</strong>d no correction for the terminal fall velocity contribution.<br />
Negative velocities are directed toward Radar B <strong>an</strong>d positive velocities are<br />
directed away from it. Strong updrafts were measured above Radar A during<br />
the time these data were collected by Radar B. The velocity field in Fig. 5-b<br />
suggests the location <strong>of</strong> the updraft even without verification from Radar A.<br />
Air feeding the updraft entered the storm from the right side <strong>of</strong> Fig. 5-b<br />
(Part I). Figure 5-b indicates that the air was moving into the storm at mid-<br />
-1<br />
levels with a horizontal velocity component as high as 10 m s 1 relative to<br />
the storm. The region <strong>of</strong> high radial velocity gradient above Radar A clearly<br />
defines the interface that existed between the updraft <strong>an</strong>d downdraft. The<br />
measured component <strong>of</strong> airflow at the rear <strong>of</strong> the storm above 7.5 km was<br />
generally similar to that in the near environment as measured by the nearest<br />
representative radiosonde. Mid-level air was overtaking the storm from the<br />
backside at 6.5 to 8.5 km altitude. The outflow at the top <strong>of</strong> the storm had
III-15<br />
a strong northward component <strong>of</strong> more th<strong>an</strong> 15 m s relative to the storm. The<br />
trend <strong>of</strong> the radial velocity in the y direction suggests that weak outflow at<br />
the top <strong>of</strong> the storm could have occurred in the direction <strong>of</strong> echo motion. It<br />
seems unlikely that this implied weak outflow would have been strong enough to<br />
have led to particle recirculation to account for the few larger hailstones<br />
found in this storm. The velocity field shown in Fig. 5-b is in agreement<br />
with photographs which show a small <strong>an</strong>vil overh<strong>an</strong>g in the direction <strong>of</strong> echo<br />
motion (Part I) <strong>an</strong>d a large <strong>an</strong>vil overh<strong>an</strong>g toward the northeast. The surface<br />
<strong>an</strong>emometer readings <strong>of</strong> 13-17 m s are higher th<strong>an</strong> the velocities seen by the<br />
radar in the gust front, <strong>an</strong>d they therefore indicate that the strongest low-<br />
level outflow in the direction <strong>of</strong> echo motion occurred in the lowest few hundred<br />
meters; this was not observed by the radar.<br />
b. Air motion in horizontal pl<strong>an</strong>es<br />
Figures 6 a-c show the radial vleocity fields measured by Radar B at<br />
three altitudes. These data were acquired during the time period 1727 to<br />
1729:40. The lowest altitude is labeled 1.8 km, but the <strong>an</strong>tenna pattern at<br />
elevation <strong>an</strong>gles corresponding to this altitude was distorted by ground<br />
blocking so the data shown for this altitude are actually more representative<br />
<strong>of</strong> the wind field at about 2.1 km. The radial velocity fields in Fig. 6 are<br />
not corrected for echo motion. The velocity field at low altitude reveals<br />
outflow in the direction opposite the echo motion <strong>an</strong>d also outflow in the gust<br />
front. The radial velocity field at 6.5 km (Fig. 6-b) shows the strong con-<br />
vergence <strong>of</strong> the updraft air at the south or leading edge <strong>of</strong> the storm <strong>an</strong>d the<br />
downdraft air from the backside that was overtaking the storm over a wide area.<br />
Two regions <strong>of</strong> air moving into the storm (contours labeled - 2 m s 1 ) probably<br />
correspond to the two distinct inflow br<strong>an</strong>ches toward W4 <strong>an</strong>d W5 as identified
III-16<br />
1727-1729-40 MDT N<br />
STORM !<br />
MOTION<br />
km . km<br />
Z= 1.8 km<br />
~18 .J-. 18- _ Z=6.5 km<br />
1 -2 m sec -<br />
7<br />
_0<br />
Velocity .<br />
,<br />
Velodty<br />
9.~~~ 9<br />
0 I i o<br />
.~ m sec -'<br />
km<br />
aude, kmb-<strong>an</strong>d'c) Z:.5 Z=11.5 km 2 Z=6.5 km<br />
Pl<strong>an</strong>e <strong>of</strong> 2<br />
n-8-' 8 . Velocity y Fig.5c a Vari<br />
e<strong>an</strong>I Q «Q 4fflQ M « n ItgtaM<br />
\Va ri<strong>an</strong>ce<br />
+<br />
4<br />
-29 - 9<br />
-44m sec- 14 2 e2-- - smec- 2<br />
Ln-T- ------- ^^ I I _ x L._- ,-I x<br />
0 9 km 18 27 0 '9 m 18 27<br />
Fig. 6 Radiat paitice veJocity (abso.ute) at a) 1.8 km attiJtude, b) 6.5 km<br />
ati.ttude, <strong>an</strong>d c) 11.5 km al-titude mewaaed by leiocated Radar B<br />
50 km<br />
nouth <strong>of</strong> the storim. The shaded regions indicate radiala veoc&ites that exceed '<br />
the stoam motion <strong>of</strong> 7 m -l ' . d) Velocity vaiZ<strong>an</strong>ce at 6.5 km altitude. The<br />
4c<strong>an</strong> egioons aWe the -6ame a6s thoe in Fig. I.<br />
i10'
III-17<br />
in Part I. The main updraft <strong>of</strong> W4 had just advected past Radar A at this<br />
altitude when these data were acquired. The maximum radial velocity shear<br />
indicated by these contours is about 5x10 s whereas the data prior to<br />
interpolation indicate peak shear values greater th<strong>an</strong> 10 s . The updraft<br />
<strong>an</strong>d downdraft regions <strong>of</strong> the storm were readily distinguished on the basis<br />
<strong>of</strong> the radial velocity fields measured by Radar B, but if the Doppler radar<br />
had been located due west <strong>of</strong> the storm it probably would not have been able<br />
to discriminate between these regions so readily. The low <strong>an</strong>d mid-level<br />
radar data in Fig. 6 show that the cell that passed over Radar A was contiguous<br />
with a line <strong>of</strong> cells that formed about 30 km to the east.<br />
The radial velocity contours at 11.5 km (Fig. 6-c) show the strong diver-<br />
gence near the top <strong>of</strong> the updraft. Particle velocities at this level appeared<br />
as though the particles were ejected from a fountain. The motion relative to<br />
the storm was strongly toward the north over a wide area at the back <strong>of</strong> the<br />
storm. The environmental winds at this altitude were from the west-southwest<br />
at about 12 m s , corresponding to a radial component <strong>of</strong> only about 3 m s .<br />
Particle velocity with a southerly component <strong>of</strong> 4-7 m s , nearly equal to the<br />
echo motion, occurred in front <strong>of</strong> the updraft at 11.5 km altitude so that some<br />
outflow in the direction <strong>of</strong> echo motion was likely.<br />
c. Distribution <strong>of</strong> turbulence inferred from the vari<strong>an</strong>ce <strong>of</strong> the velocity<br />
There are three major factors that c<strong>an</strong> contribute to the vari<strong>an</strong>ce or<br />
second moment <strong>of</strong> the Doppler spectrum measured by a radar with a narrow beam-<br />
width: wind shear, turbulence, <strong>an</strong>d the spread <strong>of</strong> particle fall speed in still<br />
air (Atlas, 1964). The contribution to the vari<strong>an</strong>ce caused by fall speeds is<br />
given by a sin 2<br />
where aD is the fall spread that would be observed in<br />
2 2 -2<br />
still air at vertical incidence. aD is about 1 m s for rainfall <strong>an</strong>d is
III-18<br />
nearly independent <strong>of</strong> rainfall rate (Lhermitte, 1963). For exponentially<br />
distributed hail with a maximum diameter <strong>of</strong> 1.5 cm, as occurred in this storm,<br />
2 2 -2<br />
o D is 4 to 6 m s (Batt<strong>an</strong>, 1974). The vari<strong>an</strong>ce caused by wind gradients<br />
parallel to the radar beam is given by<br />
(k h) 2<br />
-12 (Sirm<strong>an</strong>s <strong>an</strong>d Doviak, 1973)<br />
where kR where is the radial shear ( (s ) along the beam <strong>an</strong>d h is the pulse length.<br />
For shear across the beam, the vari<strong>an</strong>ce contribution is given by (0.3 kT R4) 2<br />
where kT is the radial shear tr<strong>an</strong>sverse to the beam (Nath<strong>an</strong>son, 1969), R is<br />
the r<strong>an</strong>ge, <strong>an</strong>d D is the one-way, half-power beamwidth.<br />
All factors that contribute to the vari<strong>an</strong>ce must be considered for the<br />
zenith-pointing radar but the fall speed spread c<strong>an</strong> be neglected for the quasi-<br />
horizontally sc<strong>an</strong>ning radar because the contribution caused by fall speed was<br />
2 -2 2: -2<br />
at most 0.08 m s in rain <strong>an</strong>d 0.5 m s in hail. The measured vari<strong>an</strong>ces<br />
2 -2<br />
in this storm were much greater th<strong>an</strong> 0.5 m s in regions where hail was<br />
probably present <strong>an</strong>d much greater th<strong>an</strong> 0.08 throughout the storm. Since the<br />
fall speed spread was negligible for the sc<strong>an</strong>ning radar <strong>an</strong>d since the radial<br />
velocity field was measured throughout the storm, thus making the radial shear<br />
known, the turbulence throughout the storm could be calculated from the vari<strong>an</strong>ce<br />
field measured by the sc<strong>an</strong>ning radar (Strauch, et al, 1975).<br />
The velocity vari<strong>an</strong>ce measured by Radar A is shown in Fig. 4-d <strong>an</strong>d the<br />
vari<strong>an</strong>ce measured by Radar B is shown in Figs. 5-c <strong>an</strong>d 6-d. Vari<strong>an</strong>ce data from<br />
the zenith-pointing radar were contoured after smoothing by taking <strong>an</strong> 8-point<br />
(5 s) average. High vari<strong>an</strong>ces were observed by Radar A in two regions <strong>of</strong> the<br />
storm: at mid-levels where Radar B also measured high vari<strong>an</strong>ces <strong>an</strong>d just
III-19<br />
below cloud base where Radar B did not measure high vari<strong>an</strong>ce., The low-level<br />
b<strong>an</strong>d <strong>of</strong> high vari<strong>an</strong>ce must therefore be attributed to spread in particle fall<br />
speeds. In fact, shear or turbulence would have caused Radar B to measure<br />
larger vari<strong>an</strong>ces th<strong>an</strong> Radar A because the pulse volume <strong>of</strong> Radar B was much<br />
larger. The large vari<strong>an</strong>ce at mid-levels seen by Radar A were caused, in<br />
part, by shear <strong>an</strong>d turbulence. Figure 2 shows that its beamwidth was too<br />
large to resolve strong local horizontal gradients in the updraft, so this<br />
kind <strong>of</strong> local shear would be interpreted as turbulence in its contribution to<br />
the vari<strong>an</strong>ce.<br />
Vari<strong>an</strong>ces measured by Radar B (Figs. 5-c <strong>an</strong>d 6-d) at the back <strong>of</strong> the storm<br />
2 -2<br />
were less th<strong>an</strong> 2 m s <strong>an</strong>d c<strong>an</strong> be attributed to vertical gradients <strong>of</strong> the<br />
-3 -1<br />
radial velocity since the vertical shear <strong>of</strong> 5x10 s , seen in Fig. 5-b, is<br />
2 -2<br />
sufficient to cause a vari<strong>an</strong>ce exceeding 2 m s . On the other h<strong>an</strong>d, the<br />
core <strong>of</strong> large vari<strong>an</strong>ce between 5.5 <strong>an</strong>d 9.5 km in Figs. 5-c <strong>an</strong>d 6-d c<strong>an</strong>not be<br />
attributed to shear because the large shear in this region was parallel to<br />
the beam, <strong>an</strong>d its contribution to the vari<strong>an</strong>ce was small since the pulse length<br />
was only 75 m. This region contains large gradients in the vertical velocity<br />
(Fig. 4-c) but these gradients do not contribute signific<strong>an</strong>tly to the vari<strong>an</strong>ce<br />
observed by Radar B. We conclude that the high vari<strong>an</strong>ce core measured by<br />
Radar B was caused mainly by turbulence generated by the large horizontal<br />
shear <strong>of</strong> the vertical wind at the interface between updraft <strong>an</strong>d downdraft.<br />
The dissipation rate, e, derived from the velocity vari<strong>an</strong>ce field measured by<br />
2 -3<br />
Radar B varied less th<strong>an</strong> 30 cm s at the back <strong>of</strong> the storm to more th<strong>an</strong><br />
2 -3<br />
3000 cm s in the region between the updraft <strong>an</strong>d downdraft (Strauch, et al,<br />
1975). These values sp<strong>an</strong> the entire r<strong>an</strong>ge <strong>of</strong> values measured by aircraft in<br />
clear air turbulence,
III-20<br />
We assumed that the outer scale in the inertial subr<strong>an</strong>ge was larger th<strong>an</strong><br />
the largest dimensions <strong>of</strong> the radar pulse volume (800 m). Energy spectra<br />
with a -5/3 power law to scales greater th<strong>an</strong> 1.5 km have been measured with<br />
penetration aircraft in thunderstorms (Steiner <strong>an</strong>d Rhyne, 1962). The radial<br />
velocity fields shown in Figs. 5-b <strong>an</strong>d 6-a seem to indicate that the outer<br />
scale is no larger th<strong>an</strong> the radar resolution since they do not contain fluc-<br />
tuations at scales <strong>of</strong> 1 to 2 km. However, the interpolations used to tr<strong>an</strong>sform<br />
the measured data to Cartesi<strong>an</strong> grid points filtered the energy spectrum at<br />
scale sizes between the radar beamwidth <strong>an</strong>d the outer scale so the radial<br />
velocity fields show only org<strong>an</strong>ized motions. Spectra measured with penetration<br />
aircraft in severe Oklahoma storms (Steiner <strong>an</strong>d Rhyne, 1962) showed dissipation<br />
rates that exceeded those measured by our radar.<br />
5. Conclusions<br />
The Doppler radar measurements described constitute a unique data set<br />
because, for the first time, a sc<strong>an</strong>ning Doppler radar obtained the three-<br />
dimensional field <strong>of</strong> reflectivity, radial velocity, <strong>an</strong>d the velocity vari<strong>an</strong>ce<br />
<strong>of</strong> the radial velocity in a volume that included the updraft <strong>of</strong> a convective<br />
storm, while, at the same time, a zenith-pointing radar observed part <strong>of</strong> the<br />
storm as it advected overhead. The Doppler radar data do not provide the<br />
total picture, but they display more <strong>of</strong> the kinematic structure th<strong>an</strong> c<strong>an</strong> be<br />
obtained by other instruments.<br />
The data obtained by the sc<strong>an</strong>ning Doppler radar illustrate both the utility<br />
<strong>an</strong>d the limitations <strong>of</strong> single Doppler radar measurements. The radial velocity<br />
field from a single radar c<strong>an</strong>not yield the unambiguous three-dimensional wind<br />
fields that c<strong>an</strong> be derived from dual-Doppler measurements; however, m<strong>an</strong>y<br />
features <strong>of</strong> the overall air motion in convective storms c<strong>an</strong> be inferred from
III-21<br />
the radial velocity fields. This is especially true if, as in this case, the<br />
primary motion <strong>of</strong> the air entering <strong>an</strong>d leaving the storm is in a vertical pl<strong>an</strong>e<br />
radial to the radar.<br />
The second moment <strong>of</strong> the Doppler spectrum, obtained by a Doppler radar<br />
sc<strong>an</strong>ning the entire storm at low elevation <strong>an</strong>gles, portrays.regions <strong>of</strong> high<br />
shear <strong>an</strong>d turbulence. The turbulence contribution c<strong>an</strong> be isolated because<br />
shear c<strong>an</strong> be inferred from the radial velocity fields. Measurement <strong>of</strong> the<br />
second moment fields <strong>an</strong>d their evolution requires only a single radar.. These<br />
data have not previously been fully utilized by radar meteorologists, but they<br />
c<strong>an</strong>, in principle, provide a warning <strong>of</strong> d<strong>an</strong>gerous turbulence or wind shear<br />
conditions <strong>an</strong>d c<strong>an</strong> aid in underst<strong>an</strong>ding how seed material or tracers will<br />
diffuse in a storm.
III-22<br />
REFERENCES<br />
Atlas, D., 1964: Adv<strong>an</strong>ces in radar meteorology. Adv<strong>an</strong>ces in Geophysics, 10,<br />
318-478. Academic Press, New York.<br />
__ , R. C. Srivastava, <strong>an</strong>d R. S. Sekhon, 1973: Doppler radar characteristics<br />
<strong>of</strong> precipitation at vertical incidence. Rev. Geophys. Space Phys., 11,<br />
1-35.<br />
Batt<strong>an</strong>, L. J., 1974: Doppler radar observations <strong>of</strong> a hailstorm. Sci. Rep. #28,<br />
Univ. <strong>of</strong> Arizona, Tucson.<br />
Berger, T., <strong>an</strong>d H. L. Groginsky, 1973: Estimation <strong>of</strong> the spectral moments <strong>of</strong><br />
pulse trains. International Conf. on Information Theory, Tel Aviv, Israel.<br />
Browning, K. A., T. W. Harrold, A. J. Wym<strong>an</strong>, <strong>an</strong>d J. G. C. Beimers, 1968:<br />
Horizontal <strong>an</strong>d vertical air motion <strong>an</strong>d precipitation growth within a<br />
shower. Quart. J. Roy. Meteor. Soc., 94, 498-509.<br />
Foote, G. B., <strong>an</strong>d P. S. du Toit, 1969:; Terminal velocity <strong>of</strong> raindrops al<strong>of</strong>t.<br />
J. Appl. Meteor., 8, 249-253.<br />
Frisch, A. S., L. J. Miller, <strong>an</strong>d R. G. Strauch, 1974: Three-dimensional air<br />
motion measured in snow. Geophys. Res. Letters, 1, 86-89.<br />
Joss, J., <strong>an</strong>d A. Waldvogel, 1970: Raindrop size distribution <strong>an</strong>d Doppler<br />
velocities. Preprints, 14th Radar Meteor. Conf., Tucson, Ariz.; Amer.<br />
Meteor. Soc., 153-156.<br />
Lhermitte, R. M., 1963: Motions <strong>of</strong> scatterers <strong>an</strong>d the vari<strong>an</strong>ce <strong>of</strong> the me<strong>an</strong><br />
intensity <strong>of</strong> weather radar signals. Sperry R<strong>an</strong>d Res. Center, 5RRC-RR-63-57,<br />
Sudbury, Mass.<br />
Miller, K. S., <strong>an</strong>d M. M. Rochwarger, 1970: On estimating spectral moments in<br />
the presence <strong>of</strong> colored noise. IEEE Tr<strong>an</strong>s. in Form Theory, IT-16, 303-309.
III-23<br />
Nath<strong>an</strong>son, F. E., 1969: Radar Design Principles; Signal Processing <strong>an</strong>d the<br />
Environment. McGraw-Hill, New York.<br />
Newton, C. W., 1963: Dynamics <strong>of</strong> severe convective storms. Meteor. Monograph,<br />
5, (27), 33-58.<br />
Sirm<strong>an</strong>s, D., <strong>an</strong>d R. J. Doviak, 1973: Meteorological radar signal estimates.<br />
NOAA Tech. Memo. ERL-NSSL-64, U. S. Dept. <strong>of</strong> Commerce, Norm<strong>an</strong>, Okla., 80 pp'.<br />
Steiner, R., <strong>an</strong>d R. H. Rhyne, 1962: Some measured characteristics <strong>of</strong> severe<br />
storm turbulence. National Severe Storms Project, Report No. 10, U. S.<br />
Dept. <strong>of</strong> Commerce.<br />
Strauch, R. G., A. S. Frisch, <strong>an</strong>d W. B. Sweezy, 1975: Doppler radar measurements<br />
<strong>of</strong> turbulence, shear, <strong>an</strong>d dissipation rates in a convective storm. Pre-<br />
prints, 16th Radar Meteor. Conf., Houston, Texas; Amer. Meteor. Soc., 83-88.
<strong>Structure</strong> <strong>of</strong> <strong>an</strong> <strong>Evolving</strong> <strong>Hailstorm</strong>. Part IV:<br />
Internal <strong>Structure</strong> from Penetrating Aircraft<br />
by<br />
D. J. Musil, E. L. Mayl, P. L. Smith, Jr., <strong>an</strong>d W. R. S<strong>an</strong>d<br />
Institute <strong>of</strong> Atmospheric Sciences 2 , South Dakota School<br />
<strong>of</strong> Mines <strong>an</strong>d Technology, Rapid City, South Dakota<br />
1Current affiliation: National Weather Service, Detroit, Michig<strong>an</strong>.<br />
2 This research was performed as part <strong>of</strong> the National Hail Research Experiment,<br />
m<strong>an</strong>aged by the National Center for Atmospheric Research <strong>an</strong>d sponsored by the<br />
Weather Modification Program, Research Applications Directorate, National<br />
Science Foundation.
ABSTRACT<br />
Precipitation particle sizes were measured using a continuous<br />
hydrometeor sampler (foil impactor) during penetrations <strong>of</strong> hailstorms<br />
with <strong>an</strong> armored T-28 aircraft. Data have been <strong>an</strong>alyzed from three pene-<br />
trations <strong>of</strong> a storm near Raymer, Colorado on 9 July 1973 at altitudes<br />
between 5.5 <strong>an</strong>d 7.2 km MSL, which correspond to temperatures between<br />
about -2C <strong>an</strong>d -12C. Other results pertinent to the Raymer storm are<br />
discussed in Parts I, II, III, <strong>an</strong>d V elsewhere in this issue.<br />
Most <strong>of</strong> the particles were identified as ice particles or ones<br />
containing both ice <strong>an</strong>d water; however, signific<strong>an</strong>t amounts <strong>of</strong> liquid<br />
particles were found in the updrafts <strong>of</strong> developing cells at tempera-<br />
tures as cold as -12C. Particles larger th<strong>an</strong> 5 mm in diameter were<br />
typically found along the edges <strong>of</strong> the updrafts, with the precipitation<br />
concentrations being strongly dependent on these larger particles.<br />
The downdrafts were composed <strong>of</strong> ice particles.<br />
Several particle size distributions from one <strong>of</strong> the penetrations<br />
were examined. The distributions are roughly exponential, or<br />
bi-exponential when large particles are present.
1. Introduction<br />
IV-1<br />
There have been numerous investigations <strong>of</strong> particle size distributions<br />
from precipitation observations made at the ground using camera devices<br />
<strong>an</strong>d impact devices (e.g., Cat<strong>an</strong>eo <strong>an</strong>d Stout, 1968; Waldvogel, 1974;<br />
Federer <strong>an</strong>d Waldvogel, 1975). Investigations <strong>of</strong> in-cloud particle sizes<br />
have used airborne foil impactors based on a principle first described<br />
by Brown (1958) but have necessarily been restricted to small cumuli<br />
(Bethwaite et al., 1966; Schroeder, 1973) <strong>an</strong>d frontal clouds (Cornford,<br />
1966). Systematic observations within hailstorms <strong>an</strong>d thunderstorms are<br />
virtually nonexistent because <strong>of</strong> the difficulty <strong>an</strong>d d<strong>an</strong>ger involved in<br />
obtaining them.<br />
During the 1973 National Hail Research Experiment (NHRE) field<br />
season, a continuous hydrometeor sampler (foil impactor) was flown<br />
aboard <strong>an</strong> armored T-28 aircraft <strong>an</strong>d obtained observations <strong>of</strong> particle<br />
sizes on a routine basis. The purpose <strong>of</strong> this paper is to present the<br />
results <strong>of</strong> a detailed <strong>an</strong>alysis <strong>of</strong> the foil data obtained from penetra-<br />
tions <strong>of</strong> a hailstorm occurring near Raymer, Colorado, on 9 July 1973.<br />
This paper c<strong>an</strong> be viewed as <strong>an</strong> extension <strong>of</strong> the work by May (1974), who<br />
initially <strong>an</strong>alyzed the foil data. The paper is part <strong>of</strong> a comprehensive<br />
<strong>an</strong>alysis <strong>of</strong> data from the Raymer storm by several particip<strong>an</strong>ts in NHRE<br />
which appears elsewhere in this issue (see Parts I, II, III, <strong>an</strong>d V).<br />
2. Data collection <strong>an</strong>d reduction<br />
The foil impactor was flown aboard <strong>an</strong> armored T-28 aircraft operated<br />
by the South Dakota School <strong>of</strong> Mines <strong>an</strong>d Technology. The mode <strong>of</strong> operation
IV-2<br />
<strong>an</strong>d other information collected by the T-28 system have been described<br />
by S<strong>an</strong>d <strong>an</strong>d Schleusener (1974).<br />
Typically the T-28 mission consisted <strong>of</strong> gathering data during<br />
penetrations <strong>of</strong> active hailstorms beginning at <strong>an</strong> altitude 3 <strong>of</strong> about<br />
7.3 km <strong>an</strong>d proceeding downward by 0.6 km intervals until 4.9 km was<br />
reached. The aircraft was vectored with the objective <strong>of</strong> entering the<br />
maximum radar reflectivity zone <strong>an</strong>d major updraft at aircraft altitude<br />
on each storm penetration. A penetration was usually made at a const<strong>an</strong>t<br />
heading until clear air was encountered or until the T-28 was well clear<br />
<strong>of</strong> <strong>an</strong>y radar echoes. Typically, three to six penetrations were made<br />
on each mission.<br />
2.1 Description <strong>of</strong> foil impactor<br />
The foil impactor has a moving strip <strong>of</strong> s<strong>of</strong>t aluminum foil<br />
approximately 7.5 cm wide <strong>an</strong>d 30 pm thick, which passes by <strong>an</strong> open<br />
window with dimensions <strong>of</strong> 3.75 by 3.75 cm at a speed <strong>of</strong> about 3.8 cm<br />
s . The foil is backed by a ridged drum so that when ambient air<br />
strikes the foil, particles in the air leave impressions on the foil.<br />
The particle sizes c<strong>an</strong> be determined from marks left within the imprints<br />
on the foil by the ridges on the drum, which are spaced at 250 Pm<br />
increments. Thus the smallest particles <strong>an</strong>d the diameter resolution<br />
<strong>of</strong> particles included in this study are <strong>of</strong> the order <strong>of</strong> 0.25 mm. 4<br />
The foil impactor face plate is electrically heated to minimize<br />
icing problems that c<strong>an</strong> occur in the severe environments <strong>of</strong> the storm<br />
3 All heights are given with respect to me<strong>an</strong> sea level.<br />
4 A11 particle sizes are expressed in diameters.
IV-3<br />
penetrations. The supply roll <strong>of</strong> foil is large enough for approximately<br />
thirty minutes <strong>of</strong> in-cloud observations, which is sufficient for most<br />
missions.<br />
2.2 Data reduction<br />
Data reduction is extremely time consuming, so initially the<br />
<strong>an</strong>alysis was limited to penetrations made on two days in which the<br />
greatest vertical air motions were observed <strong>an</strong>d the pilot's comments<br />
indicated the <strong>an</strong>alysis <strong>of</strong> the foil would be most productive. Only the<br />
<strong>an</strong>alysis <strong>of</strong> data from the Raymer storm will be presented in this paper.<br />
The foil was marked <strong>of</strong>f into sections (or frames) each representing<br />
four seconds <strong>of</strong> observation time, which corresponds to a flight path <strong>of</strong><br />
about 0.4 km <strong>an</strong>d a sampling volume <strong>of</strong> about 0.6 m 3 . The particle<br />
numbers <strong>an</strong>d sizes were recorded for each frame.<br />
Particles that could be distinguished as completely liquid were<br />
recorded separately from those that were completely solid or contained<br />
some fraction <strong>of</strong> ice. The identification <strong>of</strong> liquid particles is quite<br />
simple (Miller et al., 1967) because they leave circular imprints with<br />
raised edges. Particles that are composed partly or wholly <strong>of</strong> ice tend<br />
to leave irregular, splattered imprints, making it impossible to deter-<br />
mine the amount <strong>of</strong> liquid in such a particle. The "combination"<br />
particles were recorded as ice in this study.<br />
Imprint sizes less th<strong>an</strong> 7.5 mm were corrected according to <strong>an</strong><br />
expression developed from work by Schecter <strong>an</strong>d Russ (1970). The<br />
correction is for <strong>an</strong> approximate true airspeed <strong>of</strong> 100 m s - 1 <strong>an</strong>d is.
IV-4<br />
necessary to account for the distortion <strong>of</strong> the particles upon impact<br />
on the foil. Beyond 7.5 mm, where no calibration data exist, the<br />
particle sizes were taken to be the same as the imprint sizes. The<br />
imprint sizes are probably larger th<strong>an</strong> the actual sizes for all<br />
particles encountered, as is indicated by the Schecter <strong>an</strong>d Russ work<br />
for particles smaller th<strong>an</strong> 7.5 mm; however, extrapolation <strong>of</strong> their<br />
correction procedure would lead to the opposite result for large sizes<br />
<strong>an</strong>d in extreme cases would even require particles too large to enter<br />
the window <strong>of</strong> the foil impactor.<br />
In order to obtain samples large enough to reduce some <strong>of</strong> the<br />
errors associated with small sampling volumes (Joss <strong>an</strong>d Waldvogel, 1969),<br />
data from three consecutive frames were summed to form a sample for which<br />
we computed the total number concentration for all particles observed<br />
on the foil (N ), the concentration <strong>of</strong> particles larger th<strong>an</strong> 5 mm (N 5),<br />
the precipitation concentration for particles larger th<strong>an</strong> 0.25 mm (PC),<br />
<strong>an</strong>d the percent mass liquid (PML). Then the last frame <strong>of</strong> the set was<br />
retained <strong>an</strong>d added to the next two consecutive frames <strong>an</strong>d the calcula-<br />
tions repeated. In this m<strong>an</strong>ner, smoothed data points were obtained for<br />
each 8 sec representing a 12-sec running average that corresponds to a<br />
flight path <strong>of</strong> about 1.2 km <strong>an</strong>d a sample volume <strong>of</strong> about 1.8 m 3 .<br />
3. General observations<br />
Pertinent data <strong>an</strong>d summaries from penetrations <strong>of</strong> the Raymer storm<br />
are given in Table 1. The penetrations were made between altitudes <strong>of</strong><br />
approximately 5.5 <strong>an</strong>d 7.2 km MSL which correspond to temperatures <strong>of</strong>
IV-5<br />
PENETRATION 80-I 80-2 80-3<br />
DATE 9 JULY 197 3<br />
START TIME 171636 172904 174147<br />
END TIME 172322 173649 175112<br />
AVG ALT-(km) 7.2 5.9 5.5<br />
AVG TEMP-(OC) -12 -5 -2<br />
VOL SAMPLED -(m 3 ) 59.2 68.0 819<br />
% /_100 97 100<br />
MAX 268 440 352<br />
;_ AVG 92 119 101<br />
0r 65 111 96<br />
% 42 20 25<br />
fg MAX 7.2 11.6 3.0<br />
AVG 3.3 4.8 1.7<br />
' ;!<br />
2.5 3.5 .9<br />
- %7 48 46 49<br />
MAX 2.0 2.1 1.1<br />
AVG 0.7 0.6 0.3<br />
: a Xr _<br />
X0.6 0.7 0.3<br />
Tabee i. Swumnmy ad Pcenetion cDat dafo 9 July 1973.
IV-6<br />
about -2C to -12C. These temperatures are based on adiabatic ascents<br />
from observed cloud base using the appropriate radiosondes on 9 July<br />
(Part I). Temperatures actually observed during the penetrations were<br />
not used because one <strong>of</strong> the T-28 temperature probes was subject to<br />
wetting <strong>an</strong>d freezing, while the second probe was subject to signific<strong>an</strong>t<br />
day-to-day calibration drift.<br />
Also shown in Table 1 are the maxima, me<strong>an</strong>s, <strong>an</strong>d st<strong>an</strong>dard deviations<br />
(a) for Nt, N 5 , <strong>an</strong>d PC for each penetration. Not included in the<br />
t<br />
averages were regions having PC values less th<strong>an</strong> 0,1 g m - 3 . Average.<br />
values <strong>of</strong> N. <strong>an</strong>d PC are lower th<strong>an</strong> might be expected in view <strong>of</strong> their<br />
t<br />
associated maxima because the penetrations showed the clouds to be<br />
composed <strong>of</strong> large areas where few particles were encountered. The<br />
percentages shown for each variable refer to the fraction <strong>of</strong> time<br />
during the penetration that each variable was observed. Thus, it c<strong>an</strong><br />
be seen that large particles (N 5 ) were found in relatively small<br />
regions <strong>of</strong> the cloud compared to the total concentration (N t ), for<br />
which values near 100% indicate that there were almost always some<br />
particles striking the foil impactor during a penetration.<br />
The total number concentrations are lower th<strong>an</strong> those normally<br />
observed in rainfall at the ground. This is also indicated by the<br />
particle size distributions discussed in Section 4.2, which generally<br />
show fewer particles but more large ones th<strong>an</strong> the familiar Marshall-Palmer<br />
distribution would suggest. This may indicate that the processes <strong>of</strong><br />
raindrop breakup <strong>an</strong>d/or evaporation <strong>an</strong>d shedding <strong>of</strong> water by falling<br />
hailstones modify the particle size distributions appreciably before the<br />
precipitation reaches the ground.
IV-7<br />
A close relationship exists between PC <strong>an</strong>d N 5 (the relationship<br />
is more apparent in the plots <strong>of</strong> Fig. 3 th<strong>an</strong> in the values <strong>of</strong> Table 1),<br />
indicating that the large particles contribute most <strong>of</strong> the PC. Thus,<br />
signific<strong>an</strong>t precipitation concentrations are also restricted to smaller.<br />
regions <strong>of</strong> the cloud th<strong>an</strong> N t. The observed precipitation concentrations<br />
are in general agreement with those reported by Schroeder (1973) <strong>an</strong>d<br />
in Texas.5<br />
4. The Raymer storm<br />
All three penetrations <strong>of</strong> the Raymer storm were in part <strong>of</strong> Storm W<br />
described in Part I. Figure 1 shows a contoured sl<strong>an</strong>t r<strong>an</strong>ge PPI display<br />
from the Grover 10-cm radar near the time <strong>an</strong>d altitude <strong>of</strong> Penetration<br />
80-1, with the aircraft flight path superimposed.<br />
Penetration 80-1 was made near the center <strong>of</strong> a newly developing<br />
cell (W5) <strong>an</strong>d along the southeastern edge <strong>of</strong> the high reflectivity region<br />
<strong>of</strong> a more mature cell (w4). Subsequent penetrations, 80-2 <strong>an</strong>d 80-3,<br />
were in Cell W5; however, information from Penetration 80-1 will be<br />
emphasized in this paper because it was the most interesting <strong>an</strong>d the<br />
air space limitations on 9 July prevented traversing the desired regions<br />
on Penetrations 80-2 <strong>an</strong>d 80-3. Even on Penetration 80-1, we were pre-<br />
vented from penetrating the most preferred regions <strong>of</strong> the cloud, which<br />
were along a more north-south or northwest-southeast line that would<br />
intercept both the high reflectivity zone <strong>an</strong>d the updraft region.<br />
5 See S<strong>an</strong> Angelo Cumulus Project <strong>an</strong>nual reports for FY1972 <strong>an</strong>d FY1973<br />
by Meteorology Research, Inc., Altadena, California. Reports prepared<br />
for Texas Water Development Board.
I<br />
IV-8<br />
+ 45 KM E GRO<br />
1723<br />
d30v <strong>an</strong>d<br />
1720/A<br />
7.0 d <strong>an</strong>d<br />
//<br />
.0' \J W4 / \ I0 //<br />
w4 (<br />
CLD<br />
e~ntt at 171J6:37 MPTs The mas I aon tit e utn on n<br />
Fig. J 5&nt' PPI duptaiy nea/t time <strong>an</strong>d atttude <strong>of</strong> Penenation 80-1. The<br />
radat elevation <strong>an</strong>gle <strong>an</strong>d time <strong>of</strong> sc<strong>an</strong> ae 7.0 degrees <strong>an</strong>d 1718:38<br />
MDT, uespectivety. Reftectivity facto' contou arte indicated in dBZ. The<br />
heavy s fine hows the aircrAaf t t w rack ith the large dAot denoting vnua cloaud<br />
entry at 1716: 37 MP7D The ctick marks alon9 the track aee eat even one minute<br />
interuva s. The tihme sca£e on thL <strong>an</strong>d Succeeding figures c<strong>an</strong> be converted<br />
to a diut<strong>an</strong>ce ceae. by noting that caichad t spced u about 6 km min- l .
IV-9<br />
The large dot shown at the beginning <strong>of</strong> the aircraft track in<br />
Fig. 1 corresponds to entry into the visual cloud as seen by the pilot.<br />
The actual entry point <strong>of</strong> the aircraft into the cloud c<strong>an</strong> be seen by<br />
referring to Fig. 1 <strong>of</strong> Part II, where <strong>an</strong> X on the cloud photographs<br />
indicates the point <strong>of</strong> aircraft entry into the cloud.<br />
Figure 2 shows the corresponding vertical section along the flight<br />
path <strong>of</strong> the T-28 for Penetration 80-1, <strong>an</strong>d also the approximate<br />
locations <strong>of</strong> Cells W4 <strong>an</strong>d W5. The reflectivity pattern shows W5 to be<br />
a cell with echo developing al<strong>of</strong>t as part <strong>of</strong> <strong>an</strong> overh<strong>an</strong>g region <strong>an</strong>d<br />
weaker th<strong>an</strong> W4, which is in a more mature stage <strong>of</strong> development.<br />
4.1 Ice-water budget considerations<br />
M<strong>an</strong>y <strong>of</strong> the interesting features revealed by the <strong>an</strong>alysis <strong>of</strong> the<br />
foil data c<strong>an</strong> be seen in Fig. 3, which shows smoothed values <strong>of</strong> vertical<br />
velocity, Nt , N5, PC, <strong>an</strong>d PML as a function <strong>of</strong> time for Penetration 80-1.<br />
The smoothed vertical velocity curve masks the distinction between<br />
Cells Wh <strong>an</strong>d W5, which is clearer in a more detailed presentation <strong>of</strong><br />
data for the initial portion <strong>of</strong> Penetration 80-1 in Fig. 4.<br />
Few actual in-cloud measurements <strong>of</strong> N5 have been reported, but the<br />
values found in this study seem reasonable. The greatest concentrations<br />
<strong>of</strong> large particles (N 5 ) seemed to be at the edges <strong>of</strong> updraft regions<br />
(Fig. 3). Although the foil impactor was not carried on the aircraft<br />
during 1972 operational flights, these observations <strong>of</strong> N5 are in<br />
qualitative agreement with the pilot's observations <strong>of</strong> large particles<br />
during penetrations <strong>of</strong> a storm on 22 July 1972 (Musil et al., 1973).
I<br />
IV-10<br />
/ II I I '/I<br />
~I~~~w<br />
\ / \1 "<br />
LO E ,<br />
I<br />
i I Ii I ! i I i I I I<br />
o c jn<br />
Fig. 2 Compuate generated veticaR section (h<strong>an</strong>d contoared) atong the track<br />
od Penetration 80-1. The dashed line Thows the aiurcafLt tiaci <strong>an</strong>d<br />
treectivity f acdto caontours cLe indicated Lin dBZ. Cell W4 is in thei mawte<br />
stage wAhe. W5 has a recently developed echo al<strong>of</strong>t.
IV-11<br />
· 2 - r I I II<br />
VERTICAL VELOCITY (m/sec)<br />
10<br />
W° 5 W4 \ / 400<br />
TOTAL PARTICLE CONCENTRATION (/m 3 )<br />
-10 - A.<br />
/."'. __ . ,^i^, _200-<br />
12 -4o I c1 I - C-- -<br />
6 /<br />
CONC. PARTICLES >5mm(/m 3 )<br />
tN\ J/<br />
PRECIP CONCENTRATION (g/m 3 )<br />
' I V I i^-t 1- 1 1 100<br />
PERCENT MASS LIQUID<br />
50-<br />
|! | \ 1 / I I I 0\<br />
1716 17 17 1718 1719 1720 1721 1722 1723<br />
IN TIME-(Minutes)<br />
CLD<br />
Fig. 3 Ptot6 o04 moothed veticat veaocityj, totat concenutution o6 patictu,<br />
concetut1to1 1n ao patric h geh -th<strong>an</strong> 5 mm, pMtcepiLtatorn 2-<br />
concen2t<br />
tion, <strong>an</strong>d percent mass liquid fot Penetwon 80-1. PenetLtiron was made at <strong>an</strong><br />
avetage a&tjtude <strong>of</strong> 7.2 kmn, wdich coraesponds to a atempeatuae. o about -12C.<br />
The7 distinction btwQeen CelQ W4 <strong>an</strong>d W5 LU apparent in the moe detaled veAtica<br />
veRlocity cwuve in Fig. 4.
IV-12<br />
~,~_ VERTICAL VELOCITY-(m sec)<br />
o__ 0<br />
(D<br />
O o0<br />
^ -II-4~~~~~~~~~~~~~~~~~~~~~~I<br />
__ i z ~~~~~~~i<br />
iMDt<br />
. .'" .<br />
''-LGT<br />
---- _/ '"^ lHVY '<br />
eI S PC & LWC .(gm 3 )<br />
m- cn (PC), wnd w kt<br />
' 3 /S : ! ·<br />
· ·<br />
rr o 0 HVY<br />
C F-<br />
whee pa the ce ze d bton hwn - ~~~~~0 ----F. weQ d ned. I<br />
PC a LWC -(gmi<br />
£ Fig. 4 sg. Ve&caQ Vvetica. veoc,, velocity, c cloud .oud £-qwud liquid water ScatVL concent.tat concentration (L(C), (LWC), phQC4(- precipi-<br />
·t..ton concen.tAation (PC, Roemount 'iic.q .ate activity, <strong>an</strong>d (aircaft<br />
(ihcg observations by. the p£o^t for about the Ihfdt hafi <strong>of</strong> PInentrIon<br />
The vettical<br />
80- .<br />
velocities<br />
£n FeLg.<br />
are<br />
3.<br />
uynsmoothzed<br />
The. Zette<br />
<strong>an</strong>d theArore<br />
atcng ;the.<br />
differ<br />
tme<br />
from<br />
axg<br />
those<br />
Wgate<br />
shown<br />
rn Fig. 3. The !&ttw> along .the time axis indicate the hQepeCVtegeonz te~pective<br />
whnhe<br />
regiegons<br />
nte p<strong>an</strong>ticle size dustAAibutions shown tn Fig. 5 were determined.<br />
- 3 )
IV-13<br />
The close relationship between PC <strong>an</strong>d N 5 that was mentioned<br />
previously is very apparent in Fig. 3. The largest value <strong>of</strong> PC, when<br />
N 5 = 0 was only about 0.3 g m-3; when larger values <strong>of</strong> PC were encoun-<br />
tered, m<strong>an</strong>y <strong>of</strong> the particles were larger th<strong>an</strong> 5 mm in diameter <strong>an</strong>d<br />
therefore presumably in the form <strong>of</strong> graupel or hail.<br />
Multiple updraft regions were encountered during this penetration<br />
<strong>an</strong>d the highest values <strong>of</strong> PC straddled the interface between the updraft<br />
<strong>an</strong>d downdraft region <strong>of</strong> Cell W4. Multiple updrafts were previously<br />
reported by Musil et al. (1973). Downdrafts encountered were generally<br />
weak with some penetrations having virtually no downdrafts.<br />
Analysis <strong>of</strong> the foil data revealed that most <strong>of</strong> the precipitation<br />
size particles encountered in all <strong>of</strong> the penetrations were composed <strong>of</strong><br />
ice or some combination <strong>of</strong> ice <strong>an</strong>d water. It was impossible to deter-<br />
mine the proportions <strong>of</strong> ice <strong>an</strong>d water in the combination particles so,<br />
as noted in Section 2, they were taken to be ice particles for purposes<br />
<strong>of</strong> <strong>an</strong>alysis. The proportion <strong>of</strong> the precipitation mass that was entirely<br />
liquid is shown for this penetration in Fig. 3. In general, the updrafts<br />
in the developing cells had signific<strong>an</strong>t amounts <strong>of</strong> liquid <strong>an</strong>d the<br />
percent <strong>of</strong> the mass that was liquid depended to a certain degree upon<br />
the temperature at which the penetration was made; i.e., more ice was<br />
found at colder temperatures. Very little liquid precipitation was<br />
found in the regions where we observed signific<strong>an</strong>t numbers <strong>of</strong> large<br />
particles (N 5 ), which should fall in our "ice" category because liquid<br />
drops <strong>of</strong> such size are unstable.
IV-14<br />
Terminal velocities (McDonald, 1960) calculated for the particles<br />
observed in <strong>an</strong>y <strong>of</strong> the penetrations on 9 July showed that most <strong>of</strong> the<br />
mass encountered was falling relative to the ground. Thus, in regions<br />
<strong>of</strong> high ice concentrations most <strong>of</strong> the particles came from regions.<br />
higher <strong>an</strong>d colder th<strong>an</strong> the penetration level, where the mass would<br />
most likely be in the form <strong>of</strong> ice.<br />
The presence <strong>of</strong> liquid in the updraft is shown in greater detail<br />
for a portion <strong>of</strong> Penetration 80-1 in Fig. 4. The vertical velocities<br />
shown are those actually measured by the T-28 during the penetration<br />
<strong>an</strong>d are therefore somewhat different from the smoothed values shown<br />
in Fig. 3.<br />
The double structure <strong>of</strong> the updraft is associated with the two<br />
cells (W4 <strong>an</strong>d W5) shown in Figs. 1 <strong>an</strong>d 2. The strong updraft indicated<br />
just after cloud entry is associated with W5, while the second updraft<br />
maximum is part <strong>of</strong> W4. The large horizontal extent <strong>of</strong> the updraft<br />
measurements shows the updrafts <strong>of</strong> the two cells to be joined, at<br />
least at T-28 flight level.<br />
It c<strong>an</strong> be seen in Fig. 4 that the updrafts associated with Cells<br />
W4 <strong>an</strong>d W5 are characterized by relatively high cloud liquid-water<br />
concentrations, as indicated by a Johnson-Williams sensor; however, it<br />
is obvious that the highest values are in the younger cell (W5). This<br />
suggests that the large ice particles in W4 are in the process <strong>of</strong><br />
depleting the available cloud water. This is especially evident in the<br />
downdraft region <strong>of</strong> W4, where nearly all evidence <strong>of</strong> liquid particles
IV-15<br />
disappears. The large ice particles found on the edge <strong>of</strong> the updraft<br />
associated with w4 are in agreement with past T-28 observations (Musil<br />
et aL., 1973).<br />
The Johnson-Williams device senses liquid particles smaller th<strong>an</strong><br />
50 i which is well below the threshold to which the foil impactor<br />
responds. Furthermore, there is evidence <strong>of</strong> the presence <strong>of</strong> water<br />
in liquid form from the pilot's comments about aircraft structural<br />
icing <strong>an</strong>d indications from a Rosemount icing rate probe. This com-<br />
bination <strong>of</strong> observations almost always indicated the presence <strong>of</strong><br />
subst<strong>an</strong>tial, but unknown, numbers <strong>of</strong> liquid particles in the updrafts<br />
<strong>of</strong>ten at rather cold temperatures (e.g., near -12C in this case).<br />
These observations are somewhat qualitative, but do provide strong<br />
supporting evidence <strong>of</strong> the presence <strong>of</strong> liquid precipitation particles<br />
in the updraft.<br />
About one-third <strong>of</strong> the PC in the updraft for W5 was in the form<br />
<strong>of</strong> liquid precipitation-size particles (see PML values in Fig. 3) <strong>an</strong>d<br />
part <strong>of</strong> the liquid was in the form <strong>of</strong> cloud droplets as indicated by<br />
the Johnson-Williams readings. An unknown amount <strong>of</strong> liquid may have<br />
been present in the intermediate size r<strong>an</strong>ge between about 50 <strong>an</strong>d 250 v,<br />
We know only in a very rough sense how liquid particles in different<br />
size regions contribute to aircraft icing or the behavior <strong>of</strong> the<br />
Rosemount icing rate device, which c<strong>an</strong>not give accurate qu<strong>an</strong>titative<br />
values in regions <strong>of</strong> high liquid water concentration (Musil <strong>an</strong>d S<strong>an</strong>d,<br />
1974). Thus, we c<strong>an</strong>not interrelate all <strong>of</strong> the observations shown in-
IV-16<br />
Figs. 3 <strong>an</strong>d 4 in complete detail, but the available evidence shows that<br />
the updraft regions associated with the developing cell (W5) had<br />
subst<strong>an</strong>tially greater qu<strong>an</strong>tities <strong>of</strong> liquid th<strong>an</strong> the updraft associated<br />
with the mature cell (W4). This suggests that the coalescence process<br />
is import<strong>an</strong>t in the formation <strong>an</strong>d growth <strong>of</strong> precipitation in this<br />
storm.<br />
The presence <strong>of</strong> ice is probably a function <strong>of</strong> updraft strength<br />
<strong>an</strong>d cloud temperature. Since the clouds in this study were part <strong>of</strong><br />
a multicell system, we should expect to find subst<strong>an</strong>tial amounts <strong>of</strong><br />
ice in all regions <strong>of</strong> the cloud except the areas <strong>of</strong> new development<br />
indicated by the strong, fresh updrafts (i.e., W5). According to<br />
current theories <strong>of</strong> hail suppression, seeding should take place in<br />
newly developing cells where large qu<strong>an</strong>tities <strong>of</strong> supercooled water<br />
are found.<br />
4.2 Particle size distributions<br />
Particle size distributions (Fig. 5) were prepared from foil<br />
impactor observations for points indicated in Fig. 4 during Penetration<br />
80-1. The small graph at the top <strong>of</strong> each distribution shows the per-<br />
centage <strong>of</strong> the precipitation particles in each size interval that was<br />
determined to be in liquid form. The approximate sampling volumes for<br />
these particle size distributions r<strong>an</strong>ged between 2 <strong>an</strong>d 8 m 3 .<br />
Figure 5a shows a size distribution near the point <strong>of</strong> entry into<br />
the cloud (Cell W5) where roughly half <strong>of</strong> the particles (but only a
IV-17<br />
,t 714 9 ,, o<br />
7,_MDMOT<br />
Mo7<br />
n734 OT ,<br />
719 ; , .M0... i,' 'O 4 T 0 MT ! ,1<br />
s 025<br />
02<br />
1 , i"^a ,5 l-o _<br />
*2 * : . . . ... . .<br />
1<br />
I I ' I I I I<br />
]l, , ~v~'~ J/~ A ' ,5 ~:: O lL/~:.: J ; :<br />
I<br />
' . . .<br />
- -. '~IC<br />
M-P<br />
IDAMETER--(mm) DIAMETER-10m) DIAMETER-omm) 10 DIAMETER-Im.)<br />
(a) (b) (c) (d)<br />
718 20 M<br />
6 T<br />
10<br />
1718 56 M T<br />
_ , ___<br />
_ _ _ _ _ _ 171926 MOT , 171956 M OT<br />
75<br />
50 -<br />
g75- 0<br />
o<br />
075<br />
5O<br />
Q75<br />
250o<br />
7 5, . . :<br />
TT<br />
I*<br />
0<br />
10*-* 5 ·<br />
-lO*- -10* 75 -a -.- K)*- ..<br />
1<br />
7110<br />
22<br />
.<br />
'<br />
7<br />
1. ' \'I<br />
1 0<br />
10% 710 * DI T ( m)<br />
*e ' e<br />
I050 . ^ ' '''!'''',^1<br />
1 0'<br />
I I I<br />
0<br />
DIAMETER-(mm)DIAMETER<br />
" 0 o J<br />
- (mm)<br />
to '" 0 O 5<br />
DIAMETER -(mm)r<br />
10 11<br />
O 43 5<br />
AMETER-omm)<br />
(e) (f) (g) (h)<br />
:
IV-18<br />
Fig. 5 Particte size distibutions in the egitons shown in Fig. 4. Appropreiateime<br />
a re indicated on each diagram. The uppet portion oa<br />
each diagam rndicatue the peAcentage od the pacticezs in each size cateQgoy<br />
that we. widentified as atL liquid. DiVtibuti ona heptesent the foalowuing<br />
conditions:<br />
a - Edge od updafdt oa developing cett (W5).<br />
b - In;tetiot o5 updraft <strong>of</strong> devetoping cel U, high PC.<br />
c - Intunmeditate updtrat region, high PC.<br />
d - Edge oa updcadt od matuwe cee (W4), high PC.<br />
e - Weak downdtadt (2 m<br />
- l 1 ) oa matuAe ce.Q (W4).<br />
d - Strong downdtaft (8 m s -1 ) od matuAe celt.<br />
g - Interhioh <strong>of</strong> secondaty updtaft.<br />
h - Secondaty downdAa4t.<br />
Uneu in Fig. 5d show Mauthal-PatmeA (M-P) <strong>an</strong>d Dougeas (D)<br />
size distrbution<br />
uncetions cortehsponding to the precipitation concentration do pactices smattle<br />
<strong>an</strong>d lahge.t th<strong>an</strong> 5 mm, tespectively.
IV-19<br />
third <strong>of</strong> the mass) were identified as liquid. The presence <strong>of</strong> the<br />
rather large liquid particles at the beginning <strong>of</strong> the penetration is<br />
probably due to coalescence growth simply because there appears to be<br />
no mech<strong>an</strong>ism for tr<strong>an</strong>sfer <strong>of</strong> particles between cells in this multicell<br />
storm (discussed further in Part V). Furthermore, hailstone growth<br />
models (Dennis <strong>an</strong>d Musil, 1973), which allow coalescence growth <strong>of</strong><br />
liquid particles as part <strong>of</strong> the hailstone growth mech<strong>an</strong>ism, show<br />
similar sizes developing in approximately 10 min, the same amount <strong>of</strong><br />
time that was observed in the Raymer storm for cloud turrets to grow<br />
<strong>an</strong>d produce first echoes (Part I).<br />
As the aircraft passed through the main updraft region into<br />
Cell W4 <strong>an</strong>d encountered higher precipitation concentrations, the<br />
fraction <strong>of</strong> liquid particles decreased (Figs. 5b - d). In fact, with<br />
the exception <strong>of</strong> the large liquid particles found in the updraft region<br />
<strong>of</strong> the developing Cell W5 (Figs. 5a, 5b), the large particles encoun-<br />
tered were predomin<strong>an</strong>tly ice. The number <strong>of</strong> rather large liquid<br />
particles found at this cold temperature (-12°C) contrasts with the<br />
observations <strong>of</strong> Knight et al. (1974), but the findings agree with the<br />
pilot who observed particles impacting <strong>an</strong>d sticking to the windshield<br />
leading him to judge them to be liquid. High concentrations <strong>of</strong><br />
particles larger th<strong>an</strong> 5 mm occurred in regions <strong>of</strong> high PC (with the<br />
exception <strong>of</strong> Fig. 5g).
IV-20<br />
The observed size distributions are approximately exponential 6 in<br />
the small diameter region, but the Marshall-Palmer intercept value <strong>of</strong><br />
8 x 10 3 m 3 mm - (indicated in Fig. 5d) is well above the intercept<br />
for <strong>an</strong>y reasonable best-fit line to the actual data. Thus, the present.<br />
size distributions indicate fewer, but larger, particles th<strong>an</strong> the<br />
Marshall-Palmer function for the same rainwater concentrations. One<br />
<strong>of</strong> these functions is shown in Fig. 5d for comparison; the M-P line<br />
shows the Marshall-Palmer raindrop size distribution function calculated<br />
for a precipitation concentration equal to that observed for all<br />
particles up to 5 mn. In addition to the disagreement in the intercept<br />
value, the fit also becomes poor for particles larger th<strong>an</strong> 2 to 3 mm.<br />
The distributions <strong>of</strong> the large particles (when present) c<strong>an</strong> also<br />
be represented fairly well by exponential functions. However, the<br />
slopes differ from those <strong>of</strong> the lines appropriate for the smaller<br />
particles. Figure 5d also shows a Douglas (1964) hailstone size<br />
distribution function computed for the precipitation concentration in<br />
all particles larger th<strong>an</strong> 5 mm in diameter; Federer <strong>an</strong>d Waldvogel (1975)<br />
used a similar approach to fit their simult<strong>an</strong>eous observations <strong>of</strong> size<br />
distributions for both rain <strong>an</strong>d hail. The slope <strong>of</strong> the Douglas line<br />
seems reasonable, but the intercept is obviously too low. Examination<br />
<strong>of</strong> Figs. 5a - 5f suggests that better agreement might be obtained by<br />
taking the dividing point between the "small" <strong>an</strong>d "large" particle<br />
6 Exponential functions plot as straight lines on the semi-logarithmic<br />
scales used in Fig. 5.
IV-21<br />
regions somewhere in the r<strong>an</strong>ge 2 - 3 mm instead <strong>of</strong> at 5 mm. That might<br />
provide a reasonably good bi-exponential fit to the observations<br />
throughout the size spectrum.<br />
In general, the observed particle size distributions c<strong>an</strong> be<br />
approximated by one or two exponential functions. The intercept<br />
parameters for the small particle lines were always considerably<br />
smaller th<strong>an</strong> the Marshall-Palmer values, while the large particle<br />
lines were in general conformity with the Douglas distribution.<br />
Further <strong>an</strong>alysis <strong>of</strong> these size distributions now in progress will<br />
provide a more complete comparison with previously developed size<br />
distribution functions.<br />
5. Summary <strong>an</strong>d conclusions<br />
The observed precipitation particle concentrations were generally<br />
similar to those reported by other investigators <strong>of</strong> cumulus clouds,<br />
but smaller th<strong>an</strong> those commonly observed in rainfall at the ground.<br />
The characteristics <strong>of</strong> the particle distributions show a great deal<br />
<strong>of</strong> variation, <strong>an</strong>d our data cover a short period <strong>of</strong> the storm's life<br />
history, making it difficult to infer. a detailed ice-water budget.<br />
Most <strong>of</strong> the particles in the <strong>an</strong>alysis were identified as ice particles,<br />
or particles containing both ice <strong>an</strong>d water.<br />
At first gl<strong>an</strong>ce, such a predomin<strong>an</strong>ce <strong>of</strong> ice might have strong<br />
implications for cloud seeding for hail suppression because most <strong>of</strong><br />
the precipitation encountered during the penetrations was falling<br />
relative to the ground <strong>an</strong>d was composed <strong>of</strong> ice or ice-liquid
IV-22<br />
combinations. On the other h<strong>an</strong>d, the updraft regions, especially those<br />
associated with newly developing cells, had subst<strong>an</strong>tial percentages <strong>of</strong><br />
liquid particles which were <strong>of</strong>ten rising relative to the ground.<br />
Because <strong>of</strong> the presence <strong>of</strong> supercooled particles, these portions <strong>of</strong> the<br />
storms appear to be seedable, especially when one considers that sub-<br />
st<strong>an</strong>tial amounts <strong>of</strong> liquid were found at temperatures as cold as -12C.<br />
The large amounts <strong>of</strong> ice found in part <strong>of</strong> this particular storm, which<br />
was unseeded, are a function <strong>of</strong> stage <strong>of</strong> development <strong>of</strong> the particular<br />
cell penetrated.<br />
The particle size distributions were roughly exponential (or<br />
bi-exponential when large particles were present), but they showed<br />
fewer small particles <strong>an</strong>d more large ones th<strong>an</strong> the Marshall-Palmer<br />
raindrop size distributions would indicate. Sampling volume corrections<br />
need to be developed for the larger particles, but errors due to<br />
sampling volume considerations are unlikely to exceed a factor <strong>of</strong> two<br />
even in extreme cases.<br />
The <strong>an</strong>alysis <strong>of</strong> foil impactor data is extremely tedious <strong>an</strong>d time<br />
consuming but it appears to provide useful information on precipitation<br />
size particles within hailstorms. The observations reported here should<br />
help to increase the underst<strong>an</strong>ding <strong>of</strong> precipitation processes in hail-<br />
storms <strong>an</strong>d should aid in the development <strong>of</strong> numerical hailstorm models.<br />
Development should continue on devices that c<strong>an</strong> automatically count <strong>an</strong>d<br />
size particles over the entire size r<strong>an</strong>ge as well as provide a capability<br />
to distinguish liquid from solid particles, thereby providing more<br />
information on the ice-water budgets <strong>of</strong> storms.
IV-23<br />
REFERENCES<br />
Bethwaite, F. D., E. J. Smith, J. A. Warburton, <strong>an</strong>d K. J. Heffer<strong>an</strong>,<br />
1966: Effects <strong>of</strong> seeding isolated cumulus clouds with silver<br />
iodide. J. Appl. Meteor., 5, 513-520.<br />
Brown, E. N., 1958: A technique for measuring precipitation particles<br />
from aircraft. J. Meteor., 15, 462-466.<br />
Cat<strong>an</strong>eo, R., <strong>an</strong>d G. E. Stout, 1968: Raindrop size distributions in<br />
humid continental climates, <strong>an</strong>d associated rainfall rate-radar<br />
reflectivity relationships.J Appl. Meteor., 7, 901-907.<br />
Cornford, S. G., 1966: A note on some measurement from aircraft <strong>of</strong><br />
precipitation within frontal clouds. Quart. J. Roy. Meteor. Soc,,<br />
92, 105-113.<br />
Dennis, A. S., <strong>an</strong>d D. J. Musil, 1973: Calculations <strong>of</strong> hailstone growth<br />
<strong>an</strong>d trajectories in a simple cloud model. J. Atmos. Sci., 30,<br />
278-288.<br />
Douglas, R. H., 1964: Hail size distribution. Proc. 1974 World Conf.<br />
Radio Meteor. <strong>an</strong>d llth Wea. Radar Conf., Boston, Amer. Meteor. Soc.,<br />
147-149.<br />
Federer, B., <strong>an</strong>d A. Waldvogel, 1975: Hail <strong>an</strong>d raindrop size distributions<br />
from a Swiss multicell storm. J. Appl. Meteor., 15, 91-97.<br />
Joss, J., <strong>an</strong>d A. Waldvogel, 1969: Raindrop size distribution <strong>an</strong>d<br />
sampling size errors. J. Atmos. Sci., 26, 566-569.<br />
Knight, C. A., H. C. Knight, J. E. Dye, <strong>an</strong>d V. Toutenho<strong>of</strong>d, 1974: The<br />
mech<strong>an</strong>ism <strong>of</strong> precipitation formation in northeastern Colorado
IV-24<br />
cumulus. I. Observations <strong>of</strong> the precipitation itself. J. Atmos.<br />
Sci., 31, 2142-2147.<br />
May, E. L., 1974: Analysis <strong>of</strong> foil impactor data from armored aircraft<br />
penetrations <strong>of</strong> hailstorms. Report 74-9, Institute <strong>of</strong> Atmospheric<br />
Sciences, South Dakota School <strong>of</strong> Mines <strong>an</strong>d Technology, Rapid City,<br />
South Dakota. 59 pp.<br />
McDonald, J. E., 1960: An aid to the computation <strong>of</strong> terminal fall<br />
velocities <strong>of</strong> spheres. J. Meteor., 17, 463-465.<br />
Miller, A. H., P. B. MacCready, Jr., <strong>an</strong>d D. M. Takeuchi, 1967: Cloud<br />
physics observations in South Dakota cumulus clouds. Prepared<br />
for the Institute <strong>of</strong> Atmospheric Sciences by Meteorology Research,<br />
Inc., Altadena, California. 59 pp.<br />
Musil, D. J., <strong>an</strong>d W. R. S<strong>an</strong>d, 1974: Use <strong>of</strong> the Rosemount icing rate<br />
probe in thunderstorm penetrations. Atmospheric Technology,<br />
National Center for Atmospheric Research, Winter 1974-75, 140-142.<br />
___ , ______, <strong>an</strong>d R. A. Schleusener, 1973: Analysis <strong>of</strong> data from<br />
T-28 aircraft penetrations <strong>of</strong> a Colorado hailstorm J. Apl-<br />
Meteor., 12, 1364-1370.<br />
S<strong>an</strong>d, W. R., <strong>an</strong>d R. A. Schleusener, 1974: Development <strong>of</strong> <strong>an</strong> armored<br />
T-28 aircraft for probing hailstorms. Bull. Amer. Meteor. Soc.,<br />
55, 1115-1122.<br />
Schecter, R. M., <strong>an</strong>d R. G. Russ, 1970: The relationship between imprint<br />
size <strong>an</strong>d drop diameter from <strong>an</strong> airborne drop sampler. J. Appl.<br />
Meteor., 9, 123-126.
IV-25<br />
Schroeder, M. J., 1973: Cloud droplet <strong>an</strong>d raindrop observations in<br />
cumulus clouds. Report 73-15, Institute <strong>of</strong> Atmospheric Sciences,<br />
South Dakota School <strong>of</strong> Mines <strong>an</strong>d Technology, Rapid City, South<br />
Dakota, 38 pp.<br />
Waldvogel, A., 1974: The N jump <strong>of</strong> raindrop spectra. J. Atmos. Sci.,<br />
31, 1067-1078.
<strong>Structure</strong> <strong>of</strong> <strong>an</strong> <strong>Evolving</strong> <strong>Hailstorm</strong>. Part V:<br />
Synthesis <strong>an</strong>d Implications for Hail Growth <strong>an</strong>d Hail Suppression<br />
by<br />
K. A. Browning 1 , J. C. F<strong>an</strong>khauser, J.-P. Chalon 2 <strong>an</strong>d P. J. Eccles<br />
National Center for Atmospheric Research 3 , Boulder, Colorado<br />
R. G. Strauch <strong>an</strong>d F. H. Merrem<br />
NOAA/ERL/Wave Propagation Laboratory, Boulder, Colorado<br />
D. J. Musil, E. L. May <strong>an</strong>d W. R. S<strong>an</strong>d<br />
Institute <strong>of</strong> Atmospheric Sciences, South Dakota School<br />
<strong>of</strong> Mines <strong>an</strong>d Technology, Rapid City, South Dakota<br />
On leave from the Meteorological Office Research Unit, Royal Radar Establishment,<br />
Malvern, Engl<strong>an</strong>d.<br />
2 0n. leave from Meteorologie Nationale, Fr<strong>an</strong>ce, on a fellowship from the Delegation<br />
Generale a la Recherche Scientifique et Technique.<br />
3 This research was performed as part <strong>of</strong> the National Hail Research Experiment,<br />
m<strong>an</strong>aged by the National Center for Atmospheric Research <strong>an</strong>d sponsored by the<br />
Weather Modification Program, Research Applications Directorate, National<br />
Science Foundation.
ABSTRACT<br />
A model <strong>of</strong> <strong>an</strong> evolving hailstorm is synthesized from data presented in<br />
four related papers in this issue. The storm model, which is applicable to<br />
a class <strong>of</strong> ordinary multicell hailstorms <strong>an</strong>d similar to earlier models derived<br />
by workers in South Dakota <strong>an</strong>d Alberta, is discussed in terms <strong>of</strong> the growth<br />
<strong>of</strong> hail <strong>an</strong>d its implications for hail suppression. Hail is grown in time-<br />
evolving updrafts that begin as discrete new clouds on the fl<strong>an</strong>k <strong>of</strong> the storm.<br />
Low concentrations <strong>of</strong> embryos develop rapidly within each <strong>of</strong> these clouds.<br />
The embryos subsequently grow into small hailstones while suspended near or<br />
above the -20°C level as each new cloud grows <strong>an</strong>d becomes the main updraft.<br />
Recycling is not a feature <strong>of</strong> this model as it is in supercell models. To<br />
improve the ch<strong>an</strong>ce for silver iodide seeding being effective in suppressing<br />
the growth <strong>of</strong> hail in multicell storms, it is proposed that the seeding should<br />
be carried out not in the main updraft as is <strong>of</strong>ten the practice, but, rather,<br />
in the regions <strong>of</strong> weaker updraft associated with the early stages <strong>of</strong> developing<br />
clouds on the fl<strong>an</strong>k <strong>of</strong> the storm.
v-i<br />
1. Introduction: the ordinary multicell storm as a distinct hailstorm type<br />
Several categories <strong>of</strong> hailstorms have recently been proposed.(Marwitz,<br />
1972 a, b, c; Chisholm <strong>an</strong>d Renick, 1972).. According to Browning (1975), one.<br />
<strong>of</strong> the most import<strong>an</strong>t distinctions is between ordinary multicell storms <strong>an</strong>d<br />
supercell storms. The essential difference between these two types is that,<br />
whereas a supercell storm is dominated by a single cell which attains a<br />
quasi-steady structure with updrafts <strong>an</strong>d downdrafts coexisting symbiotically<br />
for long periods, <strong>an</strong> ordinary multicell storm consists <strong>of</strong> a sequence <strong>of</strong><br />
evolving cells each <strong>of</strong> which may go through a life-cycle resembling that first<br />
described in the Thunderstorm Project (Byers <strong>an</strong>d Braham, 1949). Both kinds<br />
<strong>of</strong> storms c<strong>an</strong> produce damaging hail <strong>an</strong>d, although the biggest <strong>an</strong>d most damaging<br />
hailstorms tend to be supercells, the majority <strong>of</strong> hailstorms in the North<br />
Americ<strong>an</strong> continent appear to be <strong>of</strong> the ordinary multicell variety.<br />
Each new updraft cell in <strong>an</strong> ordinary multicell storm is seen first as a<br />
discrete new growing cumulus cloud. During Project Hailswath (Goyer et al,<br />
1966) these became known as feeder clouds. This term c<strong>an</strong> be misleading when<br />
applied to ordinary multicell storms in the sense that the clouds do not feed<br />
the mature hail cloud but, rather, grow <strong>an</strong>d become the mature hail cloud.<br />
Therefore, we refer to them instead as daughter clouds. Such clouds have been<br />
discussed by Dennis, et al (1970) <strong>an</strong>d Musil (1970). They consider them to be<br />
one <strong>of</strong> the most striking visual phenomena associated with Great Plains thunder-<br />
storms. They find that the daughter clouds begin forming at dist<strong>an</strong>ces up to<br />
30 km away from the hailstorm core. Each cloud grows rapidly as it approaches<br />
<strong>an</strong>d merges with the main cumulonimbus cloud mass. For <strong>an</strong> eastward-moving storm<br />
the merger usually takes place on the southwestern side <strong>of</strong> the main cloud mass<br />
<strong>an</strong>d occurs 15-40 min after the initial formation <strong>of</strong> the daughter cloud. As
V-2<br />
shown in Fig. 1, a first radar echo usually appears in a daughter cloud just<br />
before it merges fully with the main cloud mass. A burst <strong>of</strong> heavy rain or<br />
hail usually reaches the ground soon after the merger. The evolution <strong>of</strong> the<br />
individual areas <strong>of</strong> heavier precipitation associated with successive cells<br />
has been studied by Renick (1971). He shows that the individual cells may<br />
produce hail for periods <strong>of</strong> up to 30 min. At the surface this gives rise to<br />
families <strong>of</strong> what Ch<strong>an</strong>gnon (1970) refers to as hailstreaks. Since the new cells<br />
usually form on the right fl<strong>an</strong>k, the storm as a whole propagates discretely<br />
to the right <strong>of</strong> the cell motion (Browning, 1962; Renick, 1971; Marwitz, 1972b).<br />
The purpose <strong>of</strong> this paper is to present a model <strong>of</strong> the storm that gave<br />
hail in the vicinity <strong>of</strong> Raymer, Colorado, on 9 July 1973, synthesized from<br />
data in Parts I through IV. As we shall show, the model conforms in m<strong>an</strong>y<br />
ways to the above description <strong>of</strong> ordinary multicell storms. Of course, this<br />
is not to say that all such storms c<strong>an</strong> be expected to fit this model. The<br />
maximum temperature excess in the updraft, assuming unmixed parcel ascent, was<br />
5 C; the me<strong>an</strong> wind shear in the layer from cloud base to cloud top (650-150 mb)<br />
3 1. -1<br />
was about 2 x 10 s ; <strong>an</strong>d the me<strong>an</strong> wind in the subcloud layer was 8 m s<br />
According to Marwitz (1972b) these values are characteristic <strong>of</strong> the environment<br />
<strong>of</strong> multicell hailstorms. In terms <strong>of</strong> the updraft intensity, the frequency <strong>of</strong><br />
development <strong>of</strong> new cells <strong>an</strong>d the resulting hail size, the Raymer hailstorm c<strong>an</strong><br />
be categorized as being <strong>of</strong> moderate intensity.<br />
2. Model <strong>of</strong> the Raymer hailstorm<br />
Figures 2 <strong>an</strong>d 3 are simplified representations <strong>of</strong> the Raymer storm, each<br />
depicting a vertical section along the storm's direction <strong>of</strong> travel (approximately<br />
north to south). The former figure is highly schematic; the latter is rather<br />
more realistic.
km t<br />
5-<br />
40\<br />
V-3<br />
FIRST<br />
ECHO<br />
DAUGHTER<br />
CLOUDS<br />
0 10 20 30<br />
+-NE DISTANCE km SW--.<br />
Fig. 1 Schematic diagqam showing <strong>an</strong> ENE-WSW cJos section thdrough a typicaL<br />
haittonrm oa wueteAn South Dakota (adapted Lom Denn'i, et at, 1'970).<br />
'II<br />
STORM M*OT ' WIINDS<br />
RELATIVE TO<br />
-""" STORM<br />
Fig. 2 Schenatic dagam 4howLng ;h the coniguwratlon o tze upd4aft n ithe<br />
RaymeA haiLstocrm inratin eat too the ewinviLot<strong>an</strong>i r ae t tow. (St'ric~ty<br />
th updat Zi was the forunm o a chain oa c<strong>an</strong>tiguous updJraf4t elements cith<br />
cently ing ay ona g the aVaLw ahoawn in the figuwe. )
V-4<br />
14 THE RAYMER HAILSTORM 14<br />
12 |-______.~~~~ ~9 __--~<br />
JULY 1973<br />
12 - - -<br />
:<br />
(iPLANEo ,::. -: l .:::- . -i::i:i :-:<br />
.- (/A'ro ^cf/U:;^,^^!<br />
i:':::'-::::<br />
, ^^^H^^®^^^^^'"^^^^ STORM<br />
; :: =================================<br />
: ..::!i::ii::~!:.i!:':~i::~; ::i MOTION -40'<br />
810 27,C1 'E R :::::. i NG!.:::- * .*.. * ":7 .:Ii· E27C ! . i:'~i::;: 10<br />
W . .<br />
........ : .-..<br />
................ \ ,<br />
50 mm/hr SURFACE RAINFALL RATE,R mm/hr 50<br />
-18 -16 -14 -12 -10 -8 -6 -4 -2 , 2 4 6<br />
DISTANCE AHEAD OF OUTFLOW BOUNDARY km<br />
,2C ------ N .20 ms- 1<br />
10 . .T0<br />
PA1 6.1,--<br />
",,<br />
""/"" \D\ VERTICAL mA<br />
0<br />
0E.<br />
VE L<br />
2__--" \ ^/WATER CONTENT FOR<br />
.... _. .. -H.EL<br />
CLOUD DROPLETS C. < 50um DIAM<br />
;. o.....·..... - .." ... .R · -y SURF WA WATER I CONTENT<br />
L TER FOR<br />
Fig* 3 Schematic model (top) <strong>of</strong> the Raymet H~isto showing ~ a vHical<br />
sectio cton n aong along -the. the storm's ton' -e.quen d-e.ctson ditection o <strong>of</strong> travel tave. through though a6 a sequence e.<br />
<strong>of</strong> evolving cee.s. Solid tine are tereamtine.s od tlow neutive to the moving<br />
Zystem; hey ae h hn bkn boket onthey on side the. igue. to rneptreent<br />
-into<br />
t<br />
<strong>an</strong>d<br />
ftow<br />
out o6 the pl<strong>an</strong>e <strong>an</strong>d on the right side od the. iguwLe to /e.pr e.Lnt<br />
tQow remain.ng uw.i hin a pl<strong>an</strong>e a few kitometeus ctoseA to the teader. The<br />
cAtes<br />
open<br />
reprteent -the traje.ctoy. od a haitone. daing it growth rLom<br />
dropLet<br />
a smatl<br />
at csoud base. (e e. text). (Actaaqy the acirAow in each<br />
dtwn<br />
ceU. has<br />
teatie.<br />
been<br />
v to the. ndivrdua. c.eU <strong>an</strong>d, since the developing CeRls n+l <strong>an</strong>d<br />
n .trave.ed more seowty (5 m s- ) th<strong>an</strong> eitheA the matuwre cetls (7 m 4-1)<br />
stomwn<br />
or the<br />
a6 a whole (10 m s-1), the. te.amines in the young ceQls would have had<br />
a trLongeA component from the. outh e.&ative to the.<br />
expains<br />
tomu<br />
why<br />
as a<br />
Ln<br />
whole.<br />
the model<br />
This<br />
the traje.ctoty <strong>of</strong> the growing haistone ctOses OVe.V<br />
-the. streamrnines dwuing i& e.aLty g-rowth a shown in -the. iguwe. ) Lightly<br />
,tippe.d shading tepresents the extent <strong>of</strong> cloud <strong>an</strong>d the thLree datker<br />
od<br />
grades<br />
stippsed shading e.pes en-t rada refle.ctivitie <strong>of</strong> 35, 45 <strong>an</strong>d 50 dBZ.<br />
teJmpeatue.e<br />
The<br />
JcaLe. on the. ight side dep.esent6 the temperatue. <strong>of</strong> a parcel<br />
e4ted 6tom the. e urace. Winds (m s-1, deg) on the. let side ae. envioonmental<br />
winds tLe.ative to the s-tormn bae.d on 6oundings behind the. stomu.<br />
fael<br />
Sutdace.<br />
rate.<br />
ain-<br />
averaged oveL 2-min intervals duwng the passage oK the. toum Ui<br />
plotted below the section. The hotizonta eine NS through the. ecion at<br />
7.2 km nhowu .the. tack <strong>of</strong> the T-28 penet.ation aiciadSt, smoothed data hom<br />
which a.te. pRotte.d aat the. oot <strong>of</strong> the. 4guAe.. Athough the. T-28 data were. not<br />
qUite. synchuonow us th wthe data en the. veAtical Section,<br />
T-28 updkraht<br />
a comparis<br />
veocity<br />
on <strong>of</strong><br />
mea4uremeLnts<br />
the<br />
with the dlow pattern in the veticat ection<br />
shows that the agreement 4is reasonabey good.
V-5<br />
Figure 2 shows the configuration <strong>of</strong> the updraft circulation derived from<br />
the observations, <strong>an</strong>d also the way it depends on the environmental winds. The<br />
wind pattern was rather complex but the main feature distilled here is that the<br />
storm traveled roughly with the winds in the middle troposphere, the winds in<br />
the lower <strong>an</strong>d upper troposphere having a component from south to north relative<br />
to the storm. As in the case <strong>of</strong> some low-latitude storms (e.g., Ludlam, 1963;<br />
Zipser, 1969), this caused air to feed the updraft from the front <strong>of</strong> the storm<br />
<strong>an</strong>d to leave it as <strong>an</strong> <strong>an</strong>vil trailing to the rear. Owing to strong veer <strong>of</strong> the<br />
environmental winds with height relative to the storm, the inflow actually<br />
approached the updraft with a small component also from beneath the page in<br />
Fig. 2 <strong>an</strong>d the <strong>an</strong>vil outflow left with a strong component back into the page.<br />
However, because <strong>of</strong> the general rearward tilt <strong>of</strong> the updraft most <strong>of</strong> the small<br />
hailstones which grew within the updraft probably descended directly into the<br />
underlying downdraft rather th<strong>an</strong> re-entering the updraft. Thus, although turbu-<br />
lent motions may have tr<strong>an</strong>sferred some particles from <strong>an</strong> older updraft cell<br />
to a younger one, the majority <strong>of</strong> particles would probably have been denied the<br />
ch<strong>an</strong>ce <strong>of</strong> a second ascent in which to continue their growth into larger stones.<br />
A similar (although steadier) updraft configuration to that in Fig. 2 has been<br />
inferred for a supercell storm by Browning <strong>an</strong>d Foote (19<strong>76</strong>) but in that case<br />
strong winds blowing around the storm in the middle troposphere were able to<br />
carry particles around the periphery <strong>of</strong> the updraft so that they could indeed<br />
re-enter the foot <strong>of</strong> the updraft.<br />
Figure 3 (top) embellishes the model with more detailed information from<br />
Parts I-IV. Plotted at the bottom <strong>of</strong> the figure are curves showing the varia-<br />
tion <strong>of</strong> updraft velocity <strong>an</strong>g ent twae ie NS a height <strong>of</strong><br />
7.2 km (all heights are above MSL). Different parts <strong>of</strong> Fig. 3 were derived
V-6<br />
from different sources <strong>of</strong> data obtained over a period <strong>of</strong> about <strong>an</strong> hour during<br />
which a sequence <strong>of</strong> five cells was observed. Times <strong>an</strong>d sources <strong>of</strong> the data<br />
are plotted in Table 1.<br />
Table 1.<br />
Times <strong>an</strong>d sources <strong>of</strong> data in Fig. 3<br />
Data Source Time (MDT)<br />
Radar echo Grover 10 cm radar (See Part I) 1716-1717<br />
Visual cloud Airborne photographs (Part II) 1719<br />
Inflow to updraft 4 aircraft at sub-cloud 1642-1727<br />
<strong>an</strong>d gust front . levels (Part II)<br />
Surface mesometeorological 1655-1727<br />
network (Part II)<br />
Airflow within 2 Doppler radars (Part III) 1727-1736<br />
interior <strong>of</strong> storm<br />
Microphysical T-28 penetration aircraft 1717-1720<br />
measurements in (Part IV)<br />
relation to vertical<br />
air motion<br />
The model in Fig. 3 c<strong>an</strong> be interpreted in two ways. It c<strong>an</strong> either be<br />
regarded as <strong>an</strong> inst<strong>an</strong>t<strong>an</strong>eous view <strong>of</strong> a .typical -structure with four different<br />
cells at different stages <strong>of</strong> evolution or it c<strong>an</strong> be regarded as showing four<br />
stages in the evolution <strong>of</strong> <strong>an</strong> individual cell. Thus Cell n, which had developed<br />
a 'first echo' shortly before the time portrayed in Fig. 3, beg<strong>an</strong> growing out<br />
<strong>of</strong> the shelf cloud as a distinct daughter cloud (n+l) about 15 min earlier.<br />
Cell n-1, which has almost reached its maximum reflectivity, is in its mature<br />
stage; it has a vigorous updraft but part <strong>of</strong> it has been converted into a
V-7<br />
vigorous downdraft. The decaying Cell n-2 is characterized by weak downdrafts<br />
at most levels, with a residual weak updraft in places al<strong>of</strong>t. The time interval<br />
between development <strong>of</strong> successive cells was 15 + 2 min; it took 15 min for n<br />
to evolve to the stage <strong>of</strong> development <strong>of</strong> n-l, <strong>an</strong>d similarly for n-l to evolve<br />
to n-2. The total lifetime <strong>of</strong> each cell was about 45 min. The lifetime for<br />
individual radar echoes was rather longer th<strong>an</strong> the average figure for single-<br />
cell echoes reported by Batt<strong>an</strong> (1953).<br />
The entire inflow toward the updraft originated close to the ground ahead<br />
<strong>of</strong> the storm; at a dist<strong>an</strong>ce <strong>of</strong> 20 km upwind <strong>of</strong> the updraft the inflow was about<br />
500 m deep. The inflow rose unmixed to cloud base, consistent with the laminar<br />
flow generally observed below cloud base in earlier studies (e.g., Auer et al,<br />
1970). The lateral dimensions <strong>of</strong> individual updraft cells, about 8 km at cloud<br />
base level, are similar to the average value for High Plains hailstorms found<br />
by Auer <strong>an</strong>d Marwitz (1968). Cell dimensions decreased in the present case to<br />
roughly 5 km in the middle troposphere. Successive updraft cells may have been<br />
separated by <strong>an</strong> area <strong>of</strong> weak subsidence at cloud base level but they were<br />
contiguous at higher levels, giving rise to a fairly broad region <strong>of</strong> general<br />
updraft al<strong>of</strong>t. The maximum updraft velocity in a mature cell reached 6 to 8 m s-<br />
at cloud base <strong>an</strong>d 20 m s 1 at 7 km MSL just above the level <strong>of</strong> maximum parcel<br />
buoy<strong>an</strong>cy. The average value <strong>of</strong> the updraft at cloud base was 4 m s , again<br />
similar to that measured by Auer <strong>an</strong>d Marwitz (1968) in typical High Plains<br />
hailstorms. Horizontal momentum was conserved in parts <strong>of</strong> the updraft, the<br />
relative southerly component being 10 to 12 m.s 1 in the inflow below cloud<br />
base <strong>an</strong>d also in the updraft core at 7 km, but decreasing by a few meters per<br />
second in the core at 10 km. The outflow from the updraft formed <strong>an</strong> <strong>an</strong>vil
V-8<br />
which was directed mainly toward the left rear fl<strong>an</strong>k <strong>of</strong> the storm (to the left<br />
<strong>an</strong>d into the page). The entire updraft was tilted toward the rear <strong>of</strong> the storm<br />
<strong>an</strong>d, as noted above, there seemed to be little opportunity for precipitation<br />
particles grown within one cell to be recycled into a younger cell.<br />
As for the downdraft, part <strong>of</strong> it originated in the mid-troposphere at the<br />
level <strong>of</strong> lowest equivalent potential temperature (6 km) <strong>an</strong>d descended unmixed<br />
to the surface; this air entered the storm on its right rear fl<strong>an</strong>k (from the<br />
left <strong>of</strong> <strong>an</strong>d above the page). Some <strong>of</strong> the downdraft was also probably generated<br />
within former updraft air. This is suggested by the form <strong>of</strong> the streamlines in<br />
Fig. 3 but the possibility <strong>of</strong> motion out <strong>of</strong> the pl<strong>an</strong>e weakens the inference<br />
somewhat. The maximum observed downdraft velocity <strong>of</strong> 15 m s- 1 was located in<br />
the region <strong>of</strong> highest radar reflectivity, close to cloud base level. Downdraft<br />
velocities greater th<strong>an</strong> 10 m s- 1 occurred in a region 2 km wide extending from<br />
a height <strong>of</strong> 2 to 6 km. A pronounced maximum <strong>of</strong> turbulence intensity existed at<br />
the updraft-downdraft interface <strong>of</strong> the mature cell; it reached a peak near the<br />
level <strong>of</strong> maximum parcel buoy<strong>an</strong>cy (7 km). The depth <strong>of</strong> the surface outflow<br />
exceeded 1 km ahead <strong>of</strong> the storm, but behind the storm the depth <strong>of</strong> downdraft<br />
air that was directed rearward relative to the storm was less th<strong>an</strong> 500 m.<br />
Surface divergence beneath the strongest downdraft was 4 x 10 3 s 1 . Maximum<br />
surface convergence at the inflow-outflow interface was 1 to 2 x 10 3 s- 1<br />
On average the gust front extended 5 km ahead <strong>of</strong> the leading edge <strong>of</strong> the surface<br />
precipitation, a feature which according to Auer et al (1969) is typical <strong>of</strong><br />
intense <strong>an</strong>d persistent hailstorms.<br />
Measurements with the penetration aircraft indicated that supercooled<br />
water was most abund<strong>an</strong>t in the young updraft regions in the vicinity <strong>of</strong> the<br />
'first echo.' Small supercooled droplets (diameter < 50 im) were present at
V-9<br />
-3<br />
the 7 km level in amounts <strong>of</strong> about 1 g m . This is about a third <strong>of</strong> the<br />
adiabatic content. The 'first echo' in each cell occurred typically at -12°C<br />
(7 km MSL), rather lower th<strong>an</strong> usual for High Plains hailstorms (Browning, 1975).<br />
Shortly after the appear<strong>an</strong>ce <strong>of</strong> the first echo it contained particles 5 mm in<br />
--3<br />
diameter in a number concentration <strong>of</strong> 1 m ; most <strong>of</strong> these larger particles<br />
were frozen but a few (up to 25%) appeared to be entirely water. The mature<br />
cell '(n-l) contained particles with diameter 8 to 10 mm in concentrations <strong>of</strong><br />
-3<br />
about 0.5 m at a height <strong>of</strong> 7 km. These particles, which accounted for most<br />
<strong>of</strong> the maximum radar reflectivity, were almost entirely <strong>of</strong> ice <strong>an</strong>d were most<br />
abund<strong>an</strong>t on the rear edge <strong>of</strong> the updraft <strong>an</strong>d in the downdraft. Large concen-<br />
trations <strong>of</strong> water corresponding to possible 'accumulation zones' (Sulakvelidze<br />
et al, 1967) were not found. Heavy rain (a 100 mm hr ) <strong>an</strong>d hail (maximum<br />
diameter 15 mm) reached the surface, giving a total <strong>of</strong> 12 mm in 20 min <strong>of</strong> which<br />
5% was due to hail. Although no hail was'collected for the particular storm<br />
<strong>of</strong> interest, in a nearby storm 25% <strong>of</strong> the hailstone embryos.were frozen drops<br />
<strong>an</strong>d 75% were graupel.<br />
3. Growth <strong>of</strong> hail in the Raymer storm<br />
In the previous section we summarized the bare facts about the storm<br />
structure as derived in Parts I to IV. We now attempt to piece some <strong>of</strong> these<br />
facts together in a more speculative way to infer the likely growth conditions<br />
for the hail <strong>an</strong>d also the possible influence <strong>of</strong> silver iodide seeding.<br />
Large hailstones have fallspeeds V t <strong>of</strong> 20 m s or more <strong>an</strong>d in <strong>an</strong>y theory<br />
their production requires that the updraft in which they are grown shall have<br />
comparable<br />
comparable speeds.<br />
speeds. However,<br />
-1.<br />
in the early stages <strong>of</strong> its growth (when Vt < 10 m s<br />
the fallspeed <strong>of</strong> a hailstone embryo increases rather slowly <strong>an</strong>d a steady strong<br />
updraft would carry it through the supercooled zone <strong>of</strong> a cloud before it could
V-10<br />
attain a large size (Ludlam, 1958). A favorable growth regime c<strong>an</strong> occur in at<br />
least two ways. One way is for <strong>an</strong> embryo to grow during <strong>an</strong> ascent on the edge<br />
<strong>of</strong> a quasi-steady updraft'where the vertical velocity is relatively weak <strong>an</strong>d<br />
then, after its terminal fallspeed has reached about 10 m s , for it to get<br />
carried around to the inflow side <strong>of</strong> the main updraft to enter the core <strong>of</strong> the<br />
updraft at a low level. Such a behavior probably applies to supercell storms<br />
(Browning <strong>an</strong>d Foote, 19<strong>76</strong>) but is not applicable to the Raymer storm because<br />
individual updraft cells were short-lived <strong>an</strong>d in <strong>an</strong>y case there were no signi-<br />
fic<strong>an</strong>t components <strong>of</strong> flow al<strong>of</strong>t capable <strong>of</strong> causing the embryos to recycle in<br />
this way; neither does it seem likely that turbulence c<strong>an</strong> have tr<strong>an</strong>sferred m<strong>an</strong>y<br />
such particles from the mature cells into the daughter clouds against the me<strong>an</strong><br />
flow. A second way for the embryos to grow, exemplified in this case study,<br />
is for them to grow in a time-developing updraft. The young daughter clouds<br />
which characterize <strong>an</strong> ordinary multicell storm are thus favored regions for the<br />
growth <strong>of</strong> embryos because they do not develop into strong updrafts until some<br />
time after the initial cloud formation (Musil, 1970).<br />
In the Raymer storm the early growth <strong>of</strong> embryos typically 5 mm in diameter<br />
from small cloud particles seems likely to have occurred within newly rising<br />
daughter clouds going from the n+l position in Fig. 3 to the n position (see<br />
trajectory in Fig. 3).- The subsequent motion <strong>of</strong> the embryos was determined by<br />
tracking local volumes <strong>of</strong> relatively high reflectivity through the storm echo<br />
(see Part I). This showed that the further growth <strong>of</strong> the embryos into hail-<br />
stones which reached the ground 10 to 15 mm in diameter occurred while the<br />
particles (me<strong>an</strong> terminal fallspeed X 20 m s 1 ) were essentially bal<strong>an</strong>ced within<br />
the updraft as Cell n moved into the n-l position in Fig. 3. Recall, now, that<br />
the flow pattern in Fig. 3 is drawn relative to each individual cell <strong>an</strong>d that
V-ll<br />
the developing cells were moving relatively at 5 m s into the main storm<br />
system. During their growth most <strong>of</strong> the small hailstones probably will have<br />
remained within the same Cpdraft cell as the cell moved through the storm<br />
system. In this case, the apparent crossing <strong>of</strong> the hail trajectory from one<br />
cell to <strong>an</strong>other in Fig. 3 c<strong>an</strong> be construed as a stone staying within a single<br />
cell as the cell goes through successive phases <strong>of</strong> development. On the other<br />
h<strong>an</strong>d, hailstone embryos growing on the northern edge <strong>of</strong> Cell n may have<br />
descended into part <strong>of</strong> the older updraft associated with Cell n-l, just as<br />
the stones in the unsteady hailstorm observed by Batt<strong>an</strong> (1975) sometimes appeared<br />
to be falling from one small updraft core into <strong>an</strong>other. In either event the<br />
hailstones at this stage were evidently encountering updraft velocities suffi-<br />
cient to keep them al<strong>of</strong>t without major fluctuations in altitude.<br />
The final stage in the hailstone growth history was for the particle<br />
-3<br />
content to increase to about 2 g m3 near the region in Fig. 3 where the<br />
reflectivity exceeds 50 dBZ. It appears that precipitation loading, <strong>an</strong>d, more<br />
import<strong>an</strong>tly, mixing with low-6 air, beg<strong>an</strong> to have <strong>an</strong> effect here, for the<br />
e<br />
lower portions <strong>of</strong> the updraft were quickly converted into a downdraft, <strong>an</strong>d<br />
the hailstones cascaded rapidly to the ground with negligible further growth<br />
in a region almost depleted <strong>of</strong> supercooled water. Taking a me<strong>an</strong> terminal<br />
fallspeed <strong>of</strong> 23 m s for hailstones 15 mm in diameter <strong>an</strong>d a me<strong>an</strong> downdraft<br />
velocity <strong>of</strong> 10 m s , such particles will have descended from 8 km to the<br />
ground at 1.5 km MSL in as little as 200 sec. For a period <strong>of</strong> about 120 sec<br />
the stones will have been descending below'the 0 C level. As a result <strong>of</strong><br />
meltingsuch stones will have reached the ground about 13 mm in diameter (Ludlam,<br />
1958).<br />
Growth <strong>of</strong> the hailstones from embryos nominally 5 mm in diameter to stones<br />
15 mm across is believed to have occurred as they were carried more or less
V-12<br />
horizontally relative to the storm system through a dist<strong>an</strong>ce <strong>of</strong> 6 km at <strong>an</strong><br />
ambient temperature between -20 <strong>an</strong>d -30°C (Fig. 3). Taking a relative hori-<br />
zontal velocity <strong>of</strong> 8 m s , consistent with the Doppler radar measurements in<br />
Part III, gives a period <strong>of</strong> 750 sec. According to Ludlam (1958), this period<br />
is sufficient to account for growth from 5 to 15 mm diameter in the presence<br />
-3<br />
<strong>of</strong> a cloud water content <strong>of</strong> 1 g m . This is broadly consistent with the values<br />
measured by the T-28.<br />
The most difficult stage <strong>of</strong> growth to reconstruct is the development <strong>of</strong><br />
the 5-mm embryos during the approximately 15-min period <strong>of</strong> initial growth <strong>of</strong><br />
the daughter cloud. It has been suggested that the ice-crystal/graupel<br />
mech<strong>an</strong>ism is the domin<strong>an</strong>t process in High Plains storms (e.g., Dye et al, 1974),<br />
<strong>an</strong>d the fact that 75% <strong>of</strong> the embryos in a nearby storm on this occasion were<br />
graupel tends to support this view. However, there remains the problem <strong>of</strong><br />
accounting for the remaining 25% <strong>of</strong> frozen-drop embryos in the nearby storm<br />
<strong>an</strong>d the similar proportion <strong>of</strong> large all-water drops in the region <strong>of</strong> the first<br />
echo in the Raymer storm. We have already shown that the flow pattern in this<br />
storm was not conducive to such particles having been recycled from other,<br />
more mature, parts <strong>of</strong> the storm. Possibly these large drops did begin as<br />
graupel <strong>an</strong>d experienced a brief turbulent excursion below the 0 0 C level during<br />
the growth <strong>of</strong> <strong>an</strong> individual daughter cloud. Alternatively the few large water<br />
drops encountered in the region <strong>of</strong> the first echo may have been due to growth<br />
by coalescence. As shown by D<strong>an</strong>ielsen et al (1972), for coalescence to account<br />
for the observed growth rate, it is necessary to assume the existence <strong>of</strong> rare<br />
large cloud droplets at cloud base. Perhaps these arose due to the presence<br />
<strong>of</strong> a few large aerosol particles; such particles have been detected within<br />
hailstones <strong>an</strong>d are probably due to wind-raised dust (Rosinski, 1966; Rosinski<br />
<strong>an</strong>d Kerrig<strong>an</strong>, 1969).
V-13<br />
The above discussion indicates that the nature <strong>of</strong> the early growth is<br />
still open to question although the bal<strong>an</strong>ce <strong>of</strong> evidence suggests that the ice<br />
crystal/graupel mech<strong>an</strong>ism is likely to predominate. It is clearly import<strong>an</strong>t.<br />
that more aircraft penetrations <strong>of</strong> daughter clouds (i.e., first echo regions)<br />
should be made, especially using instruments which are specially designed to<br />
identify the phase <strong>of</strong> the hydrometeors (e.g., C<strong>an</strong>non, 1974). However, the<br />
uncertainties that exist should not detract from the general conclusions that<br />
(1) the embryos originate in the young daughter clouds, (2) they grow into<br />
hailstones while suspended at high levels after the updraft has become strong,<br />
<strong>an</strong>d (3) they follow a trajectory broadly resembling that depicted in Fig. 3.<br />
These conclusions are similar to those reached by Musil (1970) <strong>an</strong>d Renick (1971).<br />
It is instructive to compare the vertical section in Fig. 3 with that<br />
through supercell storms -- see e.g., Fig. 11 <strong>of</strong> Browning <strong>an</strong>d Foote (19<strong>76</strong>). In<br />
both cases the updraft enters the storm within a weak echo region (WER). In<br />
the supercell the WER is in the form <strong>of</strong> a vault bounded by <strong>an</strong> overh<strong>an</strong>ging cur-<br />
tain <strong>of</strong> echo containing embryos which have formed elsewhere <strong>an</strong>d have circulated<br />
around the edge <strong>of</strong> the updraft so as to re-enter it on its forward side. In the<br />
ordinary multicell storm the WER is not bounded: there are probably no recircu-<br />
lating embryos either. Instead the embryos form in situ during relatively weak<br />
ascent on the leading.edge <strong>of</strong> the WER. In a supercell the re-entering embryos<br />
grow into hailstones while crossing over the vault from front to back; the<br />
newly-grown embryos in <strong>an</strong> ordinary multicell storm, on the other h<strong>an</strong>d, grow<br />
into hailstones while they (<strong>an</strong>d their associated first echo) are first suspended<br />
above <strong>an</strong>d then descend into the WER. In a supercell the growth <strong>of</strong> the hail-<br />
stones on the edge <strong>of</strong> the vault is favored since they are the first large<br />
particles to encounter undepleted cloud water in the updraft: to use the
V-14<br />
terminology <strong>of</strong> Browning <strong>an</strong>d Foote (19<strong>76</strong>), they "compete unfairly" for.the<br />
cloud water in the updraft. To some extent this may still be true <strong>of</strong> particles<br />
above the WER in <strong>an</strong> ordinary multicell storm as they descend into the WER.<br />
However, there is evidence that, whereas the updraft in a supercell is suffi-<br />
ciently strong <strong>an</strong>d continuous both to prevent <strong>an</strong>y cloud droplets attaining<br />
precipitation size within the vault <strong>an</strong>d to prevent precipitation from entering<br />
it from its periphery, the same does not necessarily apply in the WER <strong>of</strong> <strong>an</strong><br />
ordinary multicell storm. Perhaps because <strong>of</strong> rapid growth on very large<br />
aerosol particles or because <strong>of</strong> turbulence bringing the particles from the<br />
side, additional precipitation particles appear beneath the particles descending<br />
from the original first echo. They c<strong>an</strong> be seen, for example, as the extensive<br />
region <strong>of</strong> relatively weak echo on the inflow side <strong>of</strong> the high reflectivity<br />
hailshaft in Fig. 3; in supercells this region is usually absent <strong>an</strong>d there is<br />
instead <strong>an</strong> abrupt tr<strong>an</strong>sition from no detectable echo in the vault to the high-<br />
reflectivity hailshaft bounding the vault. The presence <strong>of</strong> such particles,<br />
provided they are frozen, would have the effect <strong>of</strong> depleting the cloud water<br />
from which the original large embryos are able to grow <strong>an</strong>d might account for<br />
the low cloud water content measured al<strong>of</strong>t by the T-28. These additional<br />
precipitation particles, being situated close to where the updraft is converted<br />
into a downdraft, are not themselves likely to grow into hail since they fall<br />
out <strong>of</strong> the updraft prematurely. Any effect <strong>of</strong> this kind would <strong>of</strong> course tend<br />
to suppress hail growth naturally by diminishing the ability <strong>of</strong> the first-born<br />
embryos to compete unfairly for the available water.<br />
4. Some implications for hail suppression<br />
One way <strong>of</strong> attempting to suppress hail is to try to emulate nature by<br />
generating further competing embryos in the parts <strong>of</strong> the updraft containing
V-15<br />
abund<strong>an</strong>t supercooled water just beneath the main region <strong>of</strong> growing hailstones,<br />
in the region <strong>of</strong> the intensifying 'first echo.' According to Browning <strong>an</strong>d<br />
Foote (19<strong>76</strong>), a corresponding approach may not be possible in the case <strong>of</strong><br />
supercells because' it requires the generation <strong>of</strong> competing particles within<br />
the vault where the updraft is persistently too strong to give enough time<br />
for competing particles to develop. The situation appears to be better in<br />
<strong>an</strong> ordinary multiceli storm provided one is able to take adv<strong>an</strong>tage <strong>of</strong> the<br />
time-evolving character <strong>of</strong> the individual updrafts <strong>an</strong>d attempts to seed each<br />
cell prior to the development <strong>of</strong> the first precipitation particles responsible<br />
for the 'first echo,' but also, if the seeding is begun early enough, one c<strong>an</strong><br />
exploit the relatively.slow updraft velocity during the earliest stage <strong>of</strong><br />
growth <strong>of</strong> the daughter cloud so as to give more time for the competing embryos<br />
to become effective.<br />
Much <strong>of</strong> the growth <strong>of</strong> the initial embryos in the Raymer storm was accom-<br />
plished during ascent from cloud base to the 'first echo' at the -12°C level.<br />
The level <strong>of</strong> formation <strong>of</strong> the 'first echo' on this occasion was rather lower<br />
th<strong>an</strong> usual for hailstorms; it c<strong>an</strong> be as high as the -40°C level although perhaps<br />
a more typical value would be -20 to -30°C (Browning, 1975). If seeding is<br />
to be effective in slowing down the growth <strong>of</strong> such embryos <strong>an</strong>d in producing<br />
m<strong>an</strong>y more <strong>of</strong> comparable size, it is probably necessary for it to cause the<br />
liquid water content to be subst<strong>an</strong>tially depleted by the -20°C level. In some<br />
recent calculations Young (1975) has derived the seeding rate required to<br />
deplete (through glaciation) different proportions <strong>of</strong> the cloud water at<br />
different altitudes. He finds that the required seeding rate depends very<br />
sensitively on the updraft velocity. For a very weak updraft <strong>of</strong> 2 m s~l at<br />
about 3 km MSL increasing upward linearly at 0.75 m s~ 1 per km, the seeding
V-16<br />
rate required to achieve 90% glaciation by the -200C level is <strong>of</strong> order<br />
1 g min km <strong>of</strong> silver iodide; for <strong>an</strong> updraft <strong>of</strong> 4 m s at 3 km increasing<br />
upward at 1.5 m s per kA the corresponding seeding rate is <strong>of</strong> the order <strong>of</strong><br />
-1 -2<br />
30 g min km .. For comparison, a typical seeding rate as used by NHRE is<br />
-1 -2<br />
only 1 g min km ,. although this seeding rate could reasonably be increased<br />
by at least <strong>an</strong> order <strong>of</strong> magnitude. Of course, Young's calculations are highly<br />
simplified. No allow<strong>an</strong>ce is made for the decrease in concentration <strong>of</strong> silver<br />
iodide in the cloud due to turbulent diffusion. The assumed mode <strong>of</strong> nucleation<br />
may also be in error. Consequently these results must not be relied on in a<br />
highly qu<strong>an</strong>titative way. However, they do suggest that a signific<strong>an</strong>t proportion<br />
<strong>of</strong> the supercooled water c<strong>an</strong> be glaciated by the -20 C level only if the seeding<br />
is applied at <strong>an</strong> early stage in the growth <strong>of</strong> each successive daughter cloud<br />
while the vertical velocities are still very weak. Updrafts <strong>of</strong>ten intensify<br />
quite rapidly in daughter clouds, however, <strong>an</strong>d so it appears to be desirable<br />
to act quickly as soon as a growing daughter cloud is identified. As shown in<br />
Fig. 3, the developing daughter clouds are located m<strong>an</strong>y kilometers ahead (or<br />
to the right) <strong>of</strong> the mature updraft region: according to the above arguements<br />
this is where the seeding should be concentrated.<br />
It is not clear for how long one should continue seeding a daughter cloud<br />
as it develops into the main updraft. One hopes that the early seeding will<br />
produce more <strong>an</strong>d smaller embryos in the initial stages <strong>of</strong> growth so that they<br />
will compete among themselves for the available water when they later find<br />
themselves in the intensifying updraft. In some ways one would have liked to<br />
have been able to glaciate the mature updraft in order to be more certain <strong>of</strong><br />
preventing signific<strong>an</strong>t further hailstone growth but, as Young has shown, there<br />
comes a stage in the intensification <strong>of</strong> the updraft beyond which reasonable
V-17<br />
seeding rates will no longer have <strong>an</strong>y worthwhile effect. In <strong>an</strong>y case there<br />
is good reason to avoid seeding the strong updraft very heavily since, according<br />
to Young, this might cause a reduction in surface rainfall. Seeding at moderate<br />
rates in a weak updraft on the other h<strong>an</strong>d is more likely to have the opposite<br />
effect.<br />
Seeding the regions <strong>of</strong> initial embryo development is the approach adopted<br />
by Schock (1971), Summers et al (1972), <strong>an</strong>d Abshaev <strong>an</strong>d Kartsivadze (1973).<br />
Abshaev <strong>an</strong>d Kartsivadze recommend seeding near the leading edge <strong>of</strong> the radar<br />
echo, up to 3 to 5 km ahead <strong>of</strong> it, as shown by the crosses in Fig. 4. The<br />
region denoted by the dots in Fig. 4, within the radar overh<strong>an</strong>g, was the<br />
primary target <strong>of</strong> the seeding carried out by Sulakvelidze, Bibilashvili <strong>an</strong>d<br />
Lapcheva (1967), based upon the 'accumulation zone' concept. The latter<br />
corresponds to the common practice <strong>of</strong> seeding in the mature updraft, which<br />
we now suggest is not the best procedure. Abshaev <strong>an</strong>d Kartsivadze (1973) used<br />
radar to determine where to seed; however, since the initial embryo development<br />
is within daughter clouds before the 'first echo' stage, it may sometimes be<br />
easier to identify the seeding locations visually (Summers et al, 1972).<br />
Visibility from the ground is <strong>of</strong>ten obscured <strong>an</strong>d so such observations are most<br />
reliably obtained from <strong>an</strong> aircraft.<br />
It is import<strong>an</strong>t to keep in mind the limitations <strong>of</strong> the above discussion<br />
regarding the possibilities for hail suppression. What we have suggested on<br />
the basis <strong>of</strong> indirect inference is that the prospects for at least partial<br />
success in hail suppression seem rather more promising in ordinary multicell<br />
storms th<strong>an</strong> in the archetypal supercell storms discussed by Browning <strong>an</strong>d Foote<br />
(19<strong>76</strong>). We have also suggested a way <strong>of</strong> improving the ch<strong>an</strong>ce <strong>of</strong> seeding having<br />
a beneficial effect. However, these suggestions are tentative; the observational
V-22<br />
Musil, D. J., 1970: Computer modeling <strong>of</strong> hailstone growth in feeder clouds.<br />
J. Atmos. Sci., 27, pp. 474-482.<br />
Renick, J. H., 1971: Radar reflectivity pr<strong>of</strong>iles <strong>of</strong> individual cells in<br />
a persistent multicellular Alberta hailstorm. Preprints, Seventh<br />
Conf. on Severe Local Storms, Boston, Amer. Meteor. Soc., pp. 63-70.<br />
Rosinski, J., 1966: Solid water-insoluble particles in hailstones <strong>an</strong>d<br />
their geophysical signific<strong>an</strong>ce. J. Appl. Meteor., 5, pp. 481-492.<br />
<strong>an</strong>d T. C. Kerrig<strong>an</strong>, 1969: The role <strong>of</strong> aerosol particles in<br />
the formation <strong>of</strong> raindrops <strong>an</strong>d hailstones in severe thunderstorms.<br />
J. Atmos. Sci., 26, pp. 695-715; corrigendum, 27, pp. 178-179.<br />
Schock, M. R., 1971: The North Dakota Pilot Project: 1971 work pl<strong>an</strong>s.<br />
Inst. <strong>of</strong> Atmos. Sci., South Dakota School <strong>of</strong> Mines & Technology,<br />
Rapid City, South Dakota, Report No. 71-8, 23 pp.<br />
Sulakvelidze, G. K., N. Sh. Bibilashvili <strong>an</strong>d V. F. Lapcheva, 1967: Forma-<br />
tion <strong>of</strong> precipitation <strong>an</strong>d modification <strong>of</strong> hail processes. Israel<br />
Program for Scientific Tr<strong>an</strong>slations, Jerusalem, 208 pp.<br />
Summers, P. W., G. K. Mather <strong>an</strong>d D. S. Treddenick, 1972: The development<br />
<strong>an</strong>d testing <strong>of</strong> <strong>an</strong> airborne droppable pyrotechnic flare system for<br />
seeding Alberta hailstorms. J. Appl. Meteor., 11, pp. 695-703.<br />
Young, K. C., 1975: Growth <strong>of</strong> the ice phase in strong cumulonimbus up-<br />
drafts. Submitted to Pure <strong>an</strong>d Applied Geophysics.<br />
Zipser, E. J., 1969: The role <strong>of</strong> org<strong>an</strong>ized unsaturated convective down-<br />
drafts in the structure <strong>an</strong>d rapid decay <strong>of</strong> <strong>an</strong> equatorial disturb<strong>an</strong>ce.<br />
J. Appl. Meteor., 8, pp. 799-814.