Collaboration by Illustration: Real-Time Visualization in Web3D
Collaboration by Illustration: Real-Time Visualization in Web3D
Collaboration by Illustration: Real-Time Visualization in Web3D

You also want an ePaper? Increase the reach of your titles
YUMPU automatically turns print PDFs into web optimized ePapers that Google loves.
Abstract<br />
<strong>Collaboration</strong> <strong>by</strong> <strong>Illustration</strong>: <strong>Real</strong>-<strong>Time</strong> <strong>Visualization</strong> <strong>in</strong> <strong>Web3D</strong><br />
Frank Goetz ∗<br />
University of Paderborn<br />
Bernd Eßmann † and Thorsten Hampel ‡<br />
He<strong>in</strong>z Nixdorf Institute, University of Paderborn<br />
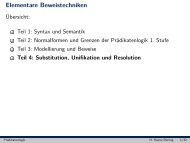
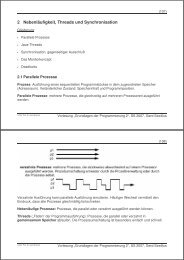
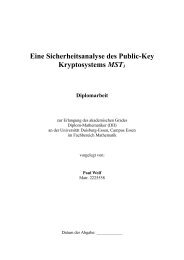
Figure 1: <strong>Visualization</strong> object embedded <strong>in</strong> Java-based Whiteboard of CSCW system.<br />
Graphical representation of complex data sets is an important<br />
method for support<strong>in</strong>g scientific collaboration. Follow<strong>in</strong>g this idea,<br />
we developed a novel <strong>Web3D</strong>-based visualization framework that<br />
supports synchronous as well as asynchronous cooperation, even of<br />
spatially separated scientist. Our openVisaar framework is based on<br />
open-source technology and comb<strong>in</strong>es <strong>in</strong>novative techniques from<br />
the area of computer-generated visualization with modern achievements<br />
of CSCW (Computer Supported Cooperative Work). Therefore,<br />
we extended OpenSG with the functionality for support<strong>in</strong>g<br />
cooperative and remote features. OpenSG is a portable scene graph<br />
system to create real-time graphics applications. openVisaar is designed<br />
to accompany state-of-the-art CSCW systems <strong>in</strong> the collaboration<br />
process <strong>by</strong> embedd<strong>in</strong>g the visualization features <strong>in</strong>to the cooperation<br />
environment. For this purpose openVisaar provides a rich<br />
set of <strong>in</strong>terfaces. By comb<strong>in</strong><strong>in</strong>g both worlds – visualization and<br />
CSCW – users of our system get an up-to-date all-<strong>in</strong>-one solution<br />
for collaborat<strong>in</strong>g with real world data.<br />
CR Categories: H.5.3.b [Information Interfaces and Representation]:<br />
Group and Organization Interfaces—Collaborative<br />
Comput<strong>in</strong>g; H.5.3.c [Information Interfaces and Representation]:<br />
Group and Organization Interfaces—Computer-Supported Cooperative<br />
Work ; I.3.2.a [Computer Graphics]: Graphics Systems—<br />
Distributed/Network Graphics; I.3.2.b [Computer Graphics]:<br />
Graphics Systems—Remote Systems<br />
Keywords: collaborative visualization, remote visualization, realtime<br />
render<strong>in</strong>g, computer supported cooperative work<br />
∗ e-mail: frank.goetz@uni-paderborn.de<br />
† e-mail: bernd.essmann@uni-paderborn.de<br />
‡ e-mail: hampel@uni-paderborn.de<br />
1 Introduction<br />
Many different libraries, frameworks, and even dozens of systems<br />
and browser plug-<strong>in</strong>s are available for br<strong>in</strong>g<strong>in</strong>g three-dimensional<br />
content <strong>in</strong>to the Web. In this paper we do not plan to describe<br />
another toolkit, framework, or library for visualiz<strong>in</strong>g threedimensional<br />
scenarios <strong>in</strong> <strong>Web3D</strong> – we want to expla<strong>in</strong> how the chosen<br />
components work together and what their benefits are. The<br />
basic ideas and concepts of the here presented system are very <strong>in</strong>tuitive.<br />
Perhaps, they can help other developers and scientists to<br />
realize their own <strong>Web3D</strong>-based collaboration system.<br />
1.1 GeoVis and ESkimo<br />
In 1997 we began with the developments of a visualization system<br />
named GeoVis. The need for GeoVis [Koenig et al. 1998] was<br />
based on a corporation with geologists who wanted complex threedimensional<br />
real-time visualizations of their time-variant data sets.<br />
GeoVis was implemented on SGI workstation <strong>in</strong> C++, Open Inventor<br />
2.0, Iris Viewkit, and Motif 2.0 and featured the visualization of<br />
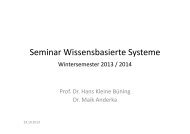
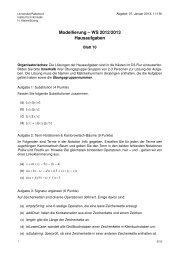
terra<strong>in</strong>, surfaces, and 3d glyphs from the underly<strong>in</strong>g data set (see<br />
Figure 2 (left side)). An <strong>in</strong>teractive and time dynamic representation<br />
could not be accomplished with GeoVis, though the data themselves<br />
were multi-temporal.<br />
The data set was calculated <strong>by</strong> climate simulation software developed<br />
at the University of Münster and shows the geographic and
geological data of an urban area <strong>in</strong> North Rh<strong>in</strong>e-Westphalia (Germany)<br />
[Bernarnd and Streit 1995]. Each time step of the data set<br />
consists of data for w<strong>in</strong>d velocity (w<strong>in</strong>d direction and w<strong>in</strong>d speed),<br />
temperature, moisture, air pressure, and more, for regular spatial locations<br />
over ground. Climate simulation produces cont<strong>in</strong>uous time<br />
steps <strong>in</strong> 30 seconds <strong>in</strong>tervals. Such a geological data set has a size<br />
of a few 100 mega<strong>by</strong>tes.<br />
Two years later (1999), SGI workstations had become obsolete.<br />
Now, W<strong>in</strong>dows NT was the modern operat<strong>in</strong>g system and most of<br />
the SGI-based implementations could not be used directly on the<br />
new platform. Therefore, we redesigned GeoVis and ported most<br />
of its rout<strong>in</strong>es to a new visualization system. Additionally, slices,<br />
isol<strong>in</strong>es, streaml<strong>in</strong>es, and stream ribbons were realized as new visualization<br />
techniques <strong>in</strong> our second visualization system called ESkimo.<br />
With the new system we wanted to accomplish two th<strong>in</strong>gs:<br />
Firstly, we were to use only libraries that are freely available (and<br />
ideally would be open source) for non-commercial use and secondly,<br />
we wanted to separate the application itself from the GUI.<br />
ESkimo is based on MAM/VRS (Model<strong>in</strong>g and Animation Mach<strong>in</strong>e<br />
/ Virtual Render<strong>in</strong>g System) [Doellner and H<strong>in</strong>richs 2002].<br />
Our visualization system, which calculates and generates the threedimensional<br />
view is the only part of the toolkit that has to be compiled<br />
for different platforms. The Tcl/Tk-based user <strong>in</strong>terface looks<br />
the same on all platforms (see Figure 2 (right side)).<br />
The ma<strong>in</strong> reason for separat<strong>in</strong>g the visualization part of the toolkit<br />
from the user <strong>in</strong>terface was to offer users (who are not <strong>in</strong>volved<br />
<strong>in</strong> the ESkimo project) the possibility to build their own user <strong>in</strong>terface.<br />
ESkimo runs on SUN Solaris, SGI Irix and different Microsoft<br />
W<strong>in</strong>dows operat<strong>in</strong>g systems.<br />
Figure 2: Glyphs visualized with GeoVis (left) and ESkimo’s<br />
graphical user <strong>in</strong>terface (right).<br />
1.2 In-Between Phase<br />
So far so good – ESkimo worked f<strong>in</strong>e for the next years and was<br />
even runnable on computers <strong>in</strong> 2002. After reflect<strong>in</strong>g the past years<br />
it became clear that also ESkimo needed updat<strong>in</strong>g.<br />
At that time, collaboration was demanded <strong>in</strong> every scientific field<br />
and of course for all k<strong>in</strong>ds of applications. VRML (Virtual <strong>Real</strong>ity<br />
Model<strong>in</strong>g Language) showed us dur<strong>in</strong>g the last years that threedimensional<br />
multi-user scenarios are possible and even work <strong>in</strong><br />
<strong>Web3D</strong>. Its successor X3D (eXtensible 3D) was ready for launch<br />
to reach new dimensions <strong>in</strong> <strong>Web3D</strong>.<br />
At this po<strong>in</strong>t, we rethought ESkimo and debated its strength and<br />
weakness for a next-generation visualization system. Then we<br />
started develop<strong>in</strong>g a Java-based visualization system. For OpenGL<br />
render<strong>in</strong>g we decided on GL4Java (OpenGL b<strong>in</strong>d<strong>in</strong>g for Java)<br />
whereas we used X3D as format and for scene graph structure. At<br />
this time neither Xj3D nor X3D enabled browser plug-<strong>in</strong>s were officially<br />
available. After a few weeks we saw that our implementation<br />
would not fullfill our goals, because:<br />
• Java as programm<strong>in</strong>g language is too slow,<br />
• Java memory management can not handle large data sets,<br />
• and load<strong>in</strong>g data from a server to a client took too long.<br />
Here we stopped implement<strong>in</strong>g a pure Java-based solution. Our focus<br />
now was to have a real-time <strong>Web3D</strong>-based visualization system<br />
for synchronously collaborative work with large data sets.<br />
2 Ideas, Requirements and Concepts<br />
Before discuss<strong>in</strong>g related work, we want to po<strong>in</strong>t out what k<strong>in</strong>d of<br />
system and features we were look<strong>in</strong>g for, what needs we anticipated<br />
from possible cooperation partners and what additional desires we<br />
had:<br />
1. a ma<strong>in</strong>tenance-free visualization system that runs on all k<strong>in</strong>ds<br />
of possible platforms (even on laptops with no or moderate<br />
render<strong>in</strong>g resources) and various operat<strong>in</strong>g systems,<br />
2. render<strong>in</strong>g of visualizations should be as fast as possible and<br />
GPU-based (Graphics Processor Unit) render<strong>in</strong>g algorithms<br />
should be no problem at all,<br />
3. the system must handle large data sets, which should be available<br />
for users immediately,<br />
4. even locally separated cooperation partners should use it,<br />
5. and f<strong>in</strong>ally jo<strong>in</strong> together CSCW (Computer Supported Cooperative<br />
Work) and visualization to give users a work<strong>in</strong>g environment<br />
for optimal collaboration.<br />
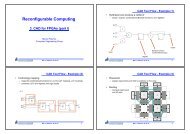
After the collection of ideas and requirements we made a first concept.<br />
A distributed visualization framework should fulfill all of<br />
our requirements. To achieve a fast and high quality render<strong>in</strong>g our<br />
server services should be implemented <strong>in</strong> C++ and OpenGL. There<br />
should exist a SceneServer that handles and distributes the threedimensional<br />
visualization scene (maybe a scene graph), manages<br />
users and their rights, and communicates with SceneRenderes and<br />
remote clients. Individual SceneRenderes (optimally one for each<br />
client) should get the distributed scene from the SceneServer, render<br />
it, grab the OpenGL framebuffer, encode the framebuffer <strong>in</strong>to a<br />
video frame, and stream the video to a specific remote client. The<br />
client itself should be realized as a Java-based applet that can be<br />
embedded <strong>in</strong>to a web browser or as Java-based standalone application.<br />
An overview of the concept can be found <strong>in</strong> Figure 3.<br />
3 Related Work<br />
There are many different visualization systems and toolkits available<br />
that can be used for scientific visualization. We only want<br />
to mention a few like AVS/Express <strong>by</strong> Advanced Visual Systems<br />
Inc., IRIS Explorer <strong>by</strong> Numerical Algorithms Group Ltd., Open <strong>Visualization</strong><br />
Data Explorer <strong>by</strong> OpenDX formerly <strong>by</strong> IBM, and the<br />
<strong>Visualization</strong> Toolkit (VTK) <strong>by</strong> Kitware.<br />
Amira [Stall<strong>in</strong>g et al. 1998] is an Open Inventor based visualization<br />
toolkit for process<strong>in</strong>g three-dimensional data, e.g. <strong>in</strong> medic<strong>in</strong>e,<br />
biology, physics, or eng<strong>in</strong>eer<strong>in</strong>g. Graphics hardware support is utilized<br />
for display<strong>in</strong>g even very large data sets at <strong>in</strong>teractive frame
Figure 3: Concept of the distributed visualization framework.<br />
rates. Also, there exists a distributed Open Inventor implementation<br />
[Hes<strong>in</strong>a et al. 1999], unfortunately not directly supported<br />
<strong>by</strong> Amira. Furthermore, Amira provides no specific collaboration<br />
functionality. A possibility for work<strong>in</strong>g cooperatively with Amira<br />
is us<strong>in</strong>g Microsoft’s NetMeet<strong>in</strong>g. NetMeet<strong>in</strong>g offers features such<br />
as white board<strong>in</strong>g and application shar<strong>in</strong>g. Microsoft stopped development<br />
work on NetMeet<strong>in</strong>g <strong>in</strong> 2003 and <strong>in</strong>stead pushed Office<br />
Live Meet<strong>in</strong>g, formerly known as PlaceWare.<br />
A generic solution for hardware-accelerated remote visualization<br />
from [Stegmaier et al. 2002] works transparently for all OpenGLbased<br />
applications and OpenGL-based scene graphs and does not<br />
require any modifications of exist<strong>in</strong>g applications. They use a similar<br />
approach as [Richardson et al. 1998] <strong>in</strong> their paper virtual network<br />
comput<strong>in</strong>g. [Ma and Camp 2000] developed a solution for<br />
remote visualization of time-vary<strong>in</strong>g data over wide area networks.<br />
This system <strong>in</strong>volves a display daemon and a display <strong>in</strong>terface.<br />
Data from the renderer is automatically compressed, transported<br />
and afterwards decompressed. By us<strong>in</strong>g a custom transport method,<br />
they are able to employ arbitrary compression techniques. In [Engel<br />
et al. 2000] Engel et al. describe a visualization system that uses<br />
image compression technologies for transport<strong>in</strong>g visualization data<br />
from a server to a client computer. The visualization parameters and<br />
GUI events from the clients are applied to the server application <strong>by</strong><br />
send<strong>in</strong>g CORBA requests.<br />
An extensive overview of distributed and collaborative visualization<br />
and the available systems gave [Brodlie et al. 2004] <strong>in</strong> their<br />
talk at Eurographics 2003. Their gViz project [Wood et al. 2003]<br />
aims to provide today’s scientists with visualization software that<br />
works with<strong>in</strong> modern Grid environments. A major idea is the Gridenabl<strong>in</strong>g<br />
of exist<strong>in</strong>g visualization systems. Therefor IRIS Explorer,<br />
a modular visualization environment, was extended. Now, a number<br />
of scientist at different locations can jo<strong>in</strong> <strong>in</strong> a collaborative visualization<br />
session. [Rid<strong>in</strong>g et al. 2005] present a Grid-based abstract<br />
visualization system for applications scientists. Comparable<br />
to Eskimo the user <strong>in</strong>terface consists of two components; one for<br />
controll<strong>in</strong>g the pipel<strong>in</strong>e parameters <strong>by</strong> means of the gViz computational<br />
steer<strong>in</strong>g library, and one to display the visualization output.<br />
GVK (Grid <strong>Visualization</strong> Kernel), which addresses the connection<br />
of grid applications and visualization clients on the grid, was <strong>in</strong>fluenced<br />
and motivated <strong>by</strong> the common grid services approach as<br />
described <strong>in</strong> the scope of the OGSA (Open Grid Service Architecture)<br />
[Foster et al. 2002]. The concept of GVK and its core functionality<br />
for grid visualization can be found <strong>in</strong> [Kranzlmuller et al.<br />
2004]. The <strong>in</strong>frastructure of GVK features a portal for arbitrary<br />
simulation servers and visualization clients, while the actual pro-<br />
cess<strong>in</strong>g of the visualization pipel<strong>in</strong>e is transparently performed on<br />
the available grid resources.<br />
After present<strong>in</strong>g automatic distribution of render<strong>in</strong>g workloads <strong>in</strong><br />
a Grid enabled collaborative visualization environment <strong>in</strong> [Grimstead<br />
et al. 2004], Grimstead et. al. use <strong>in</strong> [Grimstead et al. 2005]<br />
their distributed collaboration Grid enabled visualization environment<br />
called RAVE (Resource-Aware <strong>Visualization</strong> Environment) to<br />
collaborate with wireless PDA. RAVE supports on one hand active<br />
clients (computers with graphics processor) and on the other hand<br />
th<strong>in</strong> clients (computer with no or modest local render resources).<br />
Clifton shows <strong>in</strong> [Presser 2005] a Java web application for allow<strong>in</strong>g<br />
multiuser collaboration and exploration of exist<strong>in</strong>g VRML worlds.<br />
For this solution no Java is necessary at the client side, only a web<br />
browser with a VRML plug-<strong>in</strong> that support ECMAscript has to be<br />
<strong>in</strong>stalled.<br />
The CoVis project (learn<strong>in</strong>g through collaborative visualization)<br />
was f<strong>in</strong>ished 1998 at the Northwestern University [Ramamurthy<br />
et al. 1995]. A pr<strong>in</strong>cipal purpose of the project is the use of new<br />
technologies for the extension and improvement of the learn<strong>in</strong>g<br />
possibilities for humans. Technically the project offers a collection<br />
of tools that can be divided <strong>in</strong>to two fundamental areas, collaborative<br />
communication tools and tools for scientific visualizations.<br />
The visualization tools can be started from the network, but deliver<br />
no direct mechanisms for collaborative work. Habanero [Chabert<br />
et al. 1998], which was developed at the Software Development<br />
Division at the NCSA (National Center for Supercomput<strong>in</strong>g Applications),<br />
offers a framework-architecture for the production of<br />
cooperative environments based on Java. Habanero br<strong>in</strong>gs along<br />
some tools like a whiteboard, telnet, and audio chat. After connect<strong>in</strong>g<br />
to a server the user can open his/her own session or jo<strong>in</strong> already<br />
exist<strong>in</strong>g sessions, where active sessions are presented <strong>in</strong> a list for<br />
selection. There are no authorization or cooperation mechanisms.<br />
OpenGL Vizserver from SGI [Sil 2005] is a client-server system<br />
that allows users to remotely view and <strong>in</strong>teract with large data sets<br />
from any other system at any location <strong>in</strong> an organization and to collaborate<br />
with multiple colleagues us<strong>in</strong>g the same application data.<br />
The three-dimensional rendered scenes are transported as streams<br />
of compressed pictures from the server to the <strong>in</strong>dividual clients.<br />
There exist already some <strong>in</strong>terest<strong>in</strong>g visualization systems for cooperative<br />
work. <strong>Visualization</strong> systems and frameworks <strong>in</strong> the past<br />
ma<strong>in</strong>ly focused on the visualization itself, on handl<strong>in</strong>g the data that<br />
have to be visualized, and on provid<strong>in</strong>g distribution functionality.<br />
Some systems also featured collaboration, e.g. CoVis and Habanero,<br />
but both were discont<strong>in</strong>ued a few years ago. Today, SGI<br />
Vizserver is the outstand<strong>in</strong>g system for perform<strong>in</strong>g cooperative distributed<br />
visualization. Compar<strong>in</strong>g available systems and our list<br />
of requirements we had to conclude that no s<strong>in</strong>gle system fits our<br />
needs.<br />
4 Scenario of Use<br />
Two spatial separated doma<strong>in</strong> specialists (<strong>in</strong> our case geologists)<br />
try to understand the same climate phenomenon. Follow<strong>in</strong>g the old<br />
fashioned way, the scientists would have to communicate sequentially,<br />
accord<strong>in</strong>g to workflow specified earlier. This can be realized<br />
e.g. <strong>by</strong> email. In the beg<strong>in</strong>n<strong>in</strong>g, a visualization expert processes the<br />
data set <strong>in</strong>to a mean<strong>in</strong>gful representation. Then, the result<strong>in</strong>g representation<br />
will be delivered to the two geologists. Now, the representation<br />
is analyzed and discussed <strong>by</strong> the geologists. Additional enhancements<br />
will be made <strong>by</strong> a visualization expert. Aga<strong>in</strong>, the geologists<br />
will discuss the phenomena asynchronously via email. This<br />
procedure will be repeated until the geologists are satisfied with the
esults. F<strong>in</strong>ally, the results have to be stored and distributed to other<br />
scientists. As a f<strong>in</strong>al step the scientists publish their results. They<br />
would have to manually create a web page <strong>in</strong>clud<strong>in</strong>g the pictures,<br />
annotations, and any meta-data. Overall this suspended process is a<br />
very time consum<strong>in</strong>g cooperation task.<br />
Us<strong>in</strong>g our system the doma<strong>in</strong> specialists and the visualization expert<br />
work <strong>in</strong> one shared workspace (see Figure 1). The workspace<br />
is presented with<strong>in</strong> a whiteboard, allow<strong>in</strong>g graphical edit<strong>in</strong>g and annotat<strong>in</strong>g<br />
of the embedded objects. All objects are persistently stored<br />
on a CSCW server. A remote visualization system renders a threedimensional<br />
representation of the data set <strong>in</strong>to an <strong>in</strong>teractive object.<br />
The visualization object is visible as an <strong>in</strong>teractive picture embedded<br />
<strong>in</strong> the shared workspace, which can be manipulated as any other<br />
object. Additionally, the visualization object may be attached with<br />
control panels for manipulat<strong>in</strong>g the visualization. These <strong>in</strong>clude a<br />
navigation pane, a moderation pane, and a preference pane.<br />
It is possible to create snapshots from the actual scene and store<br />
them <strong>in</strong> the shared workspace. Measurements of s<strong>in</strong>gle data entities<br />
with<strong>in</strong> the data set can be selected and stored as a cooperation<br />
object. These features help the doma<strong>in</strong> specialists to exchange their<br />
ideas while work<strong>in</strong>g with the representation. The exchange itself<br />
can be realized <strong>by</strong> stor<strong>in</strong>g <strong>in</strong>terest<strong>in</strong>g visual bookmarks to the scene<br />
and annotat<strong>in</strong>g them.<br />
An embedded chat facility derived from the CSCW system allows<br />
communication while cooperatively explor<strong>in</strong>g the visualization.<br />
Additionally, to coord<strong>in</strong>ate the exploration of the shared visualization,<br />
users may use the moderation function, which allows<br />
reserv<strong>in</strong>g timeslots for exclusive navigation <strong>in</strong> the scene. The results<br />
of the visualization process may be published on the fly <strong>in</strong><br />
form of a website at any time of the process. For this purpose<br />
the CSCW server generates a website conta<strong>in</strong><strong>in</strong>g the objects <strong>in</strong> the<br />
shared workspace, e.g. the annotated screenshots. On a reload,<br />
the website changes dynamically as a result of the changes <strong>in</strong> the<br />
whiteboard.<br />
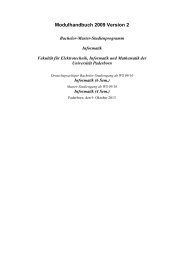
Figure 4: openVisaar Java client.<br />
5 The New <strong>Visualization</strong> Framework<br />
As mentioned <strong>in</strong> the <strong>in</strong>troduction, until now we developed two different<br />
visualization systems. Our new approach is more than only a<br />
toolkit for generat<strong>in</strong>g and display<strong>in</strong>g <strong>in</strong>teractive three-dimensional<br />
visualizations of geographical and meteorological data. open-<br />
Visaar, which is the name of our latest development, can be used to<br />
present all k<strong>in</strong>ds of <strong>in</strong>teractive visualizations. To achieve this, only<br />
a few adaptations have to be made to the server and the client software.<br />
Nearly all changes at the client side can be provided directly<br />
<strong>by</strong> the server <strong>by</strong> send<strong>in</strong>g all relevant data like menus and toolbars to<br />
the client. Therefore the user does not have to <strong>in</strong>stall a new version<br />
of his client program. He is able to use the same client software<br />
for different types of visualizations, e.g. geographical or medical<br />
visualizations.<br />
The visualization framework offers a server-client based architecture,<br />
at which the server is responsible for the scene graph management,<br />
user management, and communication. The client application<br />
only displays a video stream of the scene rendered <strong>in</strong> realtime<br />
and delivers functionality for <strong>in</strong>teraction and navigation. The<br />
server/cluster side is completely written <strong>in</strong> C++ to obta<strong>in</strong> the highest<br />
performance that is necessary for high quality three-dimensional<br />
visualizations, whereas the client is completely written <strong>in</strong> Java.<br />
The user <strong>in</strong>terface of openVisaar (see Figure 4) is based on Java and<br />
Sw<strong>in</strong>g. Because of us<strong>in</strong>g Sw<strong>in</strong>g and Sk<strong>in</strong>LF (www.l2fprod.com)<br />
the Look and Feel of the graphical user <strong>in</strong>terface can be changed<br />
and modified easily. By only edit<strong>in</strong>g the XML file that represents<br />
the Sk<strong>in</strong>LF sk<strong>in</strong>, a modification of the sk<strong>in</strong> can be made.<br />
openVisaar uses OpenSG [Re<strong>in</strong>ers et al. 2002] for the render<strong>in</strong>g of<br />
the three-dimensional view. OpenSG (Open Source Scene Graph)<br />
is a portable scene graph system to create real-time graphics programs.<br />
Actually the OpenSG server-client architecture was designed<br />
to distribute the scene graph <strong>in</strong> only one direction, e.g. for<br />
render<strong>in</strong>g different views of a cave or power wall on separate computers.<br />
To provide additional cooperation functionality the orig<strong>in</strong>al<br />
unidirectional protocol of OpenSG was extended to a bidirectional<br />
one. As a result, miscellaneous OpenSG applications, runn<strong>in</strong>g on<br />
various computers, are able to communicate with each other <strong>in</strong> both<br />
directions. One important feature of our visualization software is<br />
the platform <strong>in</strong>dependence. Indeed, OpenSG is available for various<br />
platforms like Microsoft W<strong>in</strong>dows, Mac OS X, SGI Irix and<br />
different L<strong>in</strong>ux derivates. But after all, users have to <strong>in</strong>stall the<br />
OpenSG package if they want to use our visualization framework.<br />
Furthermore, we want to provide remote visualization functionality.<br />
Therefore, <strong>in</strong> addition to the OpenSG package, real-time video<br />
encoder software and a video-stream<strong>in</strong>g server are <strong>in</strong>stalled on each<br />
computer of the visualization cluster. This means that openVisaar<br />
is part of a framework that enables the transport of real-time generated<br />
visualizations from a server to a client computer <strong>by</strong> simply<br />
grabb<strong>in</strong>g the OpenGL framebuffer of the OpenSG based server application.<br />
The grabbed images will be sent through a virtual video<br />
device to a video encod<strong>in</strong>g software.<br />
The virtual video device is realized with the Video4L<strong>in</strong>ux Loopback<br />
Driver. This driver implements a video pipe us<strong>in</strong>g two<br />
Video4L<strong>in</strong>ux devices. The program supply<strong>in</strong>g the data uses the<br />
first device. The second device acts as a normal Video4L<strong>in</strong>ux device.<br />
It is utilizable <strong>by</strong> any application that fulfills the Video4L<strong>in</strong>ux<br />
specifications.<br />
The encod<strong>in</strong>g of the video stream is done with the MP4Live server<br />
of the MPEG4IP package [Mackie 2002]. The MPEG4IP project<br />
was started <strong>by</strong> Cisco’s Technology Center to further the adoption<br />
of audio and video stream<strong>in</strong>g standards and to serve as a toolkit<br />
to track the ISMA (Internet Stream<strong>in</strong>g Media Alliance) specifications<br />
and requirements. MPEG4IP provides an end-to-end system<br />
to explore MPEG-4 multimedia. The MPEG4IP package <strong>in</strong>cludes<br />
many exist<strong>in</strong>g open source packages and offers the possibilities of<br />
<strong>in</strong>tegrat<strong>in</strong>g them. MPEG4IP is a tool for stream<strong>in</strong>g video and audio<br />
that are standards-oriented and free from proprietary protocols and<br />
extensions. It is available for L<strong>in</strong>ux, Microsoft W<strong>in</strong>dows, Mac OS<br />
X and SGI Irix. One component of the MPEG4IP package is the<br />
MP4Live server. The MP4Live server is able to produce MPEG-4<br />
conform video streams <strong>in</strong> real-time.<br />
Additionally, our framework uses the Apple Darw<strong>in</strong> Stream<strong>in</strong>g<br />
Server to multicast the encoded ISO compliant MPEG-4 stream
from the server to the client. The Apple Darw<strong>in</strong> Stream<strong>in</strong>g Server<br />
(developer.apple.com/darw<strong>in</strong>/) is a server technology, which allows<br />
send<strong>in</strong>g stream<strong>in</strong>g video data to clients across the Internet us<strong>in</strong>g the<br />
<strong>in</strong>dustry standard RTP (<strong>Real</strong>-<strong>Time</strong> Transport Protocol) and RTSP<br />
(<strong>Real</strong>-<strong>Time</strong> Stream<strong>in</strong>g Protocol).<br />
There are different possibilities for the video playback; we prefer<br />
an embedded Apple Quick<strong>Time</strong> Player canvas, s<strong>in</strong>ce it provides all<br />
features of a common Java canvas. Another method is to download<br />
a dynamic l<strong>in</strong>k library based on the MP4Player. The MP4Player<br />
is part of the MPEG4IP package. The MP4Player supports different<br />
video/audio codecs and RTP/RTSP. This library is completely<br />
written <strong>in</strong> C++. The complete communication between the client<br />
software and the video player library is done <strong>by</strong> us<strong>in</strong>g JNI (Java<br />
Native Interface). The player library generates a frame with the<br />
video stream that is delivered <strong>by</strong> the server. This frame can be <strong>in</strong>tegrated<br />
<strong>in</strong> our Java-based client as shown <strong>in</strong> Figure 4 on the right<br />
side.<br />
The architecture of the openVisaar framework is shown <strong>in</strong> Figure 5.<br />
In the diagram two further clients are shown, which will be presented<br />
<strong>in</strong> the next chapter. Until now only the first client (Java<br />
Client at the top of Figure 5 or <strong>in</strong> Figure 4) was <strong>in</strong>troduced.<br />
Figure 5: Architecture of openVisaar.<br />
Their exists the possibility to view the delivered video stream with<br />
a common MPEG-4 video player (even embedded <strong>in</strong> a web page),<br />
if the user does not want to download any extra software package.<br />
Tests with the MP4Player, the Apple Quick<strong>Time</strong> player and the <strong>Real</strong>Player<br />
from <strong>Real</strong>Networks delivered positive results. Thus, <strong>in</strong><br />
pr<strong>in</strong>ciple, all RTSP capable video player software, which supports<br />
ISO compliant MPEG-4 video streams, can be used for the realtime<br />
decod<strong>in</strong>g at the client side. Of course, for a non-video based<br />
solution the OpenSG based server can directly be started at the remote/client<br />
side. In fast networks with a high bandwidth and low<br />
latency a direct <strong>in</strong>teraction and accurate navigation <strong>in</strong> the threedimensional<br />
scene is possible (this is not limited to local networks,<br />
also high bandwidth <strong>in</strong>ternet connections like ADSL (Asynchronous<br />
Digital Subscriber L<strong>in</strong>e) can be used).<br />
openVisaar allows every collaborator to move the view<strong>in</strong>g position<br />
and to change the view<strong>in</strong>g angle to ga<strong>in</strong> better comprehension of<br />
the displayed data and to look at details. Different visualization<br />
techniques can be altered and changed <strong>in</strong>dividually, attachments<br />
and notes can be made at any three-dimensional po<strong>in</strong>t, and high<br />
quality screenshots can be grabbed of a dist<strong>in</strong>guished viewport.<br />
The different collaborators can change all visualization techniques<br />
and parameters. In this case, techniques and objects that are be<strong>in</strong>g<br />
changed <strong>by</strong> one of the users are locked for all other users.<br />
There are two possibilities for a cooperative work scenario. In the<br />
first one a moderator controls all <strong>in</strong>teraction of the users and gives<br />
the moderation to dist<strong>in</strong>guished ones. In the second scenario all<br />
users are coequal. This means that an <strong>in</strong>dividual user can make<br />
attachments, make annotations, or enable visualization techniques<br />
whenever and wherever s/he wants. Objects will be locked <strong>by</strong> the<br />
user manager and respectively <strong>by</strong> the SceneServer to avoid a coeval<br />
chang<strong>in</strong>g of any object <strong>in</strong> the three-dimensional scene. The other<br />
cooperation partners will be <strong>in</strong>formed and also the objects will be<br />
signed as unchangeable until a user has completed his work. Depend<strong>in</strong>g<br />
on their rights, <strong>in</strong>dividual users are restricted <strong>in</strong> their <strong>in</strong>teraction<br />
possibilities. Specific menus, tabs, control elements, and<br />
navigation elements will only be enabled and made visible <strong>in</strong> the<br />
Java client after the rights were checked <strong>by</strong> the user manager. The<br />
navigation itself can be controlled <strong>by</strong> us<strong>in</strong>g the navigation control<br />
element (see Figure 4 left side) or <strong>by</strong> directly <strong>in</strong>teract<strong>in</strong>g on the<br />
video panel. There are three different types of mouse navigators<br />
available; trackball, walk and fly.<br />
F<strong>in</strong>ally we present some of the visualization techniques that are<br />
supported <strong>by</strong> our openVisaar visualization framework so far. In<br />
addition to the features provided <strong>by</strong> OpenSG and OpenSG Plus,<br />
like low level base functionality, large scene support with methods<br />
for efficiently handl<strong>in</strong>g large scene models, high level primitives<br />
that provide complex primitives (e.g. free-form surfaces and volume<br />
data), and high level shad<strong>in</strong>g enabl<strong>in</strong>g new render<strong>in</strong>g qualities<br />
through efficient hardware use, we implemented a lot of important<br />
algorithms for utiliz<strong>in</strong>g a wide range of well-known visualization<br />
techniques (see Figure 4, 5, 6). E.g. height fields, particles, streaml<strong>in</strong>es,<br />
stream ribbons, and simple geometric objects for display<strong>in</strong>g<br />
build<strong>in</strong>gs and/or trees are available. Furthermore, we support particle<br />
trac<strong>in</strong>g, direct volume render<strong>in</strong>g, large texture maps, isosurface<br />
render<strong>in</strong>g [Goetz et al. 2005b], and even po<strong>in</strong>t-based render<strong>in</strong>g<br />
[Goetz et al. 2005a] <strong>in</strong> a hardware accelerated manner. All of<br />
these methods are implemented as normal OpenSG NodeCores and<br />
can be arbitrarily comb<strong>in</strong>ed to ga<strong>in</strong> a better view of the meteorological<br />
data. Even these techniques can be comb<strong>in</strong>ed among each<br />
other, e.g. to comb<strong>in</strong>e po<strong>in</strong>t-based and polygon-based objects for<br />
a mixed level-of-detail. In this case an object at a far distance is<br />
rendered as po<strong>in</strong>ts, whereas at a near distance us<strong>in</strong>g a triangle representation<br />
renders the same object. While us<strong>in</strong>g large texture maps<br />
(a few giga<strong>by</strong>tes of image data), e.g. to render a high quality earth<br />
globe, a dynamic cach<strong>in</strong>g method that supports mip mapp<strong>in</strong>g, bump<br />
mapp<strong>in</strong>g, and texture compression is available.<br />
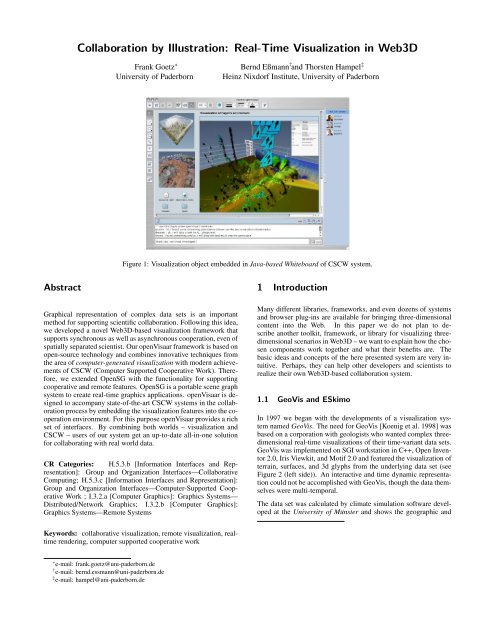
Now we want to take a closer look at specific visualization techniques<br />
of openVisaar. The underly<strong>in</strong>g terra<strong>in</strong> data and the result<strong>in</strong>g<br />
model data is displayed <strong>in</strong> a three-dimensional space. Build<strong>in</strong>gs <strong>in</strong><br />
the landscape are represented as boxes or as simplified houses on a<br />
surface. Textures are used to show differences <strong>in</strong> land usage. Color<br />
can show differences <strong>in</strong> height or <strong>in</strong> ground temperature.<br />
Abstract glyphs are used to show air attributes like w<strong>in</strong>d speed,<br />
direction, and temperature. Glyphs (<strong>in</strong> other contexts also called<br />
icons) are graphical objects. Their attributes – like position, shape,<br />
color, size etc. – can be connected to data variables. The design<br />
of glyphs follows strict guidel<strong>in</strong>es <strong>in</strong> the creation of expressive and<br />
effective visualizations. Data model and visualization goals are the<br />
basis on which several glyph types were developed and evaluated
efore decid<strong>in</strong>g on a special shape and attributes. In our approach<br />
we use a w<strong>in</strong>d tube with an additional ra<strong>in</strong>drop as three-dimensional<br />
glyph (see Figure 4). Our glyph can show different scalar variables<br />
like temperature, pressure, moisture, and w<strong>in</strong>d velocity depend<strong>in</strong>g<br />
on its position and the currently viewed time step. The glyph is<br />
po<strong>in</strong>t<strong>in</strong>g <strong>in</strong> the direction result<strong>in</strong>g from the three w<strong>in</strong>d speed values.<br />
To get additional <strong>in</strong>formation from the visualized data a user<br />
has the possibility to select a glyph at a dist<strong>in</strong>guished position <strong>in</strong><br />
the three-dimensional visualization. All data values at the selected<br />
position appear immediately <strong>in</strong> the w<strong>in</strong>dow of the remote client.<br />
Figure 6: openVisaar visualization with landscape, glyphs and<br />
streaml<strong>in</strong>es.<br />
openVisaar allows the generation of as many streaml<strong>in</strong>es and stream<br />
ribbons as needed. Particles can be <strong>in</strong>serted <strong>by</strong> plac<strong>in</strong>g an emitter<br />
at an arbitrary position <strong>in</strong> the volume data set. Then streaml<strong>in</strong>es<br />
and/or particles as po<strong>in</strong>ts or small triangles will be calculated and<br />
animated <strong>in</strong> real-time for static or time-vary<strong>in</strong>g time steps. The best<br />
way to display streaml<strong>in</strong>es and particles is to comb<strong>in</strong>e them with<br />
other visualization techniques. The particle system can be used to<br />
simulate mov<strong>in</strong>g clouds that are generated from the air moisture<br />
data of different time steps.<br />
The hardware accelerated direct volume render<strong>in</strong>g, particle trac<strong>in</strong>g<br />
and isosurface render<strong>in</strong>g can be even used to display time vary<strong>in</strong>g<br />
data sets <strong>in</strong> real-time <strong>in</strong> order to receive a better understand<strong>in</strong>g of<br />
the temporal change.<br />
These are the basic features of the openVisaar visualization framework,<br />
which was first <strong>in</strong>troduced <strong>in</strong> [Goetz and Domik 2004]. In<br />
the next chapter the new achieved functionality <strong>by</strong> <strong>in</strong>tegrat<strong>in</strong>g our<br />
framework <strong>in</strong>to an exist<strong>in</strong>g CSCW system is described <strong>in</strong> detail.<br />
6 Embedd<strong>in</strong>g openVisaar <strong>in</strong>to sTeam<br />
To deliver the whole functionality of the server to the client, every<br />
visualization technique of the framework and all functions of the<br />
visualization framework itself have to offer an <strong>in</strong>terface to receive<br />
and send all important parameters from the server to the client and<br />
vice versa. The user at the client computer can modify the values of<br />
these parameters. For the mouse navigation and <strong>in</strong>teraction <strong>in</strong> the<br />
rendered scene all parameters have to be sent from the client computer<br />
to the server <strong>by</strong> us<strong>in</strong>g the exist<strong>in</strong>g connection. Furthermore<br />
all menus, toolbars and popup w<strong>in</strong>dows offer functionality to control<br />
the specified visualization technique and sett<strong>in</strong>gs to def<strong>in</strong>e the<br />
appearance of the different visualizations. The server program has<br />
the ability to change the look and feel of the graphical user <strong>in</strong>terface<br />
at the client side. Here, new functionality <strong>in</strong> the server program can<br />
be made available to the user at run-time without an explicit update<br />
of the client software.<br />
In our comb<strong>in</strong>ed solution the collaborative functionality (user management,<br />
access rights, off-the-visualization annotation and structur<strong>in</strong>g)<br />
is provided <strong>by</strong> the sTeam CSCW system [Hampel and Keil-<br />
Slawik 2002], the visualization is provided <strong>by</strong> the openVisaar visualization<br />
framework (see Figure 7). sTeam has its own protocol<br />
called COAL (Client Object Access Layer) that is used for the communication<br />
between the sTeam server and the sTeam clients, e.g.<br />
whiteboard or web browser. Also the communication between the<br />
openVisaar SceneServer and the sTeam server was realized with the<br />
COAL protocol. The communication between the SceneServer and<br />
an <strong>in</strong>dividual SceneRenderer is still done <strong>by</strong> us<strong>in</strong>g TCP/IP.<br />
The sTeam server provides the cooperation functionality. The<br />
server consists of an object repository, which is stored <strong>in</strong> a relational<br />
database and a core that manages the access to the stored cooperation<br />
objects. This <strong>in</strong>cludes an event system. Clients may register<br />
changes of objects. In case of a change the clients will be notified<br />
<strong>by</strong> the system. This allows them to react directly to changes of any<br />
object <strong>in</strong> the cooperation system. The core provides the rights management<br />
for access<strong>in</strong>g the object <strong>by</strong> us<strong>in</strong>g ACLs (Access Control<br />
Lists). This allows a flexible access right structure.<br />
The visualization objects are embedded as a video stream (a k<strong>in</strong>d of<br />
<strong>in</strong>teractive picture) <strong>in</strong> the sTeam whiteboard as shown <strong>in</strong> Figure 1<br />
on the first page of this paper. The remote render<strong>in</strong>g and video<br />
stream<strong>in</strong>g is realized with openVisaar. As mentioned before open-<br />
Visaar is an OpenSG based visualization framework that is able to<br />
multicast <strong>in</strong> real-time rendered three-dimensional visualizations as<br />
MPEG-4 compliant video streams us<strong>in</strong>g RTSP [Goetz and Domik<br />
2003]. The openVisaar server coord<strong>in</strong>ates the whole visualization<br />
process. Each node of the visualization cluster is able to render and<br />
encode a viewpo<strong>in</strong>t <strong>in</strong>dependent three-dimensional graphical representation<br />
for one connected client. The visualization of the data<br />
itself is rendered <strong>in</strong> the same way on all render nodes (SceneRenderer),<br />
but a choice between different or synchronized views is possible.<br />
Figure 7: Architecture of the <strong>in</strong>tegrative cooperative visualization<br />
system.<br />
6.1 A Closer Look at openVisaar<br />
If we take a closer look at openVisaar, we have to divide it <strong>in</strong>to<br />
two parts. On the one side there is the server, normally a cluster
composed of a few powerful computers, equipped with up-to-date<br />
graphics accelerator boards and appropriate ma<strong>in</strong> memory. On the<br />
other side there is the client, most times the computer of the user.<br />
This can be a standard pc, laptop, or handheld without high demands<br />
on the hardware. This is an important feature for mobile<br />
sett<strong>in</strong>gs. The only demand is that the client computer is able to<br />
decode ISO compliant MPEG-4 video streams <strong>in</strong> real-time and advantageously<br />
supports Java.<br />
Lets take a closer look at the design of the visualization framework<br />
(see Figure 5). The framework itself consists of a SceneServer<br />
that distributes the three-dimensional scene to the SceneRenderer.<br />
Each SceneRenderer is able to render from the users po<strong>in</strong>t of view,<br />
where<strong>by</strong> changes of all users are synchronized <strong>in</strong> real-time:<br />
• Both, the SceneServer and SceneRenderer use OpenSG for<br />
their scene graph management and render<strong>in</strong>g. As mentioned<br />
before OpenSG is a portable scene graph system that provides<br />
fundamental functionality to create real-time graphics<br />
programs. One central part of the OpenSG design is<br />
multithreaded asynchronous scene graph manipulation. The<br />
OpenSG data structures are set up <strong>in</strong> a way that allows multiple<br />
<strong>in</strong>dependent threads to manipulate the scene graph <strong>in</strong>dependently<br />
without <strong>in</strong>terfer<strong>in</strong>g with each other. This feature<br />
allows synchroniz<strong>in</strong>g the manipulations of each user with the<br />
manipulations of other users. F<strong>in</strong>ally, every user of the collaborative<br />
work<strong>in</strong>g community gets the same view on the current<br />
data set.<br />
• Our SceneServer manages the centrally stored scene graph.<br />
Changes are executed <strong>in</strong> agreement with the user manager.<br />
Modifications are journalized <strong>in</strong> a simple version controll<strong>in</strong>g<br />
system. On every change to the scene, the SceneServer sends<br />
synchronized messages to all SceneRenderer to update their<br />
replicated scene graph. The user manager of the SceneServer<br />
provides the elementary coord<strong>in</strong>ation functions and a simple<br />
rights management. If the remote client provokes an action<br />
message, first the user manager checks the legitimacy of the<br />
message with a check up of the exist<strong>in</strong>g rights of the user. If<br />
the check up is correct, the action message will be forwarded<br />
to the user specific SceneRenderer.<br />
• Every SceneRenderer conta<strong>in</strong>s a replicated scene graph that<br />
will be regularly updated with the scene graph of the Scene-<br />
Server. Every modification of another user can be seen immediately.<br />
The SceneRenderer generates an <strong>in</strong>dividual view<br />
of the shared visualization scene and transports it as a video<br />
stream to the remote client. Chosen user positions and orientations<br />
are sent from the remote client to the SceneRenderer<br />
to calculate correct positions and orientations for data manipulation<br />
tools, selection-marks, and text messages. All graphics<br />
are rendered <strong>in</strong>to a virtual OpenGL framebuffer. The so<br />
called pbuffer (pixel buffer) is used for hardware-accelerated<br />
off-screen render<strong>in</strong>g, followed <strong>by</strong> the grabb<strong>in</strong>g, encod<strong>in</strong>g, and<br />
send<strong>in</strong>g of the pictures as video stream. Every frame of the<br />
currently rendered picture is sent through the virtual video device<br />
to the video-encod<strong>in</strong>g server. F<strong>in</strong>ally, the MP4Live server<br />
generates a real-time video stream <strong>by</strong> us<strong>in</strong>g an ISO compliant<br />
MPEG-4 video codec. The Apple Darw<strong>in</strong> Stream<strong>in</strong>g Server<br />
(gets the encoded video stream) is a server technology, which<br />
allows send<strong>in</strong>g stream<strong>in</strong>g video data to clients across the Internet.<br />
Alternative to the Apple Darw<strong>in</strong> Stream<strong>in</strong>g Server we<br />
support the Apache Web Server. Because of security and performance<br />
issues, Apple Darw<strong>in</strong> Stream<strong>in</strong>g Server is our first<br />
choice. It is optimal, if the amount of the SceneRenderer is<br />
equal to the amount of available remote clients. Otherwise<br />
<strong>in</strong>dividual users have to share their views with other users.<br />
A s<strong>in</strong>gle sTeam object represents each data set for a specific visualization.<br />
The sTeam access control system is used for the rights<br />
management of the visualization techniques. The rights are structured<br />
<strong>in</strong> a hierarchy order. Functionality for manipulat<strong>in</strong>g the visualization<br />
becomes available accord<strong>in</strong>g to these access rights. If a<br />
cooperation partner has not the essential rights, then participation<br />
at the cooperation process is not granted.<br />
6.2 Platform Independent Video Integration<br />
For display<strong>in</strong>g the visualization as video stream on the whiteboard<br />
we chose the MPEG-4 standard, which also is used <strong>by</strong> the conventional<br />
openVisaar client. MPEG-4 (an extension of the MPEG-<br />
2 technology) is an ISO standard comb<strong>in</strong><strong>in</strong>g high-quality video<br />
stream<strong>in</strong>g with m<strong>in</strong>imal data rates [Koenen 2002]. By us<strong>in</strong>g H.264<br />
encod<strong>in</strong>g, also known as MPEG-4 part 10, it conta<strong>in</strong>s a number<br />
of new features that allow much more effective video compression<br />
and provides more flexibility for applications <strong>in</strong> a wide variety of<br />
network environments. As an open <strong>in</strong>dustry standard, anyone can<br />
create an MPEG-4 player or encoder. openVisaar uses the open<br />
source codec XviD for the encod<strong>in</strong>g of the video stream and the<br />
open source MP4Live server [Mackie 2002] for the video stream<strong>in</strong>g<br />
to the remote clients.<br />
On the client side, the video is seamlessly <strong>in</strong>tegrated <strong>in</strong>to the<br />
sTeam whiteboard as a Java and GEF (Graphical Editor Framework)<br />
[Moore et al. 2004] component avoid<strong>in</strong>g media discont<strong>in</strong>uities<br />
<strong>in</strong> the cooperation process and allow<strong>in</strong>g direct <strong>in</strong>teraction with<br />
the visualization scene. Two different k<strong>in</strong>ds of <strong>in</strong>tegrations were<br />
realized:<br />
1. Integration of an openVisaar object <strong>in</strong>to the old Java-based<br />
sTeam whiteboard us<strong>in</strong>g Apple Quick<strong>Time</strong> for Java as video<br />
decoder (see Figure 1)<br />
2. Integration of an openVisaar object <strong>in</strong>to the new Eclipsebased<br />
sTeam whiteboard us<strong>in</strong>g a pure Java-based MPEG-4<br />
video decoder (see Figure 8)<br />
Figure 8: The Eclipse-based Whiteboard with its standard components:<br />
whiteboard view (1), user view (2), and chat (3), extended<br />
with the new visualization plug-<strong>in</strong>s (visualization object (4), visualization<br />
bookmark objects (5), navigation control (6) and visualization<br />
preferences (7)).<br />
The standalone version of the openVisaar client and the one embedded<br />
<strong>in</strong>to the old sTeam whiteboard use Apple Quick<strong>Time</strong> SDK
for <strong>in</strong>tegrat<strong>in</strong>g video stream<strong>in</strong>g <strong>in</strong>to the graphical user <strong>in</strong>terface.<br />
Apple’s Quick<strong>Time</strong> SDK provides good support for high quality<br />
MPEG-4 decod<strong>in</strong>g with low CPU (Central Processor Unit) usage,<br />
but it is based on platform dependent runtime libraries. It was chosen,<br />
because Sun’s Java Media Framework platform <strong>in</strong>dependent<br />
video stream<strong>in</strong>g lacks support for efficient stream<strong>in</strong>g protocols and<br />
formats like RTSP and MPEG-4.<br />
In our latest approach we use IBM Toolkit for MPEG-4. It is based<br />
on pure Java code and is therefore platform <strong>in</strong>dependent. Plus,<br />
it provides decod<strong>in</strong>g facilities fast enough for our purposes. The<br />
drawback is the miss<strong>in</strong>g support of off-screen render<strong>in</strong>g, which is<br />
necessary to nest video stream<strong>in</strong>g <strong>in</strong>to GEF components. This leads<br />
to the problem that additional to the video rendered <strong>in</strong>to a GEF<br />
component, there exists always a source w<strong>in</strong>dow provid<strong>in</strong>g the decoded<br />
picture. While no other solution is available at the moment,<br />
this w<strong>in</strong>dow is switched to the background or is m<strong>in</strong>imized after<br />
creation. In addition, Quick<strong>Time</strong> is <strong>in</strong>tegrated as an alternative render<strong>in</strong>g<br />
technique.<br />
6.3 Adaptations to openVisaar Client<br />
The openVisaar client was orig<strong>in</strong>ally implemented as a standalone<br />
client, us<strong>in</strong>g Sun’s Sw<strong>in</strong>g components for provid<strong>in</strong>g the GUI. To<br />
adapt the functionality of this client to the novel whiteboard plug<strong>in</strong>,<br />
large parts had to be reimplemented from scratch. First the user<br />
<strong>in</strong>terface had to be adapted to the Eclipse SWT (Standard Widget<br />
Toolkit). Here the separation of the user <strong>in</strong>terface code and the<br />
functional code <strong>in</strong> the openVisaar client application proved useful.<br />
A redesign of the code for manag<strong>in</strong>g connections to the openVisaar<br />
SceneServer and for handl<strong>in</strong>g remote events was necessary. These<br />
code supported one-to-one connections only, because the client operated<br />
<strong>in</strong> an SDI (S<strong>in</strong>gle Document Interface) like way. In conjunction<br />
with sTeam, one workspace can conta<strong>in</strong> multiple open-<br />
Visaar objects. Therefore multiple connections based on the same<br />
environment must be supported. F<strong>in</strong>ally, we used the provided<br />
extension-po<strong>in</strong>t mechanism to extend the Java-based and Eclipsebased<br />
whiteboard clients with a new component for display<strong>in</strong>g the<br />
visualization. This component handles the complete graphical representation<br />
of our openVisaar based visualization object with<strong>in</strong> a<br />
sTeam area.<br />
7 Results<br />
Approaches like presented <strong>in</strong> this paper suffer under the complexity<br />
of the <strong>in</strong>tegrated software packages and used protocols. For example,<br />
just the openVisaar framework bases on fifty non-standard<br />
packages <strong>in</strong>stalled on the server side. Furthermore, us<strong>in</strong>g different<br />
software packages and libraries poses the question of the overall<br />
performance.<br />
In this section we present some results of the render<strong>in</strong>g and encod<strong>in</strong>g<br />
performances, frame rates, image quality, and latency of the<br />
video stream<strong>in</strong>g. Of course, most measured values depend on the<br />
hardware configuration, e.g. computational power or network bandwidth.<br />
To overcome the problem of more collaborators than available<br />
SceneRenderers at the server side, it is possible to share one view<br />
on the three-dimensional scene. Therefor, only a s<strong>in</strong>gle SceneRenderer<br />
is necessary for the render<strong>in</strong>g. In this case the moderation<br />
modus should be used <strong>in</strong> order to coord<strong>in</strong>ate simultaneous actions<br />
of different users. To deliver the video to all clients without send<strong>in</strong>g<br />
it more than one time, multicast<strong>in</strong>g must be enabled. Today,<br />
this is no problem if a powerful backbone with up-to-date routers<br />
is used. The multicast video streams often can be received even<br />
us<strong>in</strong>g network connections provided <strong>by</strong> local ISPs (Internet Service<br />
Providers), as our tests showed.<br />
7.1 Render<strong>in</strong>g Performance<br />
The render<strong>in</strong>g works <strong>in</strong> the same way as on a local computer, hence<br />
it depends on computational power of the CPU and GPU. Us<strong>in</strong>g<br />
graphics hardware accelerated algorithms, we can e.g. render up<br />
to 1.000.000 particles or 64.000 streaml<strong>in</strong>es at an <strong>in</strong>teractive frame<br />
rate on a 2.8 GHz Intel processor with NVIDIA GeForce 6600GT<br />
graphics card. The more computational power a render<strong>in</strong>g node<br />
(SceneRenderer) provides, the more complex the three-dimensional<br />
scene can be. By us<strong>in</strong>g frameworks like Chromium [Humphreys<br />
et al. 2002] it is even possible to use a cluster as back-end for render<strong>in</strong>g<br />
or simulation.<br />
7.2 Encod<strong>in</strong>g Performance and Image Quality<br />
A major problem of our solution is that encod<strong>in</strong>g costs processor<br />
time. If you want to get high image quality, high resolution, and<br />
little kilobit rate the latest video codecs e.g. X264 (H.264) are<br />
advantageous, but they cost extra process<strong>in</strong>g time. Figure 9 depicts<br />
a comparison of the image quality of four XviD (H.263) encoded<br />
real-time video streams from 50 kilobits to 2000 kilobits.<br />
It is remarkable that the image quality barely improves with<strong>in</strong> the<br />
range from 500 kilobits to 4000 kilobits (highest encod<strong>in</strong>g rate us<strong>in</strong>g<br />
XviD). So even an ADSL connection can be used at the client<br />
side to receive video streams <strong>in</strong> a adequate quality. Nowadays, the<br />
monthly costs for a six-megabit flatrate (no extra traffic costs) are<br />
very low <strong>in</strong> Germany, even 4000 kilobits video streams are receivable.<br />
Figure 9: Image quality of the video stream at 50, 200, 500, and<br />
2000 kilobit (from top left to bottom right).<br />
At the moment our utilized computer system for each render<strong>in</strong>g<br />
node (SceneRenderer) is a Dell Precision 380 Essential with Intel<br />
Pentium D Processor 820 (two processor cores with 2.8GHz) and
NVIDIA Quadro FX540 graphics card. One core is used for the render<strong>in</strong>g<br />
of the visualization and the second core encodes the grabbed<br />
OpenGL framebuffer <strong>in</strong> real-time as video. Another possibility is<br />
to use a one-core processor <strong>in</strong> comb<strong>in</strong>ation with real-time video encod<strong>in</strong>g<br />
hardware. If the rendered scenes are not too complex and<br />
a lower kilobit rate is acceptable, even only one processor does the<br />
job. This works f<strong>in</strong>e for most of our visualization scenarios at a<br />
resolution of 352x288 pixels and an encod<strong>in</strong>g rate of 1000 kilobits.<br />
While the grabb<strong>in</strong>g of the framebuffer is very fast on up-to-date<br />
graphics card equipped with PCI Express, latency between render<strong>in</strong>g<br />
the three-dimensional scene and encod<strong>in</strong>g it as video costs only<br />
a delay one frame. This means that <strong>by</strong> render<strong>in</strong>g with a frame rate<br />
of 20 frames-per-second the latency is 50 milliseconds for this task.<br />
7.3 Latency of Video Stream<strong>in</strong>g<br />
We identified five potential places (from video encod<strong>in</strong>g to video<br />
decod<strong>in</strong>g) where latency can take place: At the MP4Live server, <strong>in</strong><br />
the kernel IP transmit stack, <strong>in</strong> the network, <strong>in</strong> the kernel IP receive<br />
stack, and <strong>in</strong> the video player.<br />
• MP4Live has very little latency. There is no latency from<br />
when the video frame is encoded with MPEG-4. With MPEG-<br />
2, the B-Frames (Bidirectional Frames) require a two-frame<br />
latency period.<br />
• The kernel IP stacks can have some latency built <strong>in</strong>. In normal<br />
case latency is very low and does not need to be considered.<br />
• Network latency will occur, as well. We made some tests <strong>in</strong><br />
Germany, us<strong>in</strong>g the University of Paderborn as backbone for<br />
the MP4Live server and an Arcor ADSL connection <strong>in</strong> Dortmund<br />
for the client (direct distance between the two cities is<br />
100 kilometers). The standard p<strong>in</strong>g time on this connection<br />
is around 40 milliseconds. Where<strong>by</strong> the signal is routed over<br />
ten hops <strong>in</strong>clud<strong>in</strong>g the two cities Frankfurt and Leipzig. The<br />
round trip of one TCP/IP packet has a complete length of 1000<br />
kilometers and differs a lot from the direct connection of the<br />
two cities. As remark, the p<strong>in</strong>g time <strong>in</strong> the <strong>in</strong>ternal network of<br />
Arcor is only 20 milliseconds. These low latencies are possible<br />
<strong>by</strong> us<strong>in</strong>g FastPath, which means to disable <strong>in</strong>terleav<strong>in</strong>g, a<br />
method for error correction <strong>in</strong> ADSL connections.<br />
• The Apple Darw<strong>in</strong> Stream<strong>in</strong>g Server <strong>in</strong>troduces another latency<br />
to the communication cha<strong>in</strong>. By disabl<strong>in</strong>g buffer<strong>in</strong>g of<br />
the video streams this latency can be reduced.<br />
• F<strong>in</strong>ally, the video player (decoder) at the client side produces<br />
latency, because often two seconds buffer<strong>in</strong>g is enabled for<br />
stream<strong>in</strong>g. This latency can also be reduced to a few milliseconds<br />
<strong>by</strong> disabl<strong>in</strong>g the buffer<strong>in</strong>g of the video player (decoder).<br />
The latency between server and client can be reduced to 100-300<br />
milliseconds us<strong>in</strong>g a LAN connection. Depend<strong>in</strong>g on traffic and<br />
collisions this time can raise up to 1.000-2.000 milliseconds, especially<br />
<strong>by</strong> us<strong>in</strong>g slow wireless LAN connections. In normal case<br />
the latency between client and server is lower than 50 milliseconds,<br />
because the network packages are very small and often consist of<br />
only a few <strong>by</strong>tes.<br />
As a workaround to high latency network connections (greater than<br />
500 milliseconds) we provide the possibility to work on previously<br />
recorded video streams <strong>in</strong> an asynchronously manner. A collaborator<br />
has the possibility to choose a start and an end po<strong>in</strong>t <strong>in</strong> the<br />
three-dimensional scene. Afterwards, a camera track is calculated<br />
and a correspond<strong>in</strong>g video is generated. This video can be annotated<br />
and used for discussion <strong>in</strong> the whiteboard <strong>in</strong> the same way as<br />
with the synchronous video streams. This method is not as powerful<br />
as the <strong>in</strong>teractive work with live streams, s<strong>in</strong>ce <strong>in</strong>-scene annotations<br />
are not possible and only the two-dimensional previously recorded<br />
video can be annotated.<br />
If the latency is below 500 milliseconds a user can work with our<br />
system <strong>in</strong> a synchronous manner. We found out that a latency below<br />
200 milliseconds is acceptable, which is the normal latency <strong>in</strong><br />
our university’s LAN (not WLAN). Collaborators us<strong>in</strong>g a high latency<br />
network connection are still able to watch the video stream<br />
and to change some attributes of the visualization. But a navigation<br />
through the three-dimensional scene becomes very difficult,<br />
because of the delayed visual response.<br />
One benefit of us<strong>in</strong>g multicast<strong>in</strong>g for provid<strong>in</strong>g video streams is<br />
that it scales very well, even for large groups of spectators. The<br />
bandwidth of the stream<strong>in</strong>g server must not <strong>in</strong>crease <strong>in</strong> the same<br />
way as the group of spectators. If the video stream is published<br />
<strong>by</strong> the collaborators, the spectators can watch the live video <strong>by</strong> just<br />
po<strong>in</strong>t<strong>in</strong>g their MPEG-4 capable video player to the stream<strong>in</strong>g server<br />
(one SceneRenderer). A very nice feature, especially for e-learn<strong>in</strong>g<br />
scenarios, where lectures present visualizations to many students.<br />
8 Conclusion<br />
Fac<strong>in</strong>g the gap between full-featured CSCW and visualization systems,<br />
this paper presents an approach towards an <strong>in</strong>tegration of a<br />
remote visualization framework <strong>in</strong>to an exist<strong>in</strong>g CSCW environment.<br />
All components are based on open libraries that can be used<br />
freely for non-commercial purposes. The visualization framework<br />
is based on a state of the art scene graph system (OpenSG) and supports<br />
remote as well as distributed render<strong>in</strong>g. By comb<strong>in</strong><strong>in</strong>g the visualization<br />
system with a sophisticated CSCW system the complete<br />
solution offers a wide range of new and unique features. Especially<br />
the cooperation facilities of the visualization system are extended<br />
<strong>in</strong> an extraord<strong>in</strong>ary way. With openVisaar plus sTeam spatially separated<br />
doma<strong>in</strong> specialists can analyze complex visualizations and<br />
organize their ga<strong>in</strong>ed <strong>in</strong>sights cooperatively <strong>by</strong> us<strong>in</strong>g the <strong>in</strong>tegrative<br />
cooperation environment. Last but not least research results can be<br />
published <strong>in</strong> an easy and seamless way. By us<strong>in</strong>g a Java based remote<br />
client, collaborators have the possibility to work spatially separated<br />
with the same visualization <strong>in</strong> <strong>Web3D</strong> and are able to share<br />
their <strong>in</strong>sights directly. Our solution uses a high quality MPEG-4<br />
conform video stream to distribute the pictures. Furthermore RTSP<br />
offers a robust protocol that can stream multimedia (video and/or<br />
audio) over multicast <strong>in</strong> one-to-many applications. This is even<br />
possible, if some users use limited computers like standard desktop<br />
computers, laptops, or handhelds. Furthermore we have a high<br />
level of security <strong>by</strong> us<strong>in</strong>g a server-based remote render<strong>in</strong>g solution<br />
with video stream<strong>in</strong>g. All cooperation partners get only encoded<br />
pictures and some selected values at dist<strong>in</strong>guished positions <strong>in</strong> the<br />
data set. There is no possibility to access the raw data set, not even<br />
at a certa<strong>in</strong> timestamp. This feature is especially important when<br />
work<strong>in</strong>g with valuable and safety-relevant data sets, which may be<br />
stolen when transmitted between hosts.<br />
As a f<strong>in</strong>al conclusion, we may state that we achieved a high level<br />
of cooperation support for visualization processes <strong>by</strong> comb<strong>in</strong><strong>in</strong>g<br />
two sophisticated systems of each doma<strong>in</strong>. The chance to improve<br />
the system <strong>in</strong> a fast and simple way <strong>by</strong> add<strong>in</strong>g several useful features<br />
shows the flexibility of this solution. In future work we will<br />
improve our system <strong>by</strong> <strong>in</strong>tegrat<strong>in</strong>g new cooperation features and<br />
more visualization techniques <strong>in</strong>to the system. In addition, we will<br />
change the focus from geography and geology to medical visualizations,<br />
s<strong>in</strong>ce one of our current cooperation partners consists primarily<br />
of radiologists.
References<br />
BERNARND, L., AND STREIT, U. 1995. Three-dimensional<br />
boundary layer model<strong>in</strong>g and gis. In GISDATA Specialist Meet<strong>in</strong>g<br />
of the ESF.<br />
BRODLIE, K. W., DUCE, D. A., GALLOP, J. R., WALTON, J. P.<br />
R. B., AND WOOD, J. D. 2004. Distributed and collaborative<br />
visualization. Computer Graphics Forum 23, 2, 223–251.<br />
CHABERT, A., GROSSMAN, E., JACKSON, K., AND PIETROVICZ,<br />
S. 1998. Ncsa habanero - synchronous collaborative framework<br />
and environment. In White Paper, Software Development Division<br />
at the National Center for Supercomput<strong>in</strong>g Applications.<br />
DOELLNER, J., AND HINRICHS, K. 2002. A generic render<strong>in</strong>g<br />
system. IEEE Transactions on <strong>Visualization</strong> and Computer<br />
Graphics 8, 2, 99–118.<br />
ENGEL, K., SOMMER, O., AND ERTL, T. 2000. A framework for<br />
<strong>in</strong>teractive hardware accelerated remote 3d visualization. In Proceed<strong>in</strong>gs<br />
of EG/IEEE TCVG Symposium on <strong>Visualization</strong> VisSym<br />
00, Eurographics Association, 167–177.<br />
FOSTER, I., KESSELMAN, C., NICK, J. M., AND TUECKE, S.<br />
2002. The physiology of the grid: An open grid services architecture<br />
for distributed system <strong>in</strong>tegration. In Open Grid Service<br />
Infrastructure WG, Global Grid Forum.<br />
GOETZ, F., AND DOMIK, G. 2003. A framework for video-based<br />
and hardware-accelerated remote 3d-visualization. In Proceed<strong>in</strong>gs<br />
of Eurographics 2003 Short Presentations, Eurographics<br />
Association, 263–269.<br />
GOETZ, F., AND DOMIK, G. 2004. openvisaar - enrich<strong>in</strong>g cooperative<br />
visualization <strong>by</strong> comb<strong>in</strong><strong>in</strong>g open technologies. In 1st<br />
International Conference on Cooperative Design, <strong>Visualization</strong><br />
and Eng<strong>in</strong>eer<strong>in</strong>g, Spr<strong>in</strong>ger-Verlag GmbH, 38–46.<br />
GOETZ, F., HILLEBRAND, L., AND DOMIK, G. 2005. Integration<br />
of po<strong>in</strong>t based render<strong>in</strong>g <strong>in</strong>to a common scene graph system. In<br />
Proceed<strong>in</strong>gs of the 5th ACTA press International Conference on<br />
<strong>Visualization</strong>, Imag<strong>in</strong>g, and Image Process<strong>in</strong>g, ACTA press.<br />
GOETZ, F., JUNKLEWITZ, T., AND DOMIK, G. 2005. <strong>Real</strong>-time<br />
march<strong>in</strong>g cubes on the vertex shader. In Proceed<strong>in</strong>gs of Eurographics<br />
2005 Short Presentations, Eurographics Association.<br />
GRIMSTEAD, I. J., AVIS, N. J., AND WALKER, D. W. 2004.<br />
Automatic distribution of render<strong>in</strong>g workloads <strong>in</strong> a grid enabled<br />
collaborative visualization environment. In Proceed<strong>in</strong>gs<br />
of ACM/IEEE conference on Supercomput<strong>in</strong>g 2004, IEEE Computer<br />
Society.<br />
GRIMSTEAD, I. J., AVIS, N. J., AND WALKER, D. W. 2005. <strong>Visualization</strong><br />
across the pond: how a wireless pda can collaborate<br />
with million-polygon datasets via 9,000km of cable. In Proceed<strong>in</strong>gs<br />
of the 10th <strong>in</strong>ternational conference on 3D Web technology,<br />
ACM Press, 47–56.<br />
HAMPEL, T., AND KEILSLAWIK, R. 2002. steam: Structur<strong>in</strong>g<br />
<strong>in</strong>formation <strong>in</strong> a team - distributed knowledge management <strong>in</strong><br />
cooperative learn<strong>in</strong>g environments. ACM Journal of Educational<br />
Resources <strong>in</strong> Comput<strong>in</strong>g 1, 2, 1–27.<br />
HESINA, G., SCHMALSTIEG, D., FUHRMANN, A., AND PUR-<br />
GATHOFER, W. 1999. Distributed open <strong>in</strong>ventor: a practical<br />
approach to distributed 3d graphics. In Proceed<strong>in</strong>gs of the ACM<br />
symposium on Virtual reality software and technology, ACM<br />
Press, 74–81.<br />
HUMPHREYS, G., HOUSTON, M., NG, R., FRANK, R., AH-<br />
ERN, S., KIRCHNER, P. D., AND KLOSOWSKI, J. T. 2002.<br />
Chromium: a stream-process<strong>in</strong>g framework for <strong>in</strong>teractive render<strong>in</strong>g<br />
on clusters. In Proceed<strong>in</strong>gs of SIGGRAPH 2002, 693–<br />
702.<br />
KOENEN, R. 2002. Mpeg-4 overview. In ISO/IEC<br />
JTC1/SC29/WG11 N4668.<br />
KOENIG, M., LENZ, C., AND DOMIK, G. 1998. <strong>Visualization</strong><br />
of meteorological data us<strong>in</strong>g an <strong>in</strong>teractive flight. In Computer<br />
Graphics International’98.<br />
KRANZLMULLER, D., HEINZLREITER, P., AND VOLKERT, J.<br />
2004. Grid-enabled visualization with gvk. In Proceed<strong>in</strong>gs<br />
of Grid Comput<strong>in</strong>g: First European Across Grids Conference,<br />
Spr<strong>in</strong>ger-Verlag GmbH, 139–146.<br />
MA, K.-L., AND CAMP, D. M. 2000. High performance visualization<br />
of time-vary<strong>in</strong>g volume data over a widearea network. In<br />
Proceed<strong>in</strong>gs of Supercomput<strong>in</strong>g 2000.<br />
MACKIE, D. 2002. Stream<strong>in</strong>g video and mpeg4ip. In Presentation<br />
of MPEG4IP at the Silicon Valley L<strong>in</strong>ux User’s Group, Cisco<br />
Technology Center, Silicon Valley, USA.<br />
MOORE, W., DEAN, D., GERBER, A., WAGENKNECHT, G., AND<br />
VANDERHEYDEN, P. 2004. Eclipse Development us<strong>in</strong>g the<br />
Graphical Edit<strong>in</strong>g Framework and the Eclipse Model<strong>in</strong>g Framework.<br />
IBM Press.<br />
PRESSER, C. G. M. 2005. A java web application for allow<strong>in</strong>g<br />
multiuser collaboration and exploration of exist<strong>in</strong>g vrml worlds.<br />
In Proceed<strong>in</strong>gs of the 10th <strong>in</strong>ternational conference on 3D Web<br />
technology, ACM Press, 85–92.<br />
RAMAMURTHY, R. K. B., WILHELMSON, R., PEA, R., GOMEZ,<br />
L. M., AND EDELSON, D. C. 1995. Covis: A national science<br />
education collaboratory. In Proceed<strong>in</strong>gs of the American<br />
Meteorological Society 4th Conference on Education jo<strong>in</strong>t with<br />
the 11th Conference on Interactive Information and Process<strong>in</strong>g<br />
Systems for Meteorology, Oceanography, and Hydrology, 15–20.<br />
REINERS, D., VOSS, G., AND BEHR, J. 2002. Opensg - basic<br />
concepts. In 1. OpenSG Symposium.<br />
RICHARDSON, T., STAFFORD-FRASER, Q., WOOD, K. R., AND<br />
HOPPER, A. 1998. Virtual network comput<strong>in</strong>g. IEEE Internet<br />
Comput<strong>in</strong>g 2, 1.<br />
RIDING, M., WOOD, J., BRODLIE, K., BROOKE, J., CHEN, M.,<br />
CHISNALL, D., HUGHES, C., JOHN, N. W., JONES, M. W.,<br />
AND ROARD, N. 2005. e-viz: Towards an <strong>in</strong>tegrated framework<br />
for high performance visualization. In Proceed<strong>in</strong>gs of the UK<br />
e-Science All Hands Meet<strong>in</strong>g 2005, EPSRC, 1026–1032.<br />
SILICON GRAPHICS INC. 2005. OpenGL Vizserver 3.1:<br />
Application-Transparent Remote Interactive <strong>Visualization</strong> and<br />
<strong>Collaboration</strong>, Technical White Paper, http://www.sgi.com.<br />
STALLING, D., ZOECKLER, M., AND HEGE, H. C., 1998. Amira,<br />
the software formerly known as hyperplan. Technical report,<br />
Konrad-Zuse-Zentrum fuer Informationstechnik Berl<strong>in</strong> (ZIB).<br />
STEGMAIER, S., MAGALLON, M., AND ERTL, T. 2002. A generic<br />
solution for hardware-accelerated remote visualization. In Proceed<strong>in</strong>gs<br />
of EG/IEEE TCVG Symposium on <strong>Visualization</strong> Vis-<br />
Sym’02, Eurographics Association.<br />
WOOD, J., BRODLIE, K., AND WALTON, J. 2003. gviz - visualization<br />
middleware for e-science. In Proceed<strong>in</strong>gs of the 14th<br />
IEEE <strong>Visualization</strong>, IEEE Computer Society.