Magnetostratigraphy of Miocene–Pliocene Zagros foreland deposits ...
Magnetostratigraphy of Miocene–Pliocene Zagros foreland deposits ...
Magnetostratigraphy of Miocene–Pliocene Zagros foreland deposits ...

You also want an ePaper? Increase the reach of your titles
YUMPU automatically turns print PDFs into web optimized ePapers that Google loves.
404<br />
S. Homke et al. / Earth and Planetary Science Letters 225 (2004) 397–410<br />
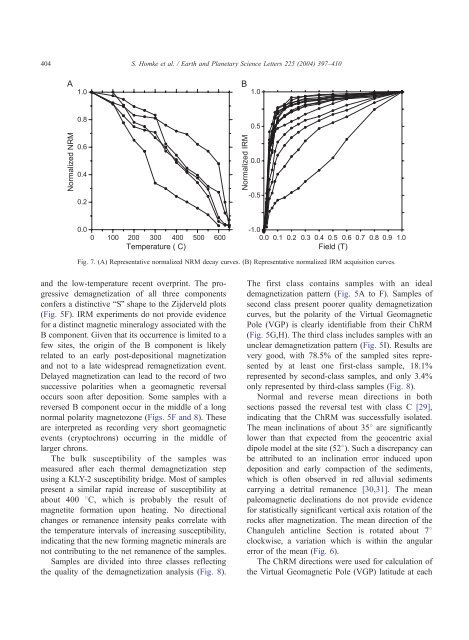
Fig. 7. (A) Representative normalized NRM decay curves. (B) Representative normalized IRM acquisition curves.<br />
and the low-temperature recent overprint. The progressive<br />
demagnetization <strong>of</strong> all three components<br />
confers a distinctive bSQ shape to the Zijderveld plots<br />
(Fig. 5F). IRM experiments do not provide evidence<br />
for a distinct magnetic mineralogy associated with the<br />
B component. Given that its occurrence is limited to a<br />
few sites, the origin <strong>of</strong> the B component is likely<br />
related to an early post-depositional magnetization<br />
and not to a late widespread remagnetization event.<br />
Delayed magnetization can lead to the record <strong>of</strong> two<br />
successive polarities when a geomagnetic reversal<br />
occurs soon after deposition. Some samples with a<br />
reversed B component occur in the middle <strong>of</strong> a long<br />
normal polarity magnetozone (Figs. 5F and 8). These<br />
are interpreted as recording very short geomagnetic<br />
events (cryptochrons) occurring in the middle <strong>of</strong><br />
larger chrons.<br />
The bulk susceptibility <strong>of</strong> the samples was<br />
measured after each thermal demagnetization step<br />
using a KLY-2 susceptibility bridge. Most <strong>of</strong> samples<br />
present a similar rapid increase <strong>of</strong> susceptibility at<br />
about 400 8C, which is probably the result <strong>of</strong><br />
magnetite formation upon heating. No directional<br />
changes or remanence intensity peaks correlate with<br />
the temperature intervals <strong>of</strong> increasing susceptibility,<br />
indicating that the new forming magnetic minerals are<br />
not contributing to the net remanence <strong>of</strong> the samples.<br />
Samples are divided into three classes reflecting<br />
the quality <strong>of</strong> the demagnetization analysis (Fig. 8).<br />
The first class contains samples with an ideal<br />
demagnetization pattern (Fig. 5A to F). Samples <strong>of</strong><br />
second class present poorer quality demagnetization<br />
curves, but the polarity <strong>of</strong> the Virtual Geomagnetic<br />
Pole (VGP) is clearly identifiable from their ChRM<br />
(Fig. 5G,H). The third class includes samples with an<br />
unclear demagnetization pattern (Fig. 5I). Results are<br />
very good, with 78.5% <strong>of</strong> the sampled sites represented<br />
by at least one first-class sample, 18.1%<br />
represented by second-class samples, and only 3.4%<br />
only represented by third-class samples (Fig. 8).<br />
Normal and reverse mean directions in both<br />
sections passed the reversal test with class C [29],<br />
indicating that the ChRM was successfully isolated.<br />
The mean inclinations <strong>of</strong> about 358 are significantly<br />
lower than that expected from the geocentric axial<br />
dipole model at the site (528). Such a discrepancy can<br />
be attributed to an inclination error induced upon<br />
deposition and early compaction <strong>of</strong> the sediments,<br />
which is <strong>of</strong>ten observed in red alluvial sediments<br />
carrying a detrital remanence [30,31]. The mean<br />
paleomagnetic declinations do not provide evidence<br />
for statistically significant vertical axis rotation <strong>of</strong> the<br />
rocks after magnetization. The mean direction <strong>of</strong> the<br />
Changuleh anticline Section is rotated about 78<br />
clockwise, a variation which is within the angular<br />
error <strong>of</strong> the mean (Fig. 6).<br />
The ChRM directions were used for calculation <strong>of</strong><br />
the Virtual Geomagnetic Pole (VGP) latitude at each