

Slaying dragons: limited evidence for unusual body size evolution ...
Slaying dragons: limited evidence for unusual body size evolution ...
Slaying dragons: limited evidence for unusual body size evolution ...

Create successful ePaper yourself
Turn your PDF publications into a flip-book with our unique Google optimized e-Paper software.
S. Meiri et al.<br />
Insular mean SVL (log 10 scale)<br />
Insular mean mass (log 10 scale)<br />
Birds<br />
(a) (b)<br />
Continental mean SVL (log 10 scale)<br />
(a) (b) (c)<br />
Of 8069 bird species in our dataset, 1347 are insular endemics<br />
(we have maximum mass data <strong>for</strong> all, and <strong>for</strong> 7552, including<br />
1268 insular endemic species, we have data on mean <strong>size</strong>;<br />
Appendix S1b). In 90 out of 223 avian genera the largest<br />
member of the clade is an insular endemic. This is significantly<br />
more than expected under our randomizations (median<br />
expected = 71; P < 0.01, Table 1). However, at the family<br />
and order levels (see <strong>size</strong> frequency histograms in Appendix<br />
S3b) the largest member of a clade is no more often an<br />
insular endemic than expected at random. The frequency with<br />
which the smallest member of a clade is an insular endemic<br />
does not depart from the null expectation <strong>for</strong> any taxonomic<br />
level. Moreover, when we repeated the analysis at the genus<br />
level using the maximum rather than mean <strong>body</strong> <strong>size</strong> (data are<br />
the maximum reported <strong>for</strong> a species in Dunning, 2008),<br />
neither the frequency of gigantism nor dwarfism departed<br />
from the null expectation (67 observed insular maxima across<br />
219 genera, median expected = 71, P = 0.53).<br />
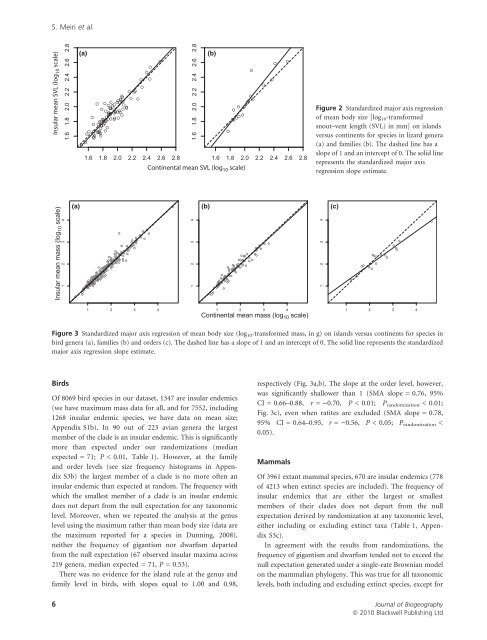
There was no <strong>evidence</strong> <strong>for</strong> the island rule at the genus and<br />
family level in birds, with slopes equal to 1.00 and 0.98,<br />
Continental mean mass (log 10 scale)<br />
respectively (Fig. 3a,b). The slope at the order level, however,<br />
was significantly shallower than 1 (SMA slope = 0.76, 95%<br />
CI = 0.66–0.88, r = )0.70, P < 0.01; P randomization < 0.01;<br />
Fig. 3c), even when ratites are excluded (SMA slope = 0.78,<br />
95% CI = 0.64–0.95, r = )0.56, P < 0.05; Prandomization <<br />
0.05).<br />
Mammals<br />
Figure 2 Standardized major axis regression<br />
of mean <strong>body</strong> <strong>size</strong> [log 10-trans<strong>for</strong>med<br />
snout–vent length (SVL) in mm] on islands<br />
versus continents <strong>for</strong> species in lizard genera<br />
(a) and families (b). The dashed line has a<br />
slope of 1 and an intercept of 0. The solid line<br />
represents the standardized major axis<br />
regression slope estimate.<br />
Figure 3 Standardized major axis regression of mean <strong>body</strong> <strong>size</strong> (log 10-trans<strong>for</strong>med mass, in g) on islands versus continents <strong>for</strong> species in<br />
bird genera (a), families (b) and orders (c). The dashed line has a slope of 1 and an intercept of 0. The solid line represents the standardized<br />
major axis regression slope estimate.<br />
Of 3961 extant mammal species, 670 are insular endemics (778<br />
of 4213 when extinct species are included). The frequency of<br />
insular endemics that are either the largest or smallest<br />
members of their clades does not depart from the null<br />
expectation derived by randomization at any taxonomic level,<br />
either including or excluding extinct taxa (Table 1, Appendix<br />
S3c).<br />
In agreement with the results from randomizations, the<br />
frequency of gigantism and dwarfism tended not to exceed the<br />
null expectation generated under a single-rate Brownian model<br />
on the mammalian phylogeny. This was true <strong>for</strong> all taxonomic<br />
levels, both including and excluding extinct species, except <strong>for</strong><br />
6 Journal of Biogeography<br />
ª 2010 Blackwell Publishing Ltd