Ocupaciones con tendencia positiva en la contratación - Servicio ...
Ocupaciones con tendencia positiva en la contratación - Servicio ...
Ocupaciones con tendencia positiva en la contratación - Servicio ...

You also want an ePaper? Increase the reach of your titles
YUMPU automatically turns print PDFs into web optimized ePapers that Google loves.
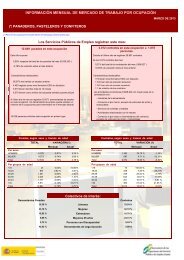
Observatorio de <strong>la</strong>s <strong>Ocupaciones</strong>. <strong>Servicio</strong> Público de Empleo Estatal ENERO DE 2013 Pág. 116<br />
23:JAEN<br />
140.000<br />
120.000<br />
100.000<br />
Mes<br />
Año<br />
2010<br />
2011<br />
2012<br />
2013<br />
80.000<br />
60.000<br />
40.000<br />
20.000<br />
0<br />
TENDENCIA DE LA INCORPORACIÓN DE TRABAJADORES<br />
AL MERCADO DE TRABAJO -PROVINCIAL-<br />
ENE FEB MAR ABR MAY JUN JUL AGO SEP OCT NOV DIC<br />
- - - - - - - - - - - -<br />
77.467 60.520 57.166 28.138 22.825 22.447 20.802 19.545 25.521 21.476 35.514 107.989<br />
79.810 49.103 31.904 20.809 23.878 22.011 20.155 21.508 25.539 20.461 46.384 120.877<br />
63.536 32.212 23.975 18.181 21.412 24.013 23.760 21.835 24.067 23.934 28.906 81.610<br />
42.163<br />
Evolución de los <strong>con</strong>tratos. Años 2010, 2011, 2012 y 2013<br />
<strong>Ocupaciones</strong> <strong>con</strong> variación interanual <strong>positiva</strong> (%) de <strong>con</strong>tratos (*)<br />
Ocupación Contratos<br />
mes<br />
Peones de obras públicas<br />
Camareros asa<strong>la</strong>riados<br />
Otro personal de limpieza<br />
Peones de <strong>la</strong> <strong>con</strong>strucción de edificios<br />
Peones agríco<strong>la</strong>s <strong>en</strong> huertas, invernaderos, viveros<br />
y jardines<br />
Peones de <strong>la</strong>s industrias manufactureras<br />
Albañiles<br />
Conductores asa<strong>la</strong>riados de camiones<br />
% var.<br />
Interanual<br />
% var.<br />
m<strong>en</strong>sual<br />
% var.<br />
Indefinidos<br />
% var.<br />
Temporales<br />
335 216,04 82,07 -100,00 219,05<br />
857 127,32 -5,51 200,00 124,52<br />
400 123,46 112,77 -75,00 128,00<br />
357 80,30 66,82 -100,00 82,14<br />
211 56,30 -48,79 56,30<br />
829 46,47 119,89 400,00 42,68<br />
945 37,35 39,79 -16,67 37,83<br />
394 19,39 9,44 36,00 18,03<br />
(*) Se han seleccionado <strong>la</strong>s ocupaciones (hasta un máximo de 15) cuyo número de <strong>con</strong>tratos <strong>en</strong> el mes de refer<strong>en</strong>cia supera el 0,5% del total<br />
provincial y que pres<strong>en</strong>tan una variación <strong>positiva</strong> <strong>en</strong> <strong>la</strong> <strong>con</strong>tratación <strong>con</strong> respecto al mismo mes del año anterior. Se muestra también <strong>la</strong> variación<br />
del número de <strong>con</strong>tratos <strong>con</strong> respecto al mes anterior y <strong>la</strong>s variaciones interanuales de <strong>con</strong>tratos indefinidos y temporales.<br />
Fu<strong>en</strong>te: <strong>Servicio</strong> Público de Empleo Estatal<br />
2010<br />
2011<br />
2012<br />
2013