Ocupaciones con tendencia positiva en la contratación - Servicio ...
Ocupaciones con tendencia positiva en la contratación - Servicio ...
Ocupaciones con tendencia positiva en la contratación - Servicio ...

Create successful ePaper yourself
Turn your PDF publications into a flip-book with our unique Google optimized e-Paper software.
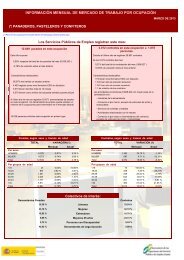
Observatorio de <strong>la</strong>s <strong>Ocupaciones</strong>. <strong>Servicio</strong> Público de Empleo Estatal ENERO DE 2013 Pág. 250<br />
49:ZAMORA<br />
Mes<br />
Año<br />
6.000<br />
5.000<br />
4.000<br />
3.000<br />
2.000<br />
1.000<br />
2010<br />
2011<br />
2012<br />
2013<br />
0<br />
TENDENCIA DE LA INCORPORACIÓN DE TRABAJADORES<br />
AL MERCADO DE TRABAJO -PROVINCIAL-<br />
ENE FEB MAR ABR MAY JUN JUL AGO SEP OCT NOV DIC<br />
- - - - - - - - - - - -<br />
2.639 2.754 3.075 2.999 3.540 3.913 5.051 4.186 4.662 4.582 3.485 2.979<br />
2.887 3.012 3.201 2.839 3.496 3.878 4.889 4.154 5.792 3.517 2.879 2.399<br />
2.290 2.334 2.411 2.639 2.960 3.723 4.467 3.513 4.154 4.165 2.507 2.192<br />
2.179<br />
Evolución de los <strong>con</strong>tratos. Años 2010, 2011, 2012 y 2013<br />
<strong>Ocupaciones</strong> <strong>con</strong> variación interanual <strong>positiva</strong> (%) de <strong>con</strong>tratos (*)<br />
Ocupación Contratos<br />
mes<br />
Grabadores de datos<br />
Artistas creativos e interpretativos no c<strong>la</strong>sificados<br />
bajo otros epígrafes<br />
Peones forestales y de <strong>la</strong> caza<br />
Ag<strong>en</strong>tes y repres<strong>en</strong>tantes comerciales<br />
Empleados domésticos<br />
Monitores de actividades recreativas y de<br />
<strong>en</strong>tret<strong>en</strong>imi<strong>en</strong>to<br />
Otras ocupaciones elem<strong>en</strong>tales<br />
Otros trabajadores de <strong>la</strong>s obras estructurales de<br />
<strong>con</strong>strucción no c<strong>la</strong>sificados bajo otros epígrafes<br />
Otro personal de limpieza<br />
Oficiales, operarios y artesanos de otros oficios no<br />
c<strong>la</strong>sificados bajo otros epígrafes<br />
Ord<strong>en</strong>anzas<br />
Empleados administrativos sin tareas de at<strong>en</strong>ción al<br />
público no c<strong>la</strong>sificados bajo otros epígrafes<br />
Peones agropecuarios<br />
Técnicos <strong>en</strong> educación infantil<br />
Camareros asa<strong>la</strong>riados<br />
% var.<br />
Interanual<br />
% var.<br />
m<strong>en</strong>sual<br />
% var.<br />
Indefinidos<br />
% var.<br />
Temporales<br />
49 1.533,33 -36,36 1.533,33<br />
28 366,67 366,67 366,67<br />
26 271,43 2.500,00 271,43<br />
13 160,00 116,67 100,00<br />
55 150,00 22,22 61,54 277,78<br />
41 127,78 -37,88 122,22<br />
11 120,00 175,00 -33,33 350,00<br />
20 100,00 -42,86 100,00<br />
20 100,00 150,00 -50,00 137,50<br />
21 90,91 600,00 66,67 120,00<br />
19 90,00 90,00 -100,00 171,43<br />
80 81,82 -20,00 350,00 69,05<br />
59 78,79 31,11 0,00 81,25<br />
17 70,00 183,33 166,67 28,57<br />
168 43,59 -43,24 -16,67 50,48<br />
(*) Se han seleccionado <strong>la</strong>s ocupaciones (hasta un máximo de 15) cuyo número de <strong>con</strong>tratos <strong>en</strong> el mes de refer<strong>en</strong>cia supera el 0,5% del total<br />
provincial y que pres<strong>en</strong>tan una variación <strong>positiva</strong> <strong>en</strong> <strong>la</strong> <strong>con</strong>tratación <strong>con</strong> respecto al mismo mes del año anterior. Se muestra también <strong>la</strong> variación<br />
del número de <strong>con</strong>tratos <strong>con</strong> respecto al mes anterior y <strong>la</strong>s variaciones interanuales de <strong>con</strong>tratos indefinidos y temporales.<br />
Fu<strong>en</strong>te: <strong>Servicio</strong> Público de Empleo Estatal<br />
2010<br />
2011<br />
2012<br />
2013