Ocupaciones con tendencia positiva en la contratación - Servicio ...
Ocupaciones con tendencia positiva en la contratación - Servicio ...
Ocupaciones con tendencia positiva en la contratación - Servicio ...

Create successful ePaper yourself
Turn your PDF publications into a flip-book with our unique Google optimized e-Paper software.
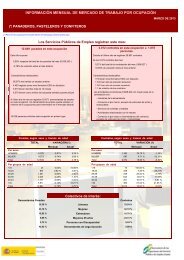
Observatorio de <strong>la</strong>s <strong>Ocupaciones</strong>. <strong>Servicio</strong> Público de Empleo Estatal ENERO DE 2013 Pág. 205<br />
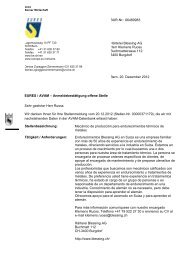
40:SEGOVIA<br />
7.000<br />
6.000<br />
5.000<br />
4.000<br />
3.000<br />
2.000<br />
1.000<br />
Mes<br />
Año<br />
2010<br />
2011<br />
2012<br />
2013<br />
0<br />
TENDENCIA DE LA INCORPORACIÓN DE TRABAJADORES<br />
AL MERCADO DE TRABAJO -PROVINCIAL-<br />
ENE FEB MAR ABR MAY JUN JUL AGO SEP OCT NOV DIC<br />
- - - - - - - - - - - -<br />
2.372 2.933 3.260 2.928 3.287 4.194 4.858 3.958 4.417 6.471 4.365 3.317<br />
2.908 2.799 3.351 2.995 3.415 4.472 4.826 4.116 4.031 5.206 3.400 2.784<br />
2.398 2.867 2.896 2.742 3.538 4.857 6.197 3.835 3.524 5.869 3.294 2.983<br />
2.577<br />
Evolución de los <strong>con</strong>tratos. Años 2010, 2011, 2012 y 2013<br />
<strong>Ocupaciones</strong> <strong>con</strong> variación interanual <strong>positiva</strong> (%) de <strong>con</strong>tratos (*)<br />
Ocupación Contratos<br />
mes<br />
Empleados domésticos<br />
Otro personal de limpieza<br />
Peones del transporte de mercancías y<br />
descargadores<br />
C<strong>la</strong>sificadores de desechos, operarios de punto<br />
limpio y recogedores de chatarra<br />
Peones ganaderos<br />
Ayudantes de cocina<br />
Conductores asa<strong>la</strong>riados de camiones<br />
Peones agropecuarios<br />
Cajeros y taquilleros (excepto bancos)<br />
Peones de <strong>la</strong>s industrias manufactureras<br />
Peones agríco<strong>la</strong>s (excepto <strong>en</strong> huertas,<br />
invernaderos, viveros y jardines)<br />
Camareros asa<strong>la</strong>riados<br />
Reponedores<br />
Albañiles<br />
Empleados administrativos sin tareas de at<strong>en</strong>ción al<br />
público no c<strong>la</strong>sificados bajo otros epígrafes<br />
% var.<br />
Interanual<br />
% var.<br />
m<strong>en</strong>sual<br />
% var.<br />
Indefinidos<br />
% var.<br />
Temporales<br />
66 633,33 13,79 620,00 650,00<br />
24 380,00 118,18 300,00<br />
17 142,86 -5,56 -100,00 325,00<br />
54 125,00 -43,75 125,00<br />
23 76,92 27,78 -12,50 220,00<br />
48 71,43 41,18 66,67 72,00<br />
28 64,71 0,00 44,44 87,50<br />
29 61,11 61,11 0,00 64,71<br />
29 52,63 -29,27 0,00 55,56<br />
809 48,71 0,75 -27,27 50,28<br />
23 43,75 -78,90 0,00 53,85<br />
365 39,85 -25,96 108,33 36,55<br />
19 18,75 -53,66 -50,00 28,57<br />
23 9,52 -34,29 -100,00 15,00<br />
26 8,33 4,00 -54,55 61,54<br />
(*) Se han seleccionado <strong>la</strong>s ocupaciones (hasta un máximo de 15) cuyo número de <strong>con</strong>tratos <strong>en</strong> el mes de refer<strong>en</strong>cia supera el 0,5% del total<br />
provincial y que pres<strong>en</strong>tan una variación <strong>positiva</strong> <strong>en</strong> <strong>la</strong> <strong>con</strong>tratación <strong>con</strong> respecto al mismo mes del año anterior. Se muestra también <strong>la</strong> variación<br />
del número de <strong>con</strong>tratos <strong>con</strong> respecto al mes anterior y <strong>la</strong>s variaciones interanuales de <strong>con</strong>tratos indefinidos y temporales.<br />
Fu<strong>en</strong>te: <strong>Servicio</strong> Público de Empleo Estatal<br />
2010<br />
2011<br />
2012<br />
2013