Ocupaciones con tendencia positiva en la contratación - Servicio ...
Ocupaciones con tendencia positiva en la contratación - Servicio ...
Ocupaciones con tendencia positiva en la contratación - Servicio ...

You also want an ePaper? Increase the reach of your titles
YUMPU automatically turns print PDFs into web optimized ePapers that Google loves.
Observatorio de <strong>la</strong>s <strong>Ocupaciones</strong>. <strong>Servicio</strong> Público de Empleo Estatal ENERO DE 2013 Pág. 259<br />
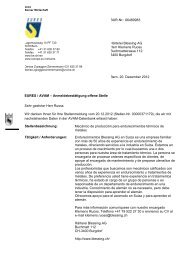
51:CEUTA<br />
2.400<br />
2.000<br />
1.600<br />
1.200<br />
Mes<br />
Año<br />
2010<br />
2011<br />
2012<br />
2013<br />
800<br />
400<br />
0<br />
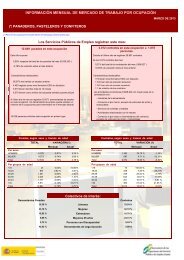
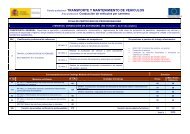
TENDENCIA DE LA INCORPORACIÓN DE TRABAJADORES<br />
AL MERCADO DE TRABAJO -PROVINCIAL-<br />
ENE FEB MAR ABR MAY JUN JUL AGO SEP OCT NOV DIC<br />
- - - - - - - - - - - -<br />
1.428 1.347 1.500 1.371 1.579 1.632 1.936 1.968 1.740 1.816 2.276 1.910<br />
1.378 1.300 1.552 1.292 1.508 1.979 1.770 2.106 1.580 1.516 1.223 1.379<br />
1.808 984 1.055 948 1.303 1.327 1.897 1.423 1.340 1.331 1.343 1.112<br />
1.348<br />
Evolución de los <strong>con</strong>tratos. Años 2010, 2011, 2012 y 2013<br />
<strong>Ocupaciones</strong> <strong>con</strong> variación interanual <strong>positiva</strong> (%) de <strong>con</strong>tratos (*)<br />
Ocupación Contratos<br />
mes<br />
Enfermeros no especializados<br />
Otras ocupaciones elem<strong>en</strong>tales<br />
Montadores de estructuras metálicas<br />
Ord<strong>en</strong>anzas<br />
Fontaneros<br />
Empleados domésticos<br />
Instructores de actividades deportivas<br />
Recogedores de residuos<br />
Cocineros asa<strong>la</strong>riados<br />
Médicos de familia<br />
Grabadores de datos<br />
Profesores y profesionales de <strong>la</strong> <strong>en</strong>señanza no<br />
c<strong>la</strong>sificados bajo otros epígrafes<br />
Albañiles<br />
Cajeros y taquilleros (excepto bancos)<br />
Empleados administrativos <strong>con</strong> tareas de at<strong>en</strong>ción<br />
al público no c<strong>la</strong>sificados bajo otros epígrafes<br />
% var.<br />
Interanual<br />
% var.<br />
m<strong>en</strong>sual<br />
% var.<br />
Indefinidos<br />
% var.<br />
Temporales<br />
66 2.100,00 46,67 -100,00 3.200,00<br />
22 2.100,00 1.000,00 2.100,00<br />
11 1.000,00 37,50 700,00<br />
28 833,33 -48,15 833,33<br />
17 750,00 142,86 750,00<br />
8 700,00 -27,27 600,00<br />
7 600,00 600,00 600,00<br />
66 266,67 -7,04 266,67<br />
40 263,64 566,67 -75,00 457,14<br />
69 263,16 176,00 263,16<br />
15 200,00 200,00<br />
56 100,00 30,23 96,43<br />
134 54,02 65,43 16,67 56,79<br />
14 40,00 -33,33 -100,00 55,56<br />
18 38,46 -18,18 25,00 44,44<br />
(*) Se han seleccionado <strong>la</strong>s ocupaciones (hasta un máximo de 15) cuyo número de <strong>con</strong>tratos <strong>en</strong> el mes de refer<strong>en</strong>cia supera el 0,5% del total<br />
provincial y que pres<strong>en</strong>tan una variación <strong>positiva</strong> <strong>en</strong> <strong>la</strong> <strong>con</strong>tratación <strong>con</strong> respecto al mismo mes del año anterior. Se muestra también <strong>la</strong> variación<br />
del número de <strong>con</strong>tratos <strong>con</strong> respecto al mes anterior y <strong>la</strong>s variaciones interanuales de <strong>con</strong>tratos indefinidos y temporales.<br />
Fu<strong>en</strong>te: <strong>Servicio</strong> Público de Empleo Estatal<br />
2010<br />
2011<br />
2012<br />
2013