- Page 2 and 3:
INFORME CIENTÍFICO TECNOLÓGICO 19
- Page 4 and 5:
PRESENTACIÓN ÍNDICE CONTENIDO Pá
- Page 6 and 7:
adioinmunoanálisis. También se ha
- Page 8 and 9:
12. CARACTERÍSTICAS FÍSICAS DEL G
- Page 10 and 11:
39. SOFTWARE DE MANTENIMIENTO PARA
- Page 12 and 13:
65. PREVALENCE OF HBsAg AND ANTI -
- Page 14 and 15:
93. DETERMINACIÓN DE TIEMPOS DE TR
- Page 16 and 17:
122. PROGRAMA DE VIGILANCIA RADIOL
- Page 18 and 19:
1. Física Nuclear y de Reactores 1
- Page 20 and 21:
dci ( t) bi n( t) = −λi ci( t) *
- Page 22 and 23:
CÁLCULO NEUTRÓNICO DE PARÁMETROS
- Page 24 and 25:
fresh cores and burned core for RP1
- Page 26 and 27:
(6) W.L. Woodruff, "RECOEFF Code -
- Page 28 and 29:
En la Tabla 1 se presenta el valor
- Page 30 and 31:
SIMULACIÓN DE UN EXPERIMENTO PARA
- Page 32 and 33:
Si asociamos las intensidades del h
- Page 34 and 35:
C.I. No 02 COLIMADOR GONIOMETRO Y C
- Page 36 and 37:
VARIACIÓN DE RAZÓN DE CADMIO Y FL
- Page 38 and 39:
4. Conclusiones Figura 1. Variació
- Page 40 and 41:
La Figura 2 muestra un diagrama geo
- Page 42 and 43:
USO DEL CÓDIGO MCNP PARA EL TRANSP
- Page 44 and 45: Resumen USO DEL CONDUCTO RADIAL Nº
- Page 46 and 47: CALIBRACIÓN DE MONITORES DE NEUTRO
- Page 48 and 49: CARACTERÍSTICAS FÍSICAS DEL GERMA
- Page 50 and 51: Resumen DISEÑO DE UN SISTEMA DE FI
- Page 52 and 53: EMPLEO DE UN INDICADOR DE PUREZA DE
- Page 54 and 55: de neutrones térmicos fue 77.6 %,
- Page 56 and 57: DETERMINATION OF PRECIOUS AND RARE
- Page 58 and 59: Monazite samples to participate in
- Page 60 and 61: Table 3. Gamma self-shielding effec
- Page 62 and 63: DETERMINACIÓN RADIOQUÍMICA DE RAD
- Page 64 and 65: the City of Elliot Lake, Ontario, C
- Page 66 and 67: STUDY OF THE PRODUCTION AND DISTRIB
- Page 68 and 69: care was taken during the overall a
- Page 70 and 71: • 1 PAMPAILLA • 2 QOTAKALLI •
- Page 72 and 73: MEJORAMIENTO DE LOS LÍMITES DE DET
- Page 74 and 75: Señal (unidades arbitrarias) 2700.
- Page 76 and 77: 2. Especificación del método de a
- Page 78 and 79: 3.2. Diagrama causa-efecto para el
- Page 80 and 81: El programa utilizado para el trata
- Page 82 and 83: Expressing the Uncertainty of NIST
- Page 84 and 85: Una aplicación importante es la co
- Page 86 and 87: (I /I )*C Cr Ga Ga (I /I )*C Mn Ga
- Page 88 and 89: DETERMINACIÓN DE Cr, Mn, Fe, Co, N
- Page 90 and 91: Concentración (ng/g) Concentració
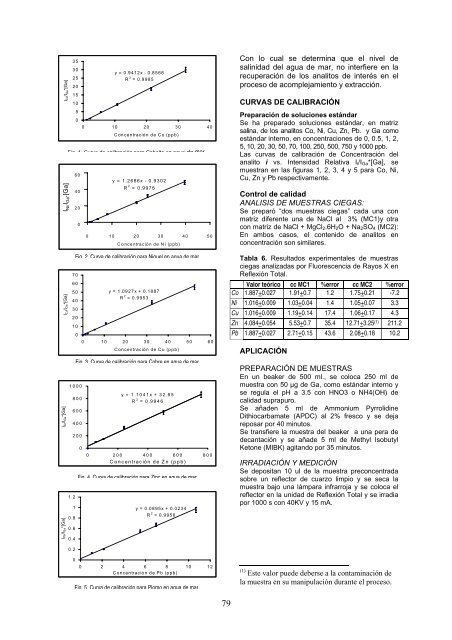
- Page 92 and 93: PRUEBAS PRELIMINARES DE PRECONCENTR
- Page 96 and 97: ESTANDARIZACIÓN DEL MÉTODO RADIOQ
- Page 98 and 99: Como se puede observar los valores
- Page 100 and 101: 3. Ingeniería Nuclear
- Page 102 and 103: measured positions. Note that it va
- Page 104 and 105: AUTOMATIZACIÓN DEL SISTEMA DE MONI
- Page 106 and 107: En cualquier momento el usuario pue
- Page 108 and 109: Con las ecuaciones (3) y (5) podemo
- Page 110 and 111: 5. REFERENCIAS Rc mV [1]. Beckurts,
- Page 112 and 113: conveniente grupo de instrucciones
- Page 114 and 115: AUTOMATIZACIÓN DE LA PLANTA DE TRA
- Page 116 and 117: SISTEMA DE MONITORAJE AMBIENTAL Cun
- Page 118 and 119: RESUMEN SISTEMA DE MONITOREO NEUTR
- Page 120 and 121: 3. REFERENCES 1) Banica, Florinel G
- Page 122 and 123: INTRODUCCIÓN IMPLEMENTACIÓN Y EVA
- Page 124 and 125: pH Figura 2. Curva de titulación p
- Page 126 and 127: IMPLEMENTACIÓN DE MONITORIZACIÓN
- Page 128 and 129: FUENTES SELLADAS EN PERÚ: AVANCES
- Page 130 and 131: fuentes con todo su blindaje equidi
- Page 132 and 133: 6. OBSERVACIONES Y CONCLUSIONES a)
- Page 134 and 135: fuentes, expresadas por su período
- Page 136 and 137: por los entes involucrados, en dond
- Page 138 and 139: equipo intercambiador de muestras,
- Page 140 and 141: Así mismo el programa cuenta con o
- Page 142 and 143: frecuencia de pulso generado esta r
- Page 144 and 145:
DISEÑO Y CONSTRUCCIÓN DE UN SISTE
- Page 146 and 147:
Obteniéndose la constante de evolu
- Page 148 and 149:
ABSTRACT NUCLEAR REACTOR SIMULATOR
- Page 150 and 151:
The general solution for set (15) t
- Page 152 and 153:
SOFTWARE DE ADQUISICIÓN DE TEMPERA
- Page 154 and 155:
Tabla 1. Parámetros de lectura des
- Page 156 and 157:
Asimismo cuenta con herramientas de
- Page 158 and 159:
D = y 16 ∑ i= 1 16lwQ A ε k k j
- Page 160 and 161:
RESUMEN CONTROL AUTOMÁTICO DE EFLU
- Page 162 and 163:
ESQUEMA DEL CABLEADO CONCLUSIONES L
- Page 164 and 165:
c) IDENTIFICACION DE LAS FUENTES: d
- Page 166 and 167:
8 35 20 20 20 12,5 Figura 4. Conten
- Page 168 and 169:
3. TÉCNICA DEL ANÁLISIS NO DESTRU
- Page 170 and 171:
4. Materiales Nucleares
- Page 172 and 173:
Figura 2. Registros del haz transmi
- Page 174 and 175:
RESUMEN CRECIMIENTO DE MONOCRISTALE
- Page 176 and 177:
RESUMEN CRECIMIENTO DE MONOCRISTALE
- Page 178 and 179:
5. Seguridad Nuclear
- Page 180 and 181:
Datos de Entrada Los datos de entra
- Page 182 and 183:
L3 Z 3 FIGURA 1 ESQUEMA DEL ACCIDEN
- Page 184 and 185:
ANÁLISIS TERMOHIDRÁULICO DEL ACCI
- Page 186 and 187:
EVOLUCION DE LAS TEMPERATURAS DESPU
- Page 188 and 189:
THE DIFFERENTIAL PERTURBATIVE METHO
- Page 190 and 191:
Definition of the sensitivity probl
- Page 192 and 193:
Universidad Nacional de Ingeniería
- Page 194 and 195:
Operando luego de igualar las expre
- Page 196 and 197:
COMENTARIOS Este análisis determin
- Page 198 and 199:
Análisis estadístico: Regresión
- Page 200 and 201:
RESUMEN ANÁLISIS NEUTRÓNICO PARA
- Page 202 and 203:
6. Protección y Seguridad Radioló
- Page 204 and 205:
ACONDICIONAMIENTO: Las muestras de
- Page 206 and 207:
El gráfico 2 muestra el valor de
- Page 208 and 209:
DETECTION OF RNA OF HEPATITIS C VIR
- Page 210 and 211:
Los datos epidemiológicos de preva
- Page 212 and 213:
4. DISCUSIÓN Y CONCLUSIONES Un tot
- Page 214 and 215:
[13]. Kuru U, Turan O, Kuru N, Sagl
- Page 216 and 217:
CARACTERIZACIÓN DE HACES DE RAYOS-
- Page 218 and 219:
Tabla 1. Valores de CS, CH, E m y R
- Page 220 and 221:
Tabla 1. Campos de radiación; dond
- Page 222 and 223:
5. REFERENCIAS (1) MCKINLAY, A., Th
- Page 224 and 225:
Los dosímetros fueron sometidos a
- Page 226 and 227:
Voltaje (kV) Tabla 2. Valores medid
- Page 228 and 229:
La diferencia entre las exposicione
- Page 230 and 231:
4. CONCLUSIONES • De acuerdo a lo
- Page 232 and 233:
DISEÑO DE UNA PLANTA DE TRATAMIENT
- Page 234 and 235:
CONSIDERACIONES DE SEGURIDAD RADIOL
- Page 236 and 237:
AUTOMATIZACIÓN DE LA PLANTA DE TRA
- Page 238 and 239:
DISEÑO DE CONTENEDORES PARA RESIDU
- Page 240 and 241:
ELABORACIÓN DE UN RADIOFÁRMACO (P
- Page 242 and 243:
comportamiento bioquímico o determ
- Page 244 and 245:
el rendimiento de la pureza radioqu
- Page 246 and 247:
Tabla 2. Efecto de la cantidad de l
- Page 248 and 249:
DISTRIBUCIÓN BIOLÓGICA De los res
- Page 250 and 251:
PURIFICACIÓN DEL BENZOIL- MERCAPTO
- Page 252 and 253:
cromatografía en papel (CP), en do
- Page 254 and 255:
Tabla 1. Número de operaciones y h
- Page 256 and 257:
neutrónicos y la cantidad de mater
- Page 258 and 259:
mejoramiento del producto. Se inici
- Page 260 and 261:
%Transmittance %Transmittance 100 9
- Page 262 and 263:
aparente de 0,250 g/cc para el caso
- Page 264 and 265:
ESTUDIOS DE DISPERSIÓN DE CONTAMIN
- Page 266 and 267:
Los valores de los coeficientes de
- Page 268 and 269:
RESUMEN APLICACIÓN DE RADIOTRAZADO
- Page 270 and 271:
INSPECCIÓN RADIOGRÁFICA DE JUNTAS
- Page 272 and 273:
DETERMINACIÓN DE LA DECLINACIÓN B
- Page 274 and 275:
alimentación permanente de estos a
- Page 276 and 277:
INSPECCIÓN RADIOGRÁFICA DEL BLOQU
- Page 278 and 279:
DETERMINACIÓN DE TIEMPOS DE TRÁNS
- Page 280 and 281:
INSPECCIÓN RADIOGRÁFICA DE LAS ES
- Page 282 and 283:
V/Q es el llamado tiempo medio de p
- Page 284 and 285:
ESTUDIO DEL POTENCIAL GEOTÉRMICO D
- Page 286 and 287:
EVALUACIÓN DE LAS ZONAS GEOTÉRMIC
- Page 288 and 289:
Lago Mayor Lago Menor, estern basin
- Page 290 and 291:
1. RESUMEN CARACTERIZACIÓN DEL ACU
- Page 292 and 293:
soldadura, contaminación superfici
- Page 294 and 295:
excelente alternativa para reemplaz
- Page 296 and 297:
alcohol y hielo seco se colocó 66
- Page 298 and 299:
De la tabla 7 se observa en la reac
- Page 300 and 301:
total precipitación. El reactivo l
- Page 302 and 303:
nos ceñimos al proceso arriba menc
- Page 304 and 305:
PARÁMETROS DE TEMPERATURA EN EL PR
- Page 306 and 307:
EVALUACIONES DE LAS DISTRIBUCIONES
- Page 308 and 309:
SÍNTESIS Y MARCACIÓN DE meta-IODO
- Page 310 and 311:
Tabla 1. Puntos de fusión de los p
- Page 312 and 313:
Obtención de 153 SmCl3 : El blanco
- Page 314 and 315:
2 ( Au / As) Donde: Au: Absorvancia
- Page 316 and 317:
RESUMEN ESTUDIO DE ESTABILIDAD PARA
- Page 318 and 319:
Este método establece que la frecu
- Page 320 and 321:
se utiliza. Por otro lado, para obt
- Page 322 and 323:
ANÁLISIS CITOGENÉTICOS DE LOS AFE
- Page 324 and 325:
VALORES ABSOLUTOS 1,500 1,350 1,200
- Page 326 and 327:
medidas de dispersión (varianza, d
- Page 328 and 329:
Tabla 1. Análisis de Varianza de M
- Page 330 and 331:
1. Construcción y montaje de los r
- Page 332 and 333:
l. Trabajos para las pruebas de los
- Page 334 and 335:
CÁLCULO DE DOSIS POR COMBINACIÓN
- Page 336 and 337:
VALIDACIÓN DE LA TÉCNICA L.A.L. (
- Page 338 and 339:
DETERMINACIÓN DE LA ACTIVIDAD ALFA
- Page 340 and 341:
Determinación de Ra 226 en muestra
- Page 342 and 343:
information about the total radioac
- Page 344 and 345:
[5]. Gonzales V., S.; Osores R., J.
- Page 346 and 347:
2. MATERIAL Y MÉTODOS Se recolecta
- Page 348 and 349:
6. REFERENCIAS [1]. Aoyama, M.; Hir
- Page 350 and 351:
(characteristics from different are
- Page 352 and 353:
Table 3. Pearson´s correlation amo
- Page 354 and 355:
Calibración Se realizan calibracio
- Page 356 and 357:
Se realizaron calibraciones para ca
- Page 358 and 359:
EFECTO DE 2, 4 y 6 kGy SOBRE LAS CA
- Page 360 and 361:
h. Luego estas alícuotas fueron ir
- Page 362 and 363:
Tabla 2. Análisis de varianza de l
- Page 364 and 365:
mechanically deboned chicken meat.
- Page 366 and 367:
log ( ufc / g ) 5000 4000 3000 2000
- Page 368 and 369:
Terminal Marítimo de Villa María,
- Page 370 and 371:
Tabla 1. Calificaciones promedio y
- Page 372 and 373:
a 5,8; esto se debió a que las con
- Page 374 and 375:
Tabla 5. Costos de capital y costos
- Page 376 and 377:
ELIMINACIÓN DE VIBRIO CHOLERAE 01,
- Page 378 and 379:
utilizando el diseño factorial 4
- Page 380 and 381:
Tabla 3. Puntajes promedios obtenid
- Page 382 and 383:
Puntaje promedio Figura 4. Resultad
- Page 384 and 385:
En la figura 7, se observa que la m
- Page 386 and 387:
presencia de Lactobacillus como la
- Page 388 and 389:
décimo quinto día como el límite
- Page 390 and 391:
2.2. Embolsado Para este trabajo de
- Page 392 and 393:
mencionado cuadro tenemos que el ol
- Page 394 and 395:
3.4.2 pH pH En la figura 3, se obse
- Page 396 and 397:
irradiación. Instituto de Ciencias
- Page 398 and 399:
Anteriormente se ha determinado la
- Page 400 and 401:
Log (N/No) 0 -1 -2 -3 -4 -5 -6 -7 -
- Page 402 and 403:
se calcula en 32 días. Se encuentr
- Page 404 and 405:
3.3. Análisis de costos La Planta
- Page 406 and 407:
RESUMEN ELIMINACIÓN DE Vibrio chol
- Page 408 and 409:
con tres repeticiones utilizando la
- Page 410 and 411:
para cada dosis, se consideró a é
- Page 412 and 413:
langostino cuando su pH esta entre
- Page 414 and 415:
significativamente durante la alter
- Page 416 and 417:
RESUMEN ELIMINACIÓN DE VIBRIO CHOL
- Page 418 and 419:
Tabla 1. Descriptores utilizados pa
- Page 420 and 421:
Kumta y Sreenivasan [10] encontraro
- Page 422 and 423:
ahumado (olor característico), que
- Page 424 and 425:
8. Regulación y Normatividad
- Page 426 and 427:
Complementando a la organización o
- Page 428 and 429:
4. DISCUSIÓN Los laboratorios en u
- Page 430 and 431:
Tabla 1. Párrafo Requisitos del si
- Page 432 and 433:
Tabla 3. Sistema de calidad plantea
- Page 434 and 435:
7. Implantar como parte del Sistema
- Page 436 and 437:
3. Medicina nuclear. 4. Capacitaci
- Page 438 and 439:
1: Introducción y descripción gen
- Page 440 and 441:
Sin embargo, siendo necesaria una c
- Page 442 and 443:
RESUMEN CONTRIBUCIÓN DEL PROYECTO
- Page 444 and 445:
(Teleterapia y Braquiterapia), Medi
- Page 446 and 447:
APLICACIÓN EN EL PERÚ DE LOS DOCU
- Page 448 and 449:
nuclear y del control de las radiac
- Page 450 and 451:
Los documentos elaborados en ARCAL
- Page 452 and 453:
de América latina. El Programa ARC
- Page 454 and 455:
algunos accidentes ocurridos en la
- Page 456 and 457:
IMPLEMENTACIÓN DE NUEVO REGLAMENTO
- Page 458 and 459:
4. REGLAMENTO DE SEGURIDAD RADIOLÓ
- Page 460 and 461:
CONTROL DE CALIDAD NUCLEAR DE ESPEC
- Page 462 and 463:
EFICIENCIA 0.045 0.043 0.040 0.038
- Page 464 and 465:
ASEGURAMIENTO DE CALIDAD EN EL DEPA
- Page 466 and 467:
ensayo: calificación, entrenamient
- Page 468 and 469:
CONTROL DE CALIDAD EN EQUIPOS DE RA
- Page 470 and 471:
Exposición relativa Figura 3. Resu
- Page 472 and 473:
9.00 7.00 5.00 3.00 1.00 5.00 4.10
- Page 474 and 475:
(4) Informe del comité de las NN.U
- Page 476 and 477:
ALGUNOS ASPECTOS COMPARATIVOS EN LA
- Page 478 and 479:
IMPLEMENTACIÓN DE UN SISTEMA DE B
- Page 480 and 481:
Web Server HTTP ERL Server Servidor
- Page 482 and 483:
clear that the major part of therma
- Page 484 and 485:
histéresis, respectivamente. La ec
- Page 486 and 487:
Los resultados experimentales fuero
- Page 488 and 489:
• Evita la redundancia de datos d
- Page 490 and 491:
Tabla 1. Variables. Nombre de varia
- Page 492 and 493:
ANEXO 1: AÑO 1998 ANEXOS Publicaci
- Page 494 and 495:
R.; Torres, Z.; Sebastián, C.; Mir
- Page 496 and 497:
Y. Marie Henon (FRANCIA), Seminario
- Page 498 and 499:
Curso Básico de Energía Nuclear (
- Page 500 and 501:
Los Radioisótopos. Robles, A. CSEN
- Page 502 and 503:
CURSOS Primer Curso Nacional sobre
- Page 504 and 505:
TESIS Amaya F., F. H.; Tema: “Sim
- Page 506 and 507:
Curso Básico de Energía Nuclear p
- Page 508 and 509:
del Reactor Nuclear RP-10”. Licen
- Page 510 and 511:
Aguinaga J. 279 Aguirre A. 100, 102