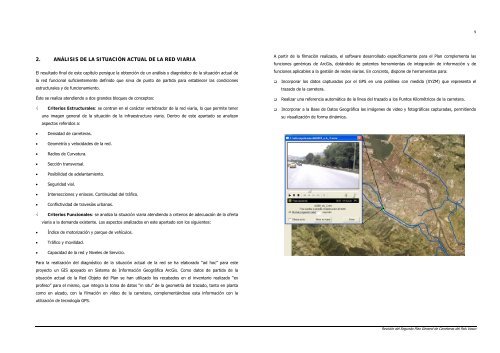
2. análisis de la situación actual de la red viaria - Garraioak
2. análisis de la situación actual de la red viaria - Garraioak
2. análisis de la situación actual de la red viaria - Garraioak

Create successful ePaper yourself
Turn your PDF publications into a flip-book with our unique Google optimized e-Paper software.
<strong>2.</strong> ANÁLISIS DE LA SITUACIÓN ACTUAL DE LA RED VIARIA<br />
El resultado final <strong>de</strong> este capítulo persigue <strong>la</strong> obtención <strong>de</strong> un <strong>análisis</strong> y diagnóstico <strong>de</strong> <strong>la</strong> <strong>situación</strong> <strong>actual</strong> <strong>de</strong><br />
<strong>la</strong> <strong>red</strong> funcional suficientemente <strong>de</strong>finido que sirva <strong>de</strong> punto <strong>de</strong> partida para establecer <strong>la</strong>s condiciones<br />
estructurales y <strong>de</strong> funcionamiento.<br />
Éste se realiza atendiendo a dos gran<strong>de</strong>s bloques <strong>de</strong> conceptos:<br />
√ Criterios Estructurales: se centran en el carácter vertebrador <strong>de</strong> <strong>la</strong> <strong>red</strong> <strong>viaria</strong>, lo que permite tener<br />
una imagen general <strong>de</strong> <strong>la</strong> <strong>situación</strong> <strong>de</strong> <strong>la</strong> infraestructura <strong>viaria</strong>. Dentro <strong>de</strong> este apartado se analizan<br />
aspectos referidos a:<br />
• Densidad <strong>de</strong> carreteras.<br />
• Geometría y velocida<strong>de</strong>s <strong>de</strong> <strong>la</strong> <strong>red</strong>.<br />
• Radios <strong>de</strong> Curvatura.<br />
• Sección transversal.<br />
• Posibilidad <strong>de</strong> a<strong>de</strong><strong>la</strong>ntamiento.<br />
• Seguridad vial.<br />
• Intersecciones y en<strong>la</strong>ces. Continuidad <strong>de</strong>l tráfico.<br />
• Conflictividad <strong>de</strong> travesías urbanas.<br />
√ Criterios Funcionales: se analiza <strong>la</strong> <strong>situación</strong> <strong>viaria</strong> atendiendo a criterios <strong>de</strong> a<strong>de</strong>cuación <strong>de</strong> <strong>la</strong> oferta<br />
<strong>viaria</strong> a <strong>la</strong> <strong>de</strong>manda existente. Los aspectos analizados en este apartado son los siguientes:<br />
• Índice <strong>de</strong> motorización y parque <strong>de</strong> vehículos.<br />
• Tráfico y movilidad.<br />
• Capacidad <strong>de</strong> <strong>la</strong> <strong>red</strong> y Niveles <strong>de</strong> Servicio.<br />
Para <strong>la</strong> realización <strong>de</strong>l diagnóstico <strong>de</strong> <strong>la</strong> <strong>situación</strong> <strong>actual</strong> <strong>de</strong> <strong>la</strong> <strong>red</strong> se ha e<strong>la</strong>borado “ad hoc” para este<br />
proyecto un GIS apoyado en Sistema <strong>de</strong> Información Geográfica ArcGis. Como datos <strong>de</strong> partida <strong>de</strong> <strong>la</strong><br />
<strong>situación</strong> <strong>actual</strong> <strong>de</strong> <strong>la</strong> Red Objeto <strong>de</strong>l P<strong>la</strong>n se han utilizado los recabados en el inventario realizado “ex<br />
profeso” para el mismo, que integra <strong>la</strong> toma <strong>de</strong> datos “in situ” <strong>de</strong> <strong>la</strong> geometría <strong>de</strong>l trazado, tanto en p<strong>la</strong>nta<br />
como en alzado, con <strong>la</strong> filmación en ví<strong>de</strong>o <strong>de</strong> <strong>la</strong> carretera, complementándose esta información con <strong>la</strong><br />
utilización <strong>de</strong> tecnología GPS.<br />
A partir <strong>de</strong> <strong>la</strong> filmación realizada, el software <strong>de</strong>sarrol<strong>la</strong>do específicamente para el P<strong>la</strong>n complementa <strong>la</strong>s<br />
funciones genéricas <strong>de</strong> ArcGis, dotándolo <strong>de</strong> potentes herramientas <strong>de</strong> integración <strong>de</strong> información y <strong>de</strong><br />
funciones aplicables a <strong>la</strong> gestión <strong>de</strong> re<strong>de</strong>s <strong>viaria</strong>s. En concreto, dispone <strong>de</strong> herramientas para:<br />
Incorporar los datos capturados por el GPS en una polilínea con medida (XYZM) que representa el<br />
trazado <strong>de</strong> <strong>la</strong> carretera.<br />
Realizar una referencia automática <strong>de</strong> <strong>la</strong> línea <strong>de</strong>l trazado a los Puntos Kilométricos <strong>de</strong> <strong>la</strong> carretera.<br />
Incorporar a <strong>la</strong> Base <strong>de</strong> Datos Geográfica <strong>la</strong>s imágenes <strong>de</strong> vi<strong>de</strong>o y fotográficas capturadas, permitiendo<br />
su visualización <strong>de</strong> forma dinámica.<br />
Revisión <strong>de</strong>l Segundo P<strong>la</strong>n General <strong>de</strong> Carreteras <strong>de</strong>l País Vasco<br />
9
Sistema <strong>de</strong> referencia y búsqueda <strong>de</strong> <strong>la</strong> información por <strong>de</strong>nominación <strong>de</strong> carretera, PK y sentido. Por<br />
otro <strong>la</strong>do <strong>la</strong>s funciones genéricas <strong>de</strong> ArcGis han permitido <strong>la</strong> incorporación <strong>de</strong> <strong>la</strong> información cartográfica<br />
existente al GIS <strong>de</strong>l P<strong>la</strong>n: cartografía a esca<strong>la</strong>s 1:10.000, 1: 25.000 y 1:50.000, ortofotos, mapas <strong>de</strong><br />
espacios naturales protegidos, etc.<br />
<strong>2.</strong>1. ANÁLISIS ESTRUCTURAL<br />
<strong>2.</strong>1.1 Densidad <strong>de</strong> carreteras<br />
A lo <strong>la</strong>rgo <strong>de</strong> este epígrafe se analizan, tanto para <strong>la</strong> Red Funcional como para <strong>la</strong> Red Objeto, <strong>la</strong> longitud <strong>de</strong><br />
<strong>la</strong>s diferentes tipologías <strong>de</strong> carreteras existentes, estableciéndose diferentes indicadores que muestran <strong>la</strong><br />
<strong>de</strong>nsidad <strong>de</strong> <strong>la</strong> <strong>red</strong> en función <strong>de</strong> <strong>la</strong> pob<strong>la</strong>ción y <strong>la</strong> superficie <strong>de</strong> cada Territorio Histórico y el conjunto <strong>de</strong>l<br />
País Vasco.<br />
<strong>2.</strong>1.1.1. Red Funcional<br />
En <strong>la</strong> Red Funcional, se distinguen tres tipologías <strong>de</strong> re<strong>de</strong>s atendiendo a su funcionalidad, según se indica en<br />
<strong>la</strong> jerarquización <strong>de</strong> <strong>la</strong> Red <strong>de</strong> Carreteras <strong>de</strong>l País Vasco:<br />
√ Red <strong>de</strong> Interés Preferente.<br />
√ Red Básica.<br />
√ Red Comarcal.<br />
Distribución <strong>de</strong> carreteras<br />
La Red Funcional <strong>de</strong>l País Vasco está compuesta por 1.678 km <strong>de</strong> carreteras <strong>de</strong> acuerdo con <strong>la</strong> siguiente<br />
distribución:<br />
RED FUNCIONAL DE LA COMUNIDAD AUTÓNOMA DEL PAÍS VASCO<br />
SEGÚN TIPO DE RED (KM)<br />
Tipo <strong>de</strong> Red Á<strong>la</strong>va Bizkaia Gipuzkoa País Vasco<br />
Red <strong>de</strong> Interés Preferente 195 228 296 719<br />
Red Básica 145 205 95 445<br />
Red Comarcal 191 174 149 514<br />
Total 531 607 540 1.678<br />
Fuente: E<strong>la</strong>boración propia.<br />
El Territorio Histórico que concentra el mayor número <strong>de</strong> kilómetros <strong>de</strong> Red Funcional es Bizkaia (607<br />
kilómetros), que cuenta con un 36,2% <strong>de</strong>l total <strong>de</strong> <strong>la</strong> misma. Á<strong>la</strong>va y Gipuzkoa presentan una longitud <strong>de</strong><br />
carreteras <strong>de</strong> <strong>la</strong> Red Funcional muy simi<strong>la</strong>r entre sí; un 31,6% <strong>de</strong>l total en el caso <strong>de</strong> Á<strong>la</strong>va y un 32,2% en el<br />
<strong>de</strong> Gipuzkoa.<br />
En función <strong>de</strong> <strong>la</strong> tipología <strong>de</strong> carreteras <strong>la</strong> Red Funcional se distribuye así:<br />
RED FUNCIONAL DE LA COMUNIDAD AUTÓNOMA DEL PAÍS VASCO<br />
SEGÚN TIPOLOGÍA DE CARRETERAS (KM)<br />
Tipo <strong>de</strong> Red Á<strong>la</strong>va Bizkaia Gipuzkoa País Vasco<br />
Autopistas 62 86 105 253<br />
Autovías y vías <strong>de</strong> doble calzada 103 75 69 247<br />
Carreteras convencionales 366 446 366 1.178<br />
Total 531 607 540 1.678<br />
Fuente: E<strong>la</strong>boración propia.<br />
10<br />
Revisión <strong>de</strong>l Segundo P<strong>la</strong>n General <strong>de</strong> Carreteras <strong>de</strong>l País Vasco
DISTRIBUCIÓN DE LA LONGITUD DE CARRETERAS EN LA RED FUNCIONAL SEGÚN TIPOLOGÍA<br />
Y TERRITORIO HISTÓRICO (KM)<br />
500<br />
450<br />
400<br />
350<br />
300<br />
250<br />
200<br />
150<br />
100<br />
50<br />
0<br />
Autopistas Autovías y Vías <strong>de</strong> doble<br />
calzada<br />
Á<strong>la</strong>va Bizkaia Gipuzkoa<br />
Fuente: E<strong>la</strong>boración propia.<br />
Por Territorio Histórico <strong>la</strong> distribución queda como sigue:<br />
Carreteras convencionales<br />
DISTRIBUCIÓN DE LA RED FUNCIONAL SEGÚN TIPOLOGÍA<br />
70%<br />
(%)<br />
15%<br />
15%<br />
Autopistas Autovías y Vías <strong>de</strong> doble calzada Carreteras convencionales<br />
Fuente: E<strong>la</strong>boración propia.<br />
El mayor porcentaje correspon<strong>de</strong> a <strong>la</strong>s carreteras convencionales, que alcanzan el 70%. Las Autopistas y<br />
Autovías y Vías <strong>de</strong> doble calzada suponen, en conjunto, el 30% <strong>de</strong> <strong>la</strong> Red Funcional.<br />
DISTRIBUCIÓN DE LA RED FUNCIONAL SEGÚN TIPOLOGÍA.<br />
69%<br />
T. H. DE ÁLAVA (%)<br />
12%<br />
19%<br />
Autopistas Autovías y Vías <strong>de</strong> doble calzada Carreteras convencionales<br />
Fuente: E<strong>la</strong>boración propia.<br />
DISTRIBUCIÓN DE LA RED FUNCIONAL SEGÚN TIPOLOGÍA.<br />
74%<br />
T. H. DE BIZKAIA (%)<br />
14%<br />
12%<br />
Autopistas Autovías y Vías <strong>de</strong> doble calzada Carreteras convencionales<br />
Fuente: E<strong>la</strong>boración propia.<br />
11<br />
Revisión <strong>de</strong>l Segundo P<strong>la</strong>n General <strong>de</strong> Carreteras <strong>de</strong>l País Vasco
DISTRIBUCIÓN DE LA RED FUNCIONAL SEGÚN TIPOLOGÍA.<br />
68%<br />
T. H. DE GIPUZKOA (%)<br />
19%<br />
13%<br />
Autopistas Autovías y Vías <strong>de</strong> doble calzada Carreteras convencionales<br />
Fuente: E<strong>la</strong>boración propia.<br />
De los tres Territorios Históricos Gipuzkoa es el que cuenta con mayor porcentaje <strong>de</strong> <strong>la</strong> Comunidad<br />
Autónoma en cuanto a Autopistas, Autovías y Vías <strong>de</strong> doble calzada, con un 32% <strong>de</strong> su Red Funcional. Los<br />
otros dos Territorios alcanzan un 31% en el caso <strong>de</strong> Á<strong>la</strong>va y un 26% en el <strong>de</strong> Bizkaia.<br />
La distribución <strong>de</strong> <strong>la</strong> Red Funcional por tipo <strong>de</strong> <strong>red</strong>, Territorio Histórico y por tipología <strong>de</strong> carreteras se<br />
presenta en <strong>la</strong>s siguientes tab<strong>la</strong>s y gráficos:<br />
RED DE INTERÉS PREFERENTE DE LA COMUNIDAD AUTÓNOMA DEL PAÍS VASCO<br />
(KM)<br />
Tipo <strong>de</strong> Red Á<strong>la</strong>va Bizkaia Gipuzkoa País Vasco<br />
Autopistas 62 86 105 253<br />
Autovías y vías <strong>de</strong> doble calzada 101 44 69 214<br />
Carreteras convencionales 32 98 122 252<br />
Total 195 228 296 719<br />
Fuente: E<strong>la</strong>boración propia.<br />
DISTRIBUCIÓN DE LA LONGITUD DE CARRETERAS EN LA RED DE INTERÉS PREFERENTE SEGÚN<br />
TIPOLOGÍA Y TERRITORIO HISTÓRICO<br />
150<br />
125<br />
100<br />
75<br />
50<br />
25<br />
0<br />
(KM)<br />
Autopistas Autovías y Vías <strong>de</strong> doble<br />
calzada<br />
Á<strong>la</strong>va Bizkaia Gipuzkoa<br />
Fuente: E<strong>la</strong>boración propia.<br />
Carreteras convencionales<br />
DISTRIBUCIÓN DE LA RED DE INTERÉS PREFERENTE SEGÚN TIPOLOGÍA<br />
35%<br />
(%)<br />
30%<br />
35%<br />
Autopistas Autovías y Vías <strong>de</strong> doble calzada Carreteras convencionales<br />
Fuente: E<strong>la</strong>boración propia.<br />
12<br />
Revisión <strong>de</strong>l Segundo P<strong>la</strong>n General <strong>de</strong> Carreteras <strong>de</strong>l País Vasco
En lo que se refiere a <strong>la</strong> Red <strong>de</strong> Interés Preferente, el porcentaje <strong>de</strong> Autopistas, Autovías y Vías <strong>de</strong> doble<br />
calzada que <strong>la</strong> integran es <strong>de</strong>l 65% en su conjunto.<br />
DISTRIBUCIÓN DE LA RED INTERÉS PREFERENTE SEGÚN TIPOLOGÍA. T. H. DE ÁLAVA<br />
16%<br />
52%<br />
(%)<br />
32%<br />
Autopistas Autovías y Vías <strong>de</strong> doble calzada Carreteras convencionales<br />
Fuente: E<strong>la</strong>boración propia.<br />
DISTRIBUCIÓN DE LA RED DE INTERÉS PREFERENTE SEGÚN TIPOLOGÍA. T. H. DE BIZKAIA<br />
43%<br />
(%)<br />
19%<br />
38%<br />
Autopistas Autovías y Vías <strong>de</strong> doble calzada Carreteras convencionales<br />
Fuente: E<strong>la</strong>boración propia.<br />
DISTRIBUCIÓN DE LA RED DE INTERÉS PREFERENTE SEGÚN TIPOLOGÍA. T. H. DE GIPUZKOA<br />
42%<br />
(%)<br />
23%<br />
35%<br />
Autopistas Autovías y Vías <strong>de</strong> doble calzada Carreteras convencionales<br />
Fuente: E<strong>la</strong>boración propia.<br />
En este caso, es Á<strong>la</strong>va el Territorio que cuenta con un mayor porcentaje <strong>de</strong> Autopistas, Autovías y Vías <strong>de</strong><br />
doble calzada, alcanzando un 84% <strong>de</strong> <strong>la</strong> longitud total <strong>de</strong> su Red <strong>de</strong> Interés Preferente.<br />
La distribución <strong>de</strong> cada tipología <strong>de</strong> carretera <strong>de</strong> <strong>la</strong> Red Funcional en los Territorios Históricos permite<br />
realizar un diagnóstico <strong>de</strong> <strong>la</strong> <strong>situación</strong> <strong>actual</strong> referente al reparto territorial <strong>de</strong> <strong>la</strong>s infraestructuras y a <strong>la</strong><br />
importancia que <strong>la</strong> <strong>red</strong> <strong>de</strong> cada territorio tiene para <strong>la</strong> accesibilidad y comunicación territorial:<br />
13<br />
Revisión <strong>de</strong>l Segundo P<strong>la</strong>n General <strong>de</strong> Carreteras <strong>de</strong>l País Vasco
DISTRIBUCIÓN DE LA RED DE AUTOPISTAS EN LA RED DE INTERÉS PREFERENTE<br />
42%<br />
SEGÚN TERRITORIO HISTÓRICO (%)<br />
Á<strong>la</strong>va Bizkaia Gipuzkoa<br />
Fuente: E<strong>la</strong>boración propia.<br />
Gipuzkoa es el Territorio que cuenta con el mayor porcentaje <strong>de</strong> Autopistas <strong>de</strong> <strong>la</strong> Red <strong>de</strong> Interés Preferente,<br />
con un 42% <strong>de</strong>l total <strong>de</strong> <strong>la</strong> Comunidad Autónoma <strong>de</strong>l País Vasco. Le sigue Bizkaia con un 34% y Á<strong>la</strong>va con<br />
un 24%.<br />
DISTRIBUCIÓN DE LA RED DE INTERÉS PREFERENTE SEGÚN TERRITORIO HISTÓRICO (%)<br />
41%<br />
32%<br />
Á<strong>la</strong>va Bizkaia Gipuzkoa<br />
Fuente: E<strong>la</strong>boración propia.<br />
34%<br />
24%<br />
27%<br />
En cuanto al conjunto <strong>de</strong> <strong>la</strong> Red <strong>de</strong> Interés Preferente, el mayor porcentaje sigue correspondiendo a<br />
Gipuzkoa, con un 41%, seguido por Bizkaia con un 32% y Á<strong>la</strong>va con un 27%.<br />
Por su parte, en lo que se refiere a <strong>la</strong> Red Básica <strong>la</strong> distribución es <strong>la</strong> siguiente:<br />
RED BÁSICA DE LA COMUNIDAD AUTÓNOMA DEL PAÍS VASCO (KM)<br />
Tipo <strong>de</strong> Red Á<strong>la</strong>va Bizkaia Gipuzkoa País Vasco<br />
Autopistas 0 0 0 0<br />
Autovías y vías <strong>de</strong> doble calzada 2 31 0 33<br />
Carreteras convencionales 143 174 95 412<br />
Total 145 205 95 445<br />
Fuente: E<strong>la</strong>boración propia.<br />
En cuanto a <strong>la</strong> Red Básica, tan sólo 33 kilómetros <strong>de</strong> <strong>la</strong> misma correspon<strong>de</strong>n a Autovías y Vías <strong>de</strong> doble<br />
calzada, <strong>de</strong> los cuales <strong>la</strong> mayor parte se encuentran en Bizkaia, en carreteras situadas en el entorno <strong>de</strong>l<br />
Bilbao Metropolitano. El resto <strong>de</strong> <strong>la</strong> Red Básica lo conforman carreteras convencionales.<br />
DISTRIBUCIÓN DE LA LONGITUD DE CARRETERAS EN LA RED BÁSICA SEGÚN TIPOLOGÍA Y<br />
TERRITORIO HISTÓRICO (KM)<br />
200<br />
150<br />
100<br />
50<br />
0<br />
Autopistas Autovías y vías <strong>de</strong> doble<br />
calzada<br />
Á<strong>la</strong>va Bizkaia Gipuzkoa<br />
Fuente: E<strong>la</strong>boración propia.<br />
Carreteras convencionales<br />
Según tipología <strong>de</strong> carreteras tan sólo el 7% <strong>de</strong> <strong>la</strong> Red Básica son Autovías y Vías <strong>de</strong> doble calzada, siendo<br />
el 93% restante carreteras convencionales. Por su parte, ninguna Autopista <strong>de</strong> <strong>la</strong> Comunidad Autónoma<br />
forma parte <strong>de</strong> <strong>la</strong> Red Básica.<br />
14<br />
Revisión <strong>de</strong>l Segundo P<strong>la</strong>n General <strong>de</strong> Carreteras <strong>de</strong>l País Vasco
DISTRIBUCIÓN DE LA RED BÁSICA SEGÚN TIPOLOGÍA DE CARRETERAS<br />
93%<br />
(%)<br />
0% 7%<br />
Autopistas Autovías y Vías <strong>de</strong> doble calzada Carreteras convencionales<br />
Fuente: E<strong>la</strong>boración propia.<br />
Por Territorios Históricos Á<strong>la</strong>va cuenta con un 1,3% <strong>de</strong> su Red Básica con tipología <strong>de</strong> Autovías y Vías <strong>de</strong><br />
Doble Calzada, siendo este porcentaje <strong>de</strong>l 15,2% en el caso <strong>de</strong> Bizkaia y no existiendo carreteras <strong>de</strong> esta<br />
tipología en <strong>la</strong> <strong>red</strong> Básica <strong>de</strong> Gipuzkoa.<br />
Finalmente, en cuanto al global <strong>de</strong> <strong>la</strong> Comunidad Autónoma, es Bizkaia el Territorio con el mayor porcentaje<br />
<strong>de</strong> carreteras <strong>de</strong> <strong>la</strong> Red Básica, con un 46%, seguido <strong>de</strong> Á<strong>la</strong>va con un 33% y Gipuzkoa con un 21%.<br />
DISTRIBUCIÓN DE LA RED BÁSICA SEGÚN TERRITORIO HISTÓRICO<br />
21%<br />
46%<br />
(%)<br />
Á<strong>la</strong>va Bizkaia Gipuzkoa<br />
Fuente: E<strong>la</strong>boración propia.<br />
En cuanto a <strong>la</strong> Red Comarcal, <strong>la</strong> distribución es <strong>la</strong> siguiente:<br />
33%<br />
RED COMARCAL DE LA COMUNIDAD AUTÓNOMA DEL PAÍS VASCO (KM)<br />
Tipo <strong>de</strong> Red Á<strong>la</strong>va Bizkaia Gipuzkoa País Vasco<br />
Autopistas 0 0 0 0<br />
Autovías y vías <strong>de</strong> doble calzada 0 0 0 0<br />
Carreteras convencionales 191 174 149 514<br />
Total 191 174 149 514<br />
Fuente: E<strong>la</strong>boración propia.<br />
15<br />
Revisión <strong>de</strong>l Segundo P<strong>la</strong>n General <strong>de</strong> Carreteras <strong>de</strong>l País Vasco
DISTRIBUCIÓN DE LA RED COMARCAL SEGÚN TERRITORIO HISTÓRICO<br />
29%<br />
34%<br />
(%)<br />
Á<strong>la</strong>va Bizkaia Gipuzkoa<br />
Fuente: E<strong>la</strong>boración propia.<br />
La totalidad <strong>de</strong> <strong>la</strong> Red Comarcal correspon<strong>de</strong> a carreteras convencionales, siendo Á<strong>la</strong>va <strong>la</strong> que cuenta con el<br />
mayor porcentaje sobre el total <strong>de</strong> <strong>la</strong> Comunidad Autónoma (38%), seguido por Bizkaia (34%) y Gipuzkoa<br />
(28%).<br />
A partir <strong>de</strong> esta información se pue<strong>de</strong>n extraer <strong>la</strong>s siguientes conclusiones:<br />
√ El Territorio Histórico con mayor porcentaje <strong>de</strong> Red Comarcal es Á<strong>la</strong>va, con un 38% <strong>de</strong>l total <strong>de</strong> <strong>la</strong><br />
Red Funcional <strong>de</strong>l Territorio.<br />
√ El Territorio Histórico con mayor porcentaje <strong>de</strong> Autopistas es Gipuzkoa, con un 45% <strong>de</strong>l total <strong>de</strong>l País<br />
Vasco.<br />
√ En Gipuzkoa, <strong>la</strong>s Autopistas y <strong>la</strong>s Autovías y Vías <strong>de</strong> Doble Calzada representan un 35% <strong>de</strong> su Red<br />
Funcional superando, por tanto, <strong>la</strong> media <strong>de</strong>l País Vasco que es <strong>de</strong> un 30%. Los restantes Territorios<br />
Históricos se encuentran por <strong>de</strong>bajo: un 25% en Bizkaia, y un 30% en Á<strong>la</strong>va.<br />
√ Bizkaia es el Territorio Histórico que presenta mayor porcentaje <strong>de</strong> carreteras <strong>de</strong> <strong>la</strong> Red Básica: un<br />
33% <strong>de</strong>l total <strong>de</strong> <strong>la</strong> Red Funcional <strong>de</strong> este Territorio.<br />
Densidad <strong>de</strong> <strong>la</strong> Red<br />
Para <strong>de</strong>terminar <strong>la</strong> <strong>de</strong>nsidad <strong>de</strong> <strong>la</strong> Red Funcional se utilizan dos indicadores:<br />
37%<br />
√ Km <strong>de</strong> <strong>red</strong> / 1.000 habitantes, como reflejo <strong>de</strong> <strong>la</strong> <strong>situación</strong> <strong>de</strong> <strong>la</strong> <strong>red</strong> frente a aspectos pob<strong>la</strong>cionales,<br />
siendo los últimos datos <strong>de</strong> pob<strong>la</strong>ción consi<strong>de</strong>rados los referentes a 1-01-04.<br />
√ Km <strong>de</strong> <strong>red</strong> / km 2 <strong>de</strong> superficie territorial, como representación <strong>de</strong> <strong>la</strong> distribución territorial <strong>de</strong> <strong>la</strong> <strong>red</strong>.<br />
Los resultados con respecto al primero <strong>de</strong> los indicadores son los siguientes:<br />
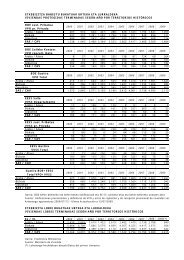
RED FUNCIONAL DE LA COMUNIDAD AUTÓNOMA DEL PAÍS VASCO<br />
KILÓMETROS POR 1.000 HABITANTES<br />
Tipo <strong>de</strong> Red Á<strong>la</strong>va Bizkaia Gipuzkoa País Vasco<br />
Autopistas 0,21 0,08 0,15 0,12<br />
Autovías y vías <strong>de</strong> doble calzada 0,35 0,07 0,10 0,12<br />
Carreteras convencionales 1,24 0,40 0,53 0,56<br />
Total 1,79 0,55 0,79 0,80<br />
Atendiendo al indicador pob<strong>la</strong>cional, cabe indicar:<br />
Fuente: E<strong>la</strong>boración propia.<br />
√ Á<strong>la</strong>va es el Territorio Histórico con mayor <strong>de</strong>nsidad <strong>de</strong> carreteras <strong>de</strong> <strong>la</strong> Red Funcional por habitante,<br />
consi<strong>de</strong>rada ésta tanto en su conjunto (1,79 km / 1.000 habitantes) como según cada una <strong>de</strong> <strong>la</strong>s<br />
tipologías <strong>de</strong> <strong>red</strong>.<br />
√ Bizkaia se encuentra en el extremo opuesto, ya que únicamente cuenta con 0,55 km / 1.000<br />
habitantes cifra por <strong>de</strong>bajo <strong>de</strong> <strong>la</strong> media <strong>de</strong> <strong>la</strong> CAPV que se sitúa en 0,80 km / 1.000 habitantes.<br />
√ Gipuzkoa es el Territorio Histórico que se encuentra más cercano a <strong>la</strong> media en todas <strong>la</strong>s tipologías,<br />
con un indicador global <strong>de</strong> 0,79 kilómetros <strong>de</strong> Red Funcional por 1.000 habitantes, ligeramente inferior a<br />
<strong>la</strong> media <strong>de</strong> <strong>la</strong> Comunidad Autónoma.<br />
16<br />
Revisión <strong>de</strong>l Segundo P<strong>la</strong>n General <strong>de</strong> Carreteras <strong>de</strong>l País Vasco
2,0<br />
1,8<br />
1,6<br />
1,4<br />
1,2<br />
1,0<br />
0,8<br />
0,6<br />
0,4<br />
0,2<br />
0,0<br />
DENSIDAD DE LA RED FUNCIONAL EN LA CAPV, SEGÚN TIPOLOGÍA<br />
(KM / 1.000 HABITANTES)<br />
ALAVA BIZKAIA GIPUZKOA TOTAL<br />
AUTOPISTAS AUTOVÍAS Y VÍAS DE DOBLE CALZADA CARRETERAS CONVENCIONALES TOTAL<br />
Fuente: E<strong>la</strong>boración propia.<br />
Según datos <strong>de</strong>l Informe <strong>de</strong> primavera 2004 (datos 2002) OTEUS <strong>de</strong>l Gobierno Vasco, en re<strong>la</strong>ción con los<br />
datos para el total <strong>de</strong>l Estado, que se sitúan en 3,92 kilómetros <strong>de</strong> carreteras por 1.000 habitantes, <strong>la</strong> CAPV<br />
se encuentra c<strong>la</strong>ramente por <strong>de</strong>bajo. El ratio para el total <strong>de</strong> carreteras <strong>de</strong> <strong>la</strong> CAPV, no sólo <strong>la</strong>s <strong>de</strong> <strong>la</strong> Red<br />
Funcional, alcanza 2,02 kilómetros por 1.000 habitantes.<br />
4,5<br />
4,0<br />
3,5<br />
3,0<br />
2,5<br />
2,0<br />
1,5<br />
1,0<br />
0,5<br />
0,0<br />
DENSIDAD DE LA RED EN LA CAPV Y EL RESTO DEL ESTADO<br />
0,80<br />
(KM / 1.000 HABITANTES)<br />
2,02<br />
3,92<br />
RED FUNCIONAL CAPV TOTAL RED CAPV ESTADO ESPAÑOL<br />
Fuente: Informe OTEUS.<br />
En cuanto al indicador territorial los resultados son los siguientes:<br />
RED FUNCIONAL DE LA COMUNIDAD AUTÓNOMA DEL PAÍS VASCO<br />
KILÓMETROS POR KM 2 DE SUPERFICIE<br />
Tipo <strong>de</strong> Red Á<strong>la</strong>va Bizkaia Gipuzkoa País Vasco<br />
Autopistas 0,02 0,04 0,05 0,03<br />
Autovías y vías <strong>de</strong> doble calzada 0,03 0,03 0,04 0,03<br />
Carreteras convencionales 0,12 0,21 0,18 0,16<br />
Total 0,17 0,28 0,27 0,23<br />
Si se atien<strong>de</strong> al indicador territorial, se observa que:<br />
Fuente: E<strong>la</strong>boración propia.<br />
√ Tanto Gipuzkoa como Bizkaia superan <strong>la</strong> media <strong>de</strong> <strong>de</strong>nsidad <strong>de</strong> carreteras <strong>de</strong>l País Vasco con 0,27 y<br />
0,28 km / km 2 , mientras que Á<strong>la</strong>va se encuentra c<strong>la</strong>ramente por <strong>de</strong>bajo, con 0,17 km / km 2 .<br />
√ Gipuzkoa es el Territorio que cuenta con mayor <strong>de</strong>nsidad <strong>de</strong> Autopistas, Autovías y Vías <strong>de</strong> doble<br />
calzada, con 0,09 km / km 2 en <strong>la</strong> suma <strong>de</strong> ambos conceptos.<br />
√ La mayor <strong>de</strong>nsidad <strong>de</strong> carreteras convencionales <strong>la</strong> tiene Bizkaia con 0,21 km / km 2 .<br />
0,30<br />
0,25<br />
0,20<br />
0,15<br />
0,10<br />
0,05<br />
0,00<br />
DENSIDAD DE LA RED FUNCIONAL EN LA CAPV, SEGÚN TIPOLOGÍA<br />
(KM/ KM 2 )<br />
ALAVA BIZKAIA GIPUZKOA TOTAL<br />
AUTOPISTAS AUTOVÍAS Y VÍAS DE DOBLE CALZADA CARRETERAS CONVENCIONALES TOTAL<br />
Fuente: E<strong>la</strong>boración propia.<br />
17<br />
Revisión <strong>de</strong>l Segundo P<strong>la</strong>n General <strong>de</strong> Carreteras <strong>de</strong>l País Vasco
En este caso, y también según datos <strong>de</strong>l Informe OTEUS, al contrario <strong>de</strong> lo que ocurría con el ratio por<br />
pob<strong>la</strong>ción, en cuanto a <strong>de</strong>nsidad <strong>de</strong> carreteras <strong>la</strong> CAPV arroja ratios superiores a los <strong>de</strong>l conjunto <strong>de</strong>l Estado.<br />
Así, mientras que el Estado alcanza <strong>la</strong> cifra <strong>de</strong> 0,32 kilómetros <strong>de</strong> carreteras por kilómetro cuadrado <strong>de</strong><br />
superficie, <strong>la</strong> totalidad <strong>de</strong> <strong>la</strong> <strong>red</strong> <strong>de</strong> carreteras <strong>de</strong> <strong>la</strong> CAPV alcanza el 0,59, que es algo más <strong>de</strong>l doble <strong>de</strong>l ratio<br />
alcanzado por <strong>la</strong> Red Funcional.<br />
0,7<br />
0,6<br />
0,5<br />
0,4<br />
0,3<br />
0,2<br />
0,1<br />
0,0<br />
DENSIDAD DE LA RED EN LA CAPV Y EL RESTO DEL ESTADO<br />
0,23<br />
KILÓMETROS POR KM 2 DE SUPERFICIE<br />
0,59<br />
0,32<br />
RED FUNCIONAL CAPV TOTAL RED CAPV ESTADO ESPAÑOL<br />
Fuente: Informe OTEUS.<br />
Por otra parte, en lo que se refiere al ratio <strong>de</strong> kilómetros <strong>de</strong> Autopistas, Autovías y Vías <strong>de</strong> doble calzada por<br />
kilómetro cuadrado, <strong>la</strong> CAPV se encuentra bien posicionada con respecto a otros países europeos. Así,<br />
mientras que <strong>la</strong> CAPV alcanza un ratio <strong>de</strong> 0,0692 kilómetros por km 2 , el ratio en Ho<strong>la</strong>nda es <strong>de</strong> 0,061, en<br />
Bélgica <strong>de</strong> 0,0566 y en Alemania <strong>de</strong> 0,030<strong>2.</strong><br />
DENSIDAD DE LA RED EN LA CAPV Y EUROPA. KILÓMETROS POR KM 2 DE SUPERFICIE<br />
0,08<br />
0,07<br />
0,06<br />
0,05<br />
0,04<br />
0,03<br />
0,02<br />
0,01<br />
0,00<br />
0,0692<br />
0,0610<br />
0,0566<br />
0,0302<br />
CAPV HOLANDA BELGICA ALEMANIA<br />
<strong>2.</strong>1.1.<strong>2.</strong> Red Objeto <strong>de</strong>l P<strong>la</strong>n<br />
Fuente: Informe OTEUS.<br />
La Red Objeto se compone <strong>de</strong> dos tipologías <strong>de</strong> re<strong>de</strong>s atendiendo a su funcionalidad, según se indica en <strong>la</strong><br />
jerarquización <strong>de</strong> <strong>la</strong> Red <strong>de</strong> Carreteras <strong>de</strong>l País Vasco:<br />
√ Red <strong>de</strong> Interés Preferente.<br />
√ Red Básica.<br />
Ninguna carretera <strong>de</strong> <strong>la</strong> Red Comarcal se encuentra incluida en esta <strong>red</strong>, mientras que si lo hacen <strong>la</strong> mayoría<br />
<strong>de</strong> <strong>la</strong>s carreteras <strong>de</strong> <strong>la</strong> Red <strong>de</strong> Interés Preferente y <strong>de</strong> <strong>la</strong> Red Básica.<br />
Distribución <strong>de</strong> carreteras<br />
La Red Objeto <strong>de</strong>l País Vasco que se analiza en este documento está integrada por 1.141 kilómetros <strong>de</strong><br />
carreteras, 719 kilómetros <strong>de</strong> carreteras <strong>de</strong> <strong>la</strong> Red <strong>de</strong> Interés Preferente; y 422 kilómetros <strong>de</strong> carreteras <strong>de</strong><br />
<strong>la</strong> Red Básica.<br />
18<br />
Revisión <strong>de</strong>l Segundo P<strong>la</strong>n General <strong>de</strong> Carreteras <strong>de</strong>l País Vasco
RED OBJETO DE LA COMUNIDAD AUTÓNOMA DEL PAÍS VASCO<br />
SEGÚN TIPO DE RED (KM)<br />
Tipo <strong>de</strong> Red Á<strong>la</strong>va Bizkaia Gipuzkoa País Vasco<br />
Interés Preferente 195 228 296 719<br />
Básica 135 192 95 422<br />
Total 330 420 391 1.141<br />
Fuente: E<strong>la</strong>boración propia.<br />
Según tipología <strong>de</strong> carretera <strong>la</strong> Red Objeto se distribuye tal como se muestra en <strong>la</strong> tab<strong>la</strong> siguiente:<br />
RED OBJETO DE LA COMUNIDAD AUTÓNOMA DEL PAÍS VASCO<br />
SEGÚN TIPOLOGÍA DE CARRETERAS (KM)<br />
Tipo <strong>de</strong> Red Á<strong>la</strong>va Bizkaia Gipuzkoa País Vasco<br />
Autopistas 62 86 105 253<br />
Autovías y vías <strong>de</strong> doble calzada 103 76 69 248<br />
Carreteras convencionales 165 258 217 640<br />
Total 330 420 391 1.141<br />
Fuente: E<strong>la</strong>boración propia.<br />
La mayor parte <strong>de</strong> <strong>la</strong> Red Objeto se concentra en Bizkaia, que cuenta con 420 kilómetros, que representan<br />
el 36,8% sobre el total. Á<strong>la</strong>va es el Territorio que cuenta con menor longitud, 330 kilómetros, con un<br />
porcentaje <strong>de</strong>l 28,9%.<br />
Gipuzkoa <strong>de</strong>staca por ser el Territorio que cuenta con mayor longitud <strong>de</strong> Autopistas, Autovías y Vías <strong>de</strong><br />
doble calzada <strong>de</strong> <strong>la</strong> Red Objeto, sumando 174 kilómetros en estas tipologías, lo que representa el 44% <strong>de</strong> su<br />
Red Objeto y el 35% <strong>de</strong>l total <strong>de</strong> este tipo <strong>de</strong> carreteras en <strong>la</strong> Red Objeto <strong>de</strong> <strong>la</strong> Comunidad Autónoma.<br />
DISTRIBUCIÓN DE LA LONGITUD DE CARRETERAS EN LA RED OBJETO SEGÚN TIPOLOGÍA Y<br />
TERRITORIO HISTÓRICO<br />
300<br />
250<br />
200<br />
150<br />
100<br />
50<br />
0<br />
(KM)<br />
Autopistas Autovías y vías <strong>de</strong> doble<br />
calzada<br />
Á<strong>la</strong>va Bizkaia Gipuzkoa<br />
Fuente: E<strong>la</strong>boración propia.<br />
Según <strong>la</strong> tipología <strong>de</strong> carreteras <strong>la</strong> Red Objeto se distribuye como sigue:<br />
Carreteras convencionales<br />
DISTRIBUCIÓN DE LA RED OBJETO SEGÚN TIPOLOGÍA<br />
56%<br />
(%)<br />
22%<br />
22%<br />
Autopistas Autovías y vías <strong>de</strong> doble calzada Carreteras convencionales<br />
Fuente: E<strong>la</strong>boración propia.<br />
19<br />
Revisión <strong>de</strong>l Segundo P<strong>la</strong>n General <strong>de</strong> Carreteras <strong>de</strong>l País Vasco
La Red Objeto está compuesta en un 22% por autopistas, un 22% <strong>de</strong> Autovías y vías <strong>de</strong> doble calzada y un<br />
56% <strong>de</strong> carreteras convencionales.<br />
A<strong>de</strong>más, tal y como ocurre con <strong>la</strong> Red Funcional, esta distribución tipológica no es igual en todos los<br />
Territorios Históricos.<br />
DISTRIBUCIÓN DE LA RED OBJETO SEGÚN TIPOLOGÍA. T. H. DE ÁLAVA<br />
50%<br />
(%)<br />
19%<br />
31%<br />
Autopistas Autovías y vías <strong>de</strong> doble calzada Carreteras convencionales<br />
Fuente: E<strong>la</strong>boración propia.<br />
DISTRIBUCIÓN DE LA RED OBJETO SEGÚN TIPOLOGÍA. T. H. DE BIZKAIA<br />
61%<br />
(%)<br />
21%<br />
18%<br />
Autopistas Autovías y vías <strong>de</strong> doble calzada Carreteras convencionales<br />
Fuente: E<strong>la</strong>boración propia.<br />
DISTRIBUCIÓN DE LA RED OBJETO SEGÚN TIPOLOGÍA. T. H. DE GIPUZKOA<br />
55%<br />
(%)<br />
27%<br />
18%<br />
Autopistas Autovías y vías <strong>de</strong> doble calzada Carreteras convencionales<br />
Fuente: E<strong>la</strong>boración propia.<br />
20<br />
Revisión <strong>de</strong>l Segundo P<strong>la</strong>n General <strong>de</strong> Carreteras <strong>de</strong>l País Vasco
A <strong>la</strong> vista <strong>de</strong> estos datos <strong>de</strong> <strong>la</strong> Red Objeto <strong>de</strong>l P<strong>la</strong>n se pue<strong>de</strong>n extraer <strong>la</strong>s siguientes conclusiones:<br />
√ Gipuzkoa es el único Territorio Histórico que presenta un porcentaje <strong>de</strong> Autopistas superior a <strong>la</strong> media<br />
<strong>de</strong>l País Vasco, con un 27%.<br />
Á<strong>la</strong>va cuenta con un 31% <strong>de</strong> autovías, media superior a <strong>la</strong> <strong>de</strong>l País Vasco.<br />
√ El mayor porcentaje <strong>de</strong> carreteras convencionales lo tiene Bizkaia, que alcanza el 61% <strong>de</strong>l total,<br />
superando <strong>la</strong> media <strong>de</strong>l País Vasco.<br />
La distribución <strong>de</strong> cada tipología <strong>de</strong> carretera <strong>de</strong> <strong>la</strong> Red Objeto <strong>de</strong>l P<strong>la</strong>n en los Territorios Históricos permite<br />
analizar <strong>la</strong> importancia que <strong>la</strong> <strong>red</strong> <strong>de</strong> cada territorio tiene para <strong>la</strong> accesibilidad y comunicación territorial:<br />
DISTRIBUCIÓN DE AUTOPISTAS SEGÚN TERRITORIO HISTÓRICO<br />
42%<br />
(%)<br />
Á<strong>la</strong>va Bizkaia Gipuzkoa<br />
Fuente: E<strong>la</strong>boración propia.<br />
34%<br />
24%<br />
DISTRIBUCIÓN DE AUTOVÍAS Y VÍAS DE DOBLE CALZADA SEGÚN TERRITORIO HISTÓRICO<br />
28%<br />
30%<br />
(%)<br />
Á<strong>la</strong>va Bizkaia Gipuzkoa<br />
Fuente: E<strong>la</strong>boración propia.<br />
DISTRIBUCIÓN DE LAS CARRETERAS CONVENCIONALES SEGÚN TERRITORIO HISTÓRICO<br />
34%<br />
(%)<br />
40%<br />
Á<strong>la</strong>va Bizkaia Gipuzkoa<br />
Fuente: E<strong>la</strong>boración propia.<br />
26%<br />
42%<br />
21<br />
Revisión <strong>de</strong>l Segundo P<strong>la</strong>n General <strong>de</strong> Carreteras <strong>de</strong>l País Vasco
Atendiendo al reparto <strong>de</strong> <strong>la</strong> longitud total <strong>de</strong> cada tipología <strong>de</strong> carretera / <strong>red</strong> según Territorio Histórico, se<br />
observan aspectos como:<br />
√ Gipuzkoa es el Territorio Histórico que cuenta con mayor porcentaje <strong>de</strong> Autopistas (42%), al igual que<br />
ocurría en el caso <strong>de</strong> <strong>la</strong> Red Funcional, al estar incluidas todas el<strong>la</strong>s en ambas re<strong>de</strong>s.<br />
√ En cuanto a <strong>la</strong>s Autovías y Vías <strong>de</strong> Doble Calzada es Á<strong>la</strong>va <strong>la</strong> que cuenta con mayor porcentaje, con<br />
un 42% <strong>de</strong>l total.<br />
√ Bizkaia aglutina un 40% <strong>de</strong> <strong>la</strong>s Carreteras Convencionales. El Territorio Histórico con menor<br />
porcentaje <strong>de</strong> este tipo <strong>de</strong> carreteras es Á<strong>la</strong>va, que cuenta con un 26%.<br />
Densidad <strong>de</strong> <strong>la</strong> Red<br />
Se han utilizado los mismos indicadores que en el caso <strong>de</strong> <strong>la</strong> Red Funcional. Éstos son:<br />
√ Km <strong>de</strong> <strong>red</strong> / 1.000 habitantes, como reflejo <strong>de</strong> <strong>la</strong> <strong>situación</strong> <strong>de</strong> <strong>la</strong> <strong>red</strong> frente a aspectos pob<strong>la</strong>cionales,<br />
siendo los últimos datos <strong>de</strong> pob<strong>la</strong>ción consi<strong>de</strong>rados los referentes a 1-01-04.<br />
√ Km <strong>de</strong> <strong>red</strong> / km 2 <strong>de</strong> superficie territorial, como representación <strong>de</strong> <strong>la</strong> distribución territorial <strong>de</strong> <strong>la</strong> <strong>red</strong>.<br />
Atendiendo al indicador pob<strong>la</strong>cional, los resultados son los siguientes:<br />
cabe indicar:<br />
RED OBJETO DE LA COMUNIDAD AUTÓNOMA DEL PAÍS VASCO<br />
KILÓMETROS POR 1.000 HABITANTES<br />
Tipo <strong>de</strong> Red Á<strong>la</strong>va Bizkaia Gipuzkoa País Vasco<br />
Autopistas 0,21 0,08 0,15 0,12<br />
Autovías y vías <strong>de</strong> doble calzada 0,35 0,07 0,10 0,12<br />
Carreteras convencionales 0,56 0,23 0,32 0,31<br />
Total 1,12 0,38 0,57 0,55<br />
Fuente: E<strong>la</strong>boración propia.<br />
√ Á<strong>la</strong>va es el Territorio Histórico con mayor <strong>de</strong>nsidad <strong>de</strong> carreteras <strong>de</strong> <strong>la</strong> Red Objeto por habitante,<br />
tanto consi<strong>de</strong>rada ésta tanto en su conjunto (1,12 km / 1.000 habitantes) como según cada una <strong>de</strong> <strong>la</strong>s<br />
tipologías <strong>de</strong> <strong>red</strong>. La media <strong>de</strong> <strong>la</strong> CAPV es <strong>de</strong> 0,55 km / 1.000 habitantes, menos <strong>de</strong> <strong>la</strong> mitad <strong>de</strong>l indicador<br />
a<strong>la</strong>vés.<br />
√ Gipuzkoa se hal<strong>la</strong> en todas <strong>la</strong>s categorías en niveles cercanos a los indicadores globales <strong>de</strong> <strong>la</strong><br />
Comunidad Autónoma.<br />
√ Bizkaia es el único Territorio que presenta una <strong>de</strong>nsidad inferior a <strong>la</strong> media <strong>de</strong>l País Vasco (0,38 km /<br />
1.000 habitantes).<br />
1,2<br />
1,0<br />
0,8<br />
0,6<br />
0,4<br />
0,2<br />
0,0<br />
DENSIDAD DE LA RED OBJETO EN LA CAPV, SEGÚN TIPOLOGÍA<br />
(KM / 1.000 HABITANTES)<br />
ALAVA BIZKAIA GIPUZKOA TOTAL<br />
AUTOPISTAS AUTOVÍAS Y VÍAS DE DOBLE CALZADA CARRETERAS CONVENCIONALES TOTAL<br />
Fuente: E<strong>la</strong>boración propia.<br />
Los resultados <strong>de</strong>l indicador territorial son los siguientes:<br />
Se observa que:<br />
RED OBJETO DE LA COMUNIDAD AUTÓNOMA DEL PAÍS VASCO<br />
KILÓMETROS POR KM 2 DE SUPERFICIE<br />
Tipo <strong>de</strong> Red Á<strong>la</strong>va Bizkaia Gipuzkoa País Vasco<br />
Autopistas 0,02 0,04 0,05 0,03<br />
Autovías y vías <strong>de</strong> doble calzada 0,03 0,03 0,04 0,04<br />
Carreteras convencionales 0,06 0,12 0,11 0,09<br />
Total 0,11 0,19 0,20 0,16<br />
Fuente: E<strong>la</strong>boración propia.<br />
√ Gipuzkoa y Bizkaia tienen <strong>la</strong> mayor <strong>de</strong>nsidad territorial (0,19 km / km 2 ), cifra que supera <strong>la</strong> media <strong>de</strong>l<br />
País Vasco, que es <strong>de</strong> 0,16 km / km 2 .<br />
√ Á<strong>la</strong>va es el Territorio Histórico que tiene menor <strong>de</strong>nsidad <strong>de</strong> carreteras <strong>de</strong> <strong>la</strong> Red Objeto (0,11 km /<br />
km 2 ).<br />
22<br />
Revisión <strong>de</strong>l Segundo P<strong>la</strong>n General <strong>de</strong> Carreteras <strong>de</strong>l País Vasco
0,25<br />
0,20<br />
0,15<br />
0,10<br />
0,05<br />
0,00<br />
DENSIDAD DE LA RED FUNCIONAL EN LA CAPV, SEGÚN TIPOLOGÍA<br />
(KM/ KM 2 )<br />
ALAVA BIZKAIA GIPUZKOA TOTAL<br />
AUTOPISTAS AUTOVÍAS Y VÍAS DE DOBLE CALZADA CARRETERAS CONVENCIONALES TOTAL<br />
Fuente: E<strong>la</strong>boración propia.<br />
<strong>2.</strong>1.2 Geometría <strong>de</strong> <strong>la</strong> <strong>red</strong> y velocida<strong>de</strong>s<br />
En este apartado se analizan <strong>la</strong> geometría <strong>de</strong> <strong>la</strong> <strong>red</strong>, tanto en p<strong>la</strong>nta como en alzado, y <strong>la</strong>s velocida<strong>de</strong>s en<br />
régimen <strong>de</strong> circu<strong>la</strong>ción libre (velocida<strong>de</strong>s específicas y máximas <strong>de</strong> seguridad así como velocida<strong>de</strong>s <strong>de</strong><br />
vehículos pesados).<br />
En el Apéndice nº 1 se presentan, para cada una <strong>de</strong> <strong>la</strong>s carreteras <strong>de</strong> <strong>la</strong> Red Objeto, <strong>la</strong> p<strong>la</strong>nta y una<br />
sucesión <strong>de</strong> gráficos don<strong>de</strong> figuran los siguientes aspectos:<br />
√ Perfil longitudinal (km), con el diagrama <strong>de</strong> pendientes (%).<br />
√ Diagrama <strong>de</strong> velocida<strong>de</strong>s específicas y máximas <strong>de</strong> seguridad (km / h), con el diagrama <strong>de</strong> radios <strong>de</strong><br />
curvatura (m).<br />
√ Diagrama <strong>de</strong> velocida<strong>de</strong>s <strong>de</strong> vehículos pesados (km / h), con el diagrama <strong>de</strong> pendientes <strong>de</strong> <strong>la</strong><br />
carretera (%).<br />
Las características en p<strong>la</strong>nta <strong>de</strong> <strong>la</strong>s carreteras <strong>de</strong> <strong>la</strong> Red Objeto, son <strong>la</strong>s que se <strong>de</strong>finen a continuación:<br />
<strong>2.</strong>1.<strong>2.</strong>1. Red <strong>de</strong> Interés Preferente<br />
Autopista <strong>de</strong> Peaje AP-1: Burgos – Armiñón. Tramo Límite con Burgos – Armiñón<br />
Los radios en esta carretera son a<strong>de</strong>cuados y superiores a 350 metros, a excepción <strong>de</strong> <strong>la</strong> entrada a <strong>la</strong> p<strong>la</strong>ya<br />
<strong>de</strong> peaje.<br />
Autopista A-1: Burgos – Cantábrico. Tramo Bergara – Eibar (Maltzaga)<br />
Carretera que también consta <strong>de</strong> buenas características geométricas, con radios superiores a 300 metros a<br />
excepción <strong>de</strong> los ramales <strong>de</strong> entrada y salida a <strong>la</strong> vía.<br />
N-I: Madrid a Irun<br />
La antigua carretera <strong>de</strong> Madrid – Irun N-I atraviesa los Territorios Históricos <strong>de</strong> Á<strong>la</strong>va y Gipuzkoa <strong>de</strong>s<strong>de</strong><br />
Miranda <strong>de</strong> Ebro hasta <strong>la</strong> frontera francesa. En los tramos don<strong>de</strong> esta carretera consta <strong>de</strong> dos carriles por<br />
sentido <strong>de</strong> circu<strong>la</strong>ción, que correspon<strong>de</strong> al tramo a<strong>la</strong>vés y al tramo guipuzcoano entre el límite con Navarra y<br />
Donostia-San Sebastián, los radios son superiores a 250 metros, y en el tramo don<strong>de</strong> el número <strong>de</strong> carriles<br />
totales <strong>de</strong> <strong>la</strong> p<strong>la</strong>taforma es <strong>de</strong> dos (entre Donostia-San Sebastián y <strong>la</strong> frontera francesa), los radios llegan a<br />
<strong>red</strong>ucirse hasta 80 metros en una zona montañosa localizada entre Oiartzun e Irun.<br />
23<br />
Revisión <strong>de</strong>l Segundo P<strong>la</strong>n General <strong>de</strong> Carreteras <strong>de</strong>l País Vasco
Autopista <strong>de</strong> Peaje AP-68: Vasco Aragonesa Bilbao – Zaragoza. Tramo En<strong>la</strong>ce A-8 (Solución Sur)<br />
– Límite Rioja<br />
Se trata <strong>de</strong> una carretera <strong>de</strong> muy buenas condiciones geométricas ya que a lo <strong>la</strong>rgo <strong>de</strong> todo su trazado los<br />
radios no son inferiores a 300 metros.<br />
Autopista A-8: Autopista <strong>de</strong>l Cantábrico. Tramo Irun – Behobia – Límite con Cantabria<br />
El eje transversal entre Bizkaia y Gipuzkoa, <strong>la</strong> Autopista A-8, es una carretera con buenas condiciones<br />
geométricas, con una gran parte <strong>de</strong> su longitud con radios superiores a 250 metros, salvo en los en<strong>la</strong>ces<br />
situados a lo <strong>la</strong>rgo <strong>de</strong> <strong>la</strong> misma y que le dan acceso. Por otra parte, en el T.H. <strong>de</strong> Gipuzkoa se observa en<br />
algunos tramos un trazado en p<strong>la</strong>nta más complicado, con un 6,5% <strong>de</strong> su longitud con radios en <strong>la</strong> horquil<strong>la</strong><br />
<strong>de</strong> los 190 a 250 metros.<br />
Autopista A-15: Irurtzun – Aduna. Tramo Límite con Navarra – Aduna (N-I)<br />
Los radios en esta carretera son a<strong>de</strong>cuados y superiores a 250 metros en toda <strong>la</strong> vía.<br />
Carretera N-634: Donostia-San Sebastián – Santan<strong>de</strong>r – La Coruña. Tramo Donostia-San<br />
Sebastián – Límite con Cantabria<br />
La carretera N-634, parale<strong>la</strong> a <strong>la</strong> A-8 y que sirve <strong>de</strong> distribuidora <strong>de</strong> <strong>la</strong> misma, tiene entre Bilbao y el límite<br />
provincial <strong>de</strong> Cantabria un trazado irregu<strong>la</strong>r con radios superiores a 170 metros salvo en los siguientes<br />
casos:<br />
√ P.K. 132,2 a 133,7; tramo <strong>de</strong> radios inferiores a 130 metros en zona industrial.<br />
√ P.K. 123,2 a 125,2; trazado sinuoso que conecta <strong>la</strong>s travesías y en<strong>la</strong>ces <strong>de</strong> Ortuel<strong>la</strong> y Trapagarán.<br />
Entre Bilbao y el límite con el Territorio Histórico <strong>de</strong> Gipuzkoa los radios <strong>de</strong> <strong>la</strong> carretera son superiores a 250<br />
metros, exceptuando los casos que a continuación se <strong>de</strong>tal<strong>la</strong>n:<br />
√ P.K. 66 a 74; tramo semi-urbano muy sinuoso <strong>de</strong> radios inferiores a 100 metros. Recorre <strong>la</strong>s<br />
pob<strong>la</strong>ciones <strong>de</strong> Ermua, Zaldibar, Goierri y Aretillo.<br />
√ P.K. 97 a 99,5; tramo con dos carriles por sentido <strong>de</strong> circu<strong>la</strong>ción y con un elevado número <strong>de</strong> en<strong>la</strong>ces.<br />
Se caracteriza por contener curvas ais<strong>la</strong>das <strong>de</strong> radios inferiores a 80 metros.<br />
√ P.K. 107.6 a 108; es esta una zona con glorietas y en<strong>la</strong>ces a otras vías que hace que su radio<br />
disminuya consi<strong>de</strong>rablemente.<br />
Por último, se analiza el tramo <strong>de</strong> <strong>la</strong> carretera N-634 entre el límite con Bizkaia y Donostia-San Sebastián. El<br />
trazado <strong>de</strong> <strong>la</strong> carretera en el tramo consi<strong>de</strong>rado es irregu<strong>la</strong>r, recorriendo <strong>la</strong> costa y atravesando zonas<br />
montañosas. Esa es <strong>la</strong> razón <strong>de</strong> que en los tramos siguientes los radios no sean en ningún caso superiores a<br />
130 metros.<br />
√ P.K. 36 a 44; Puerto <strong>de</strong> Itziar en cuyas rampas se llega a tener un radio inferior a 50 metros.<br />
√ P.K. 60 a 65; travesía <strong>de</strong> Eibar con radios inferiores a 80 metros.<br />
√ P.K. 12,5 a 16,5; tramo coinci<strong>de</strong>nte con <strong>la</strong>s pob<strong>la</strong>ciones <strong>de</strong> Zarautz y Orio con radios inferiores a 70<br />
metros.<br />
Carretera N-636: <strong>de</strong> Beasain a Durango por Kanpazar<br />
La carretera N-636 es una carretera <strong>de</strong> radios superiores a 250 metros en gran parte <strong>de</strong> <strong>la</strong> vía con <strong>la</strong>s<br />
siguientes excepciones:<br />
√ P.K. 15 a 18; coinci<strong>de</strong> con el Puerto <strong>de</strong> Deskarga en el que los radios son inferiores a 50 metros.<br />
√ P.K. 11 a 12; tramo don<strong>de</strong> los radios son <strong>de</strong> menos <strong>de</strong> 130 metros y coinci<strong>de</strong>n con <strong>la</strong> travesía <strong>de</strong><br />
Zumarraga.<br />
√ P.K. 21 a 22,5; <strong>la</strong> carretera N-636 a su paso por el municipio <strong>de</strong> Bergara, los radios son menores a<br />
130 metros.<br />
√ P.K. 35 a 39; en el Puerto <strong>de</strong> Kanpazar <strong>la</strong>s rampas <strong>de</strong> <strong>la</strong> carretera coinci<strong>de</strong>n con los tramos cuyo radio<br />
es inferior a 70 metros.<br />
√ Ya en el T.H. <strong>de</strong> Bizkaia, los radios tien<strong>de</strong>n a ser superiores (entre 150 y 350 metros) con tramos<br />
puntuales <strong>de</strong> radio menor que coinci<strong>de</strong>n con travesías en su recorrido (Abadiño y Durango).<br />
Carretera N-240: <strong>de</strong> Tarragona a Bilbao por el puerto <strong>de</strong> Barazar. Tramo Vitoria-Gasteiz -<br />
Galdakao<br />
La carretera N-240 tiene a lo <strong>la</strong>rgo <strong>de</strong> todo su trazado radios superiores a 250 metros a excepción <strong>de</strong> los<br />
tramos que a continuación se mencionan:<br />
√ P.K. 16 a 19; radios inferiores a 130 metros, en <strong>la</strong>s inmediaciones <strong>de</strong>l embalse <strong>de</strong> Urrunaga.<br />
√ P.K. 28 a 35; radios inferiores a 50 metros, en <strong>la</strong>s rampas <strong>de</strong>l puerto <strong>de</strong> Barazar.<br />
√ P.K. 35 a 55; radios inferiores a 130 metros, en <strong>la</strong> zona <strong>de</strong> <strong>de</strong>scenso <strong>de</strong>l puerto <strong>de</strong> Barazar.<br />
24<br />
Revisión <strong>de</strong>l Segundo P<strong>la</strong>n General <strong>de</strong> Carreteras <strong>de</strong>l País Vasco
Carretera N-622: <strong>de</strong> Vitoria-Gasteiz a Bilbao por <strong>la</strong> Autopista AP-68. Tramo Vitoria-Gasteiz –<br />
Altube AP-68<br />
Se trata <strong>de</strong> una vía <strong>de</strong> dos carriles por sentido <strong>de</strong> circu<strong>la</strong>ción que dispone <strong>de</strong> radios superiores a 300 metros<br />
en todo su trazado.<br />
Carretera N-102: <strong>de</strong> N-I a Vitoria-Gasteiz, dirección Francia. Tramo N-I en Ariñez – Vitoria-<br />
Gasteiz en Armentia<br />
Es <strong>la</strong> carretera <strong>de</strong> acceso a Vitoria-Gasteiz <strong>de</strong>s<strong>de</strong> el suroeste. Es una vía <strong>de</strong> doble calzada con radios<br />
superiores a 250 metros a excepción <strong>de</strong> dos glorietas sitas a <strong>la</strong> entrada <strong>de</strong> <strong>la</strong> capital a<strong>la</strong>vesa entre los P.K.<br />
347 y 349.<br />
Carretera N-104: <strong>de</strong> Vitoria-Gasteiz a N-I, dirección Francia. Tramo Vitoria-Gasteiz en Arana N-I<br />
en Venta <strong>de</strong> Patio<br />
Es otra <strong>de</strong> <strong>la</strong>s carreteras <strong>de</strong> acceso a Vitoria-Gasteiz pero <strong>de</strong>s<strong>de</strong> el este. En este caso los radios también son<br />
superiores a 250 metros menos en el tramo comprendido entre los P.K. 358 y 358,6 <strong>de</strong>bido, y tal y como<br />
ocurría en el caso anterior, a una sucesión <strong>de</strong> glorietas.<br />
Carretera N-124: <strong>de</strong> Vitoria-Gasteiz a Logroño por Haro. Tramo Armiñón N-I – Límite con La<br />
Rioja<br />
La carretera N-124 es una carretera que a lo <strong>la</strong>rgo <strong>de</strong> toda su longitud tiene un carril por sentido <strong>de</strong><br />
circu<strong>la</strong>ción. Los radios son buenos por no ser en ningún punto inferiores a 300 metros, no teniendo en<br />
cuenta el en<strong>la</strong>ce al comienzo <strong>de</strong> <strong>la</strong> vía.<br />
Carretera N-624: acceso al Aeropuerto <strong>de</strong> Foronda (Vitoria-Gasteiz)<br />
Vía <strong>de</strong> escasa longitud que da acceso al aeropuerto <strong>de</strong> Foronda en Vitoria-Gasteiz con radios superiores a<br />
300 m salvo <strong>la</strong> incorporación al circuito <strong>de</strong>l aeropuerto y <strong>la</strong> incorporación a <strong>la</strong> carretera N-62<strong>2.</strong><br />
Carretera N-121-A: <strong>de</strong> Pamplona a Behobia. Tramo Límite con Navarra - Behobia<br />
Vía <strong>de</strong> trazado irregu<strong>la</strong>r con radios que son superiores a 150 en <strong>la</strong> mayor parte <strong>de</strong> su longitud, pero que<br />
cuenta con tramos <strong>de</strong> radio inferiores a esa cifra e incluso inferiores a 80 metros en porcentajes <strong>de</strong> longitud<br />
significativos.<br />
Carretera N-638: acceso al Aeropuerto <strong>de</strong> Hondarribia (Donostia-San Sebastián)<br />
Se trata <strong>de</strong> una carretera <strong>de</strong> escasa longitud y <strong>de</strong> un carril por sentido <strong>de</strong> circu<strong>la</strong>ción. Los radios son<br />
superiores en toda <strong>la</strong> vía a 200 metros.<br />
Carretera N-629: <strong>de</strong> Burgos a Santoña. Término Municipal <strong>de</strong> Lanestosa<br />
Es <strong>la</strong> carretera sita más al oeste <strong>de</strong> toda <strong>la</strong> Red Objeto <strong>de</strong>l P<strong>la</strong>n y es una carretera que aunque tiene radios<br />
en torno a 200 metros, consta <strong>de</strong> curvas don<strong>de</strong> los radios <strong>de</strong> <strong>la</strong>s mimas no superan los 130 metros e incluso<br />
a su paso por <strong>la</strong> pob<strong>la</strong>ción <strong>de</strong> Lanestosa (entre los P.K. 62 y 63) los radios <strong>de</strong> curvatura son inferiores a 50<br />
metros.<br />
Carretera N-633: acceso al Aeropuerto <strong>de</strong> Bilbao<br />
Es <strong>la</strong> carretera que da acceso al Aeropuerto <strong>de</strong> Loiu en Bilbao. Los radios <strong>de</strong> <strong>la</strong> misma son superiores a 300<br />
metros, exceptuando el en<strong>la</strong>ce <strong>de</strong> entrada a <strong>la</strong> vía, y un tramo (entre los P.K. 14 y 15) en el circuito <strong>de</strong>l<br />
aeropuerto que tiene un radio <strong>de</strong> 100 metros.<br />
Carretera N-637: Cruces - Erletxe<br />
Vía <strong>de</strong> doble calzada con buenas características geométricas y radios superiores a 300 metros a excepción<br />
<strong>de</strong> los ramales <strong>de</strong> entrada y salida a <strong>la</strong> vía.<br />
Carretera N-639: acceso al puerto <strong>de</strong> Zierbana<br />
Carretera <strong>de</strong> poca longitud que da acceso por el oeste al puerto <strong>de</strong> Zierbana en Bilbao y que tiene radios<br />
superiores a 180 metros a lo <strong>la</strong>rgo <strong>de</strong> su trazado con <strong>la</strong>s siguientes dos excepciones:<br />
√ P.K. 21,4 a 20,3; coinci<strong>de</strong> con <strong>la</strong> travesía <strong>de</strong> Aldapa y los radios son inferiores a 100 metros.<br />
√ P.K. 18,8 a 19,5; es <strong>la</strong> travesía <strong>de</strong> El Puerto con radios <strong>de</strong> 130 metros.<br />
Carretera N-644: Autovía al puerto<br />
Como <strong>la</strong> carretera anterior, da acceso al Puerto <strong>de</strong> Zierbana en Bilbao por el este. Es una autovía <strong>de</strong> radios<br />
superiores a 300 metros, sin contar como es lógico los ramales <strong>de</strong> entrada y salida a <strong>la</strong> vía.<br />
<strong>2.</strong>1.<strong>2.</strong><strong>2.</strong> Red Básica<br />
Carretera A-132: Lumbier por Tafal<strong>la</strong> y Estel<strong>la</strong>. Tramo Elorriaga – Santa Cruz <strong>de</strong> Kanpezo<br />
La carretera A-132 mantiene <strong>de</strong> norte a sur radios superiores a 250 metros con excepción <strong>de</strong> los dos<br />
siguientes tramos:<br />
25<br />
Revisión <strong>de</strong>l Segundo P<strong>la</strong>n General <strong>de</strong> Carreteras <strong>de</strong>l País Vasco
√ P.K. 13 a 23; se <strong>de</strong>be a <strong>la</strong>s rampas existentes a su paso por el Puerto <strong>de</strong> Azatzeta.<br />
√ P.K.25 a 32; es una zona montañosa en <strong>la</strong>s inmediaciones <strong>de</strong> Arra<strong>la</strong> – Maestu que cuenta a<strong>de</strong>más <strong>de</strong><br />
varias travesías <strong>de</strong> corta longitud.<br />
Carretera A-624: <strong>de</strong> Altube a Balmaseda. Tramo N-622 – Límite con Burgos<br />
Se trata ésta <strong>de</strong> una carretera con trazado sinuoso y con radios no superiores a 250 metros en su práctica<br />
totalidad. Los tramos don<strong>de</strong> los radios <strong>de</strong> curvatura son inferiores a este valor son los siguientes:<br />
√ P.K. 22 a 28; se trata <strong>de</strong> un tramo <strong>de</strong> radios inferiores a 50 metros que coinci<strong>de</strong> con una zona<br />
montañosa en <strong>la</strong>s inmediaciones <strong>de</strong> <strong>la</strong> AP-68, a <strong>la</strong> altura <strong>de</strong> <strong>la</strong> localidad <strong>de</strong> Altube.<br />
√ P.K. 39 a 43; es un tramo que coinci<strong>de</strong> con <strong>la</strong> travesía <strong>de</strong> Amurrio en don<strong>de</strong> los radios son inferiores a<br />
50 metros.<br />
√ P.K. 56 a 58; tramo <strong>de</strong> radios inferiores a 50 metros coinci<strong>de</strong>nte con <strong>la</strong> travesía <strong>de</strong> Artziniega, y en<br />
zona montañosa entre Artziniega y Balmaseda.<br />
Carretera A-124: <strong>de</strong> Briñas a Logroño por Laguardia<br />
Es <strong>la</strong> carretera <strong>de</strong> <strong>la</strong> Red Objeto sita más al sur <strong>de</strong> toda <strong>la</strong> Comunidad Autónoma Vasca. Los radios son<br />
superiores a 250 metros en su mayor parte y aquellos tramos don<strong>de</strong> el radio <strong>de</strong> curvatura es inferior a este<br />
valor son los siguientes:<br />
√ P.K. 40 a 43; radios inferiores a 50 metros en tramo coinci<strong>de</strong>nte con <strong>la</strong> travesía <strong>de</strong> Labastida y <strong>la</strong> zona<br />
montañosa adyacente.<br />
√ P.K. 54 a 55; tramo <strong>de</strong> radios inferiores a 130 metros que coinci<strong>de</strong> con <strong>la</strong> travesía <strong>de</strong> Samaniego.<br />
√ P.K. 63 a 65; radios inferiores a 130 metros en un tramo coinci<strong>de</strong>nte con <strong>la</strong> travesía <strong>de</strong> Laguardia.<br />
Carretera A-627: <strong>de</strong> Vitoria-Gasteiz a Eibar (Maltzaga). Tramo Límite con Á<strong>la</strong>va – Eibar<br />
(Maltzaga)<br />
Se trata <strong>de</strong> una pequeña carretera que conecta con el Territorio Histórico <strong>de</strong> Gipuzkoa y en <strong>la</strong> que los radios<br />
son en <strong>la</strong> práctica totalidad <strong>de</strong> <strong>la</strong> carretera superiores a 250 metros. Aquellos tramos don<strong>de</strong> esto no ocurre<br />
son:<br />
√ P.K. 12 a 12,6; <strong>de</strong>bido a <strong>la</strong> existencia <strong>de</strong> glorietas <strong>la</strong> carretera cuenta con radios inferiores a 50<br />
metros.<br />
√ P.K. 16 a 17; los radios son inferiores a 130 metros por <strong>la</strong> presencia <strong>de</strong> <strong>la</strong>s primeras rampas <strong>de</strong>l<br />
puerto <strong>de</strong> Ar<strong>la</strong>bán.<br />
Carretera A-625: <strong>de</strong> Orduña a Bilbao. Tramo Límite con Á<strong>la</strong>va – Límite con Bizkaia<br />
Los radios <strong>de</strong> los que dispone esta carretera son superiores a 250 metros en su práctica totalidad, con<br />
excepción <strong>de</strong> los siguientes tramos puntuales:<br />
√ P.K. 364,2 a 365,4; en <strong>la</strong> travesía <strong>de</strong> Luiando los radios son inferiores a 50 metros.<br />
√ P.K. 375,2 a 376,8; en <strong>la</strong> travesía <strong>de</strong> Arrankudiaga los radios son inferiores a 130 metros.<br />
Carretera A-623: Vitoria-Gasteiz – Durango. Tramo Legutiano (N-240) – Límite con Bizkaia<br />
La carretera A-626 que arranca <strong>de</strong> <strong>la</strong> N-240 y se dirige hacia el Territorio Histórico <strong>de</strong> Bizkaia, cuenta con<br />
radios <strong>de</strong> curvatura en p<strong>la</strong>nta superiores a 250 metros, salvo entre los P.K. 16 y 19, don<strong>de</strong> los radios son<br />
inferiores a 50 metros. Este tramo es adyacente al Embalse <strong>de</strong> Urrunaga.<br />
Carretera BI-623: Vitoria-Gasteiz – Durango. Tramo Límite con Á<strong>la</strong>va - Durango<br />
Se trata <strong>de</strong> <strong>la</strong> continuación <strong>de</strong> <strong>la</strong> carretera A-623 y al igual que en el caso anterior los radios son superiores<br />
a 250 metros. Don<strong>de</strong> esto no ocurre es entre los P.K 34 y 40, entre <strong>la</strong>s localida<strong>de</strong>s <strong>de</strong> Mañaria y Urkio<strong>la</strong><br />
<strong>de</strong>bido a <strong>la</strong> presencia <strong>de</strong>l Puerto <strong>de</strong> Urkio<strong>la</strong>.<br />
Carretera GI-131: <strong>de</strong> Andoain a Donostia-San Sebastián por Hernani<br />
La carretera GI-131 presenta un trazado muy sinuoso, con radios <strong>de</strong> curvatura que superan escasamente<br />
los 130 metros en su práctica totalidad. Los tramos que a continuación se presentan tienen radios <strong>de</strong><br />
curvatura inferiores a este valor:<br />
√ P.K. 1,5 a 4; radios inferiores a los 50 metros en un tramo coinci<strong>de</strong>nte con <strong>la</strong> travesía <strong>de</strong> Andoain.<br />
√ P.K. 5,5 a 6; radios inferiores a los 50 metros en tramo coinci<strong>de</strong>nte con <strong>la</strong> travesía <strong>de</strong> Urnieta.<br />
√ P.K. 8 a 8,5; radios inferiores a los 50 metros en tramo semiurbano en <strong>la</strong>s inmediaciones <strong>de</strong> <strong>la</strong><br />
localidad <strong>de</strong> Hernani.<br />
√ P.K 14 y sucesivos; radios inferiores a 50 metros, en tramo coinci<strong>de</strong>nte con <strong>la</strong> entrada a <strong>la</strong> ciudad <strong>de</strong><br />
Donostia-San Sebastián.<br />
Carretera GI-627: <strong>de</strong> Vitoria-Gasteiz a Eibar (Maltzaga). Tramo Límite con Á<strong>la</strong>va – Eibar<br />
(Maltzaga)<br />
Vía <strong>de</strong> trazado sinuoso con radios <strong>de</strong> curvatura que superan los 130 metros en su mayor parte, pero con<br />
frecuencia <strong>de</strong> tramos con sucesión <strong>de</strong> curvas <strong>de</strong> radio inferior en los P.K. siguientes:<br />
26<br />
Revisión <strong>de</strong>l Segundo P<strong>la</strong>n General <strong>de</strong> Carreteras <strong>de</strong>l País Vasco
√ P.K. 18 a 30; radios inferiores a 50 metros en un tramo que coinci<strong>de</strong> con <strong>la</strong> presencia sucesiva <strong>de</strong> los<br />
Puertos <strong>de</strong> Ar<strong>la</strong>bán y Salinas.<br />
√ P.K. 35 a 43; radios inferiores a 50 metros en tramo <strong>de</strong> trazado paralelo al río Deba entre <strong>la</strong>s<br />
localida<strong>de</strong>s <strong>de</strong> Mondragón y Bergara.<br />
√ P.K. 51 a 53; radios inferiores a 50 metros en tramo <strong>de</strong> trazado paralelo también al río Deba en <strong>la</strong>s<br />
inmediaciones <strong>de</strong> <strong>la</strong> localidad <strong>de</strong> Maltzaga.<br />
Carretera GI-631: <strong>de</strong> Zumaia a Zumarraga<br />
El trazado <strong>de</strong> <strong>la</strong> GI-631 es sinuoso y en continuo ascenso <strong>de</strong>s<strong>de</strong> el nivel <strong>de</strong>l mar en Zumaia. De forma<br />
genérica <strong>la</strong> vía supera los radios <strong>de</strong> 130 metros escasamente, con excepción <strong>de</strong> los tramos que a<br />
continuación se citan:<br />
√ P.K. 0 a 8; radios inferiores a 50 metros en <strong>la</strong> zona montañosa localizada entre <strong>la</strong>s localida<strong>de</strong>s <strong>de</strong><br />
Zumaia y Zestoa.<br />
√ P.K 13 a 16; radios inferiores a 50 metros en el tramo coinci<strong>de</strong>nte con <strong>la</strong> travesía <strong>de</strong> Azpeitia y en el<br />
tramo semi-urbano localizado entre esta localidad y el Monasterio <strong>de</strong> Loyo<strong>la</strong>.<br />
√ P.K. 19 a 34; radios inferiores a 50 metros en zona montañosa con trazado paralelo al río Uro<strong>la</strong> y<br />
presencia <strong>de</strong> <strong>la</strong> travesía <strong>de</strong> Azkoitia y otras <strong>de</strong> menor entidad.<br />
Carretera GI-638: <strong>de</strong> Deba a Ondarroa. Tramo Deba – Límite con Bizkaia<br />
Se trata <strong>de</strong> una pequeña carretera <strong>de</strong> trazado sinuoso y paralelo a <strong>la</strong> costa entre Deba y Ondarroa. La<br />
mayoría <strong>de</strong> sus radios <strong>de</strong> curvatura se sitúan por encima <strong>de</strong> los 250 metros, aunque existan zonas don<strong>de</strong> los<br />
radios son menores:<br />
√ P.K 0 a 1; radios inferiores a 130 metros en <strong>la</strong>s inmediaciones <strong>de</strong> <strong>la</strong> localidad <strong>de</strong> Deba.<br />
√ P.K. 2,5 a 5,5; radios inferiores a 50 metros. Es un trazado muy próximo a <strong>la</strong> costa y que coinci<strong>de</strong> con<br />
<strong>la</strong> travesía <strong>de</strong> Mutriku.<br />
Carretera BI-638: <strong>de</strong> Deba a Ondarroa. Tramo Límite con Gipuzkoa - Ondarroa<br />
Carretera <strong>de</strong> escasa longitud (1 kilómetro) entre Ondarroa y el límite <strong>de</strong>l Territorio Histórico <strong>de</strong> Gipuzkoa. La<br />
mayoría <strong>de</strong> sus radios son no mayores a 250 metros con alguna curva <strong>de</strong> radio inferior localizada en <strong>la</strong><br />
entrada <strong>de</strong> Ondarroa.<br />
Carretera BI-604: Bilbao a Asua por Enekuri. Tramo variante Baja <strong>de</strong> Deusto – La Ca<strong>de</strong>na<br />
Es esta una carretera que se encuentra en Bilbao Metropolitano y cuyos radios son superiores a los 350<br />
metros excepto en sus kilómetros iniciales y finales en los que cuenta con radios inferiores a los 50 metros.<br />
Estos tramos coinci<strong>de</strong>n con <strong>la</strong>s travesías <strong>de</strong> Deusto y Asua.<br />
Carretera BI-624: <strong>de</strong> Altube a Balmaseda. Tramo Límite con Burgos - Balmaseda<br />
Vía <strong>de</strong> escasa longitud (3 kilómetros) que se localiza entre <strong>la</strong>s localida<strong>de</strong>s <strong>de</strong> Altube y Balmaseda. Cuenta<br />
con <strong>la</strong> presencia frecuente <strong>de</strong> curvas <strong>de</strong> radios inferiores a 130 metros en su práctica totalidad.<br />
Carretera BI-625: <strong>de</strong> Orduña a Bilbao<br />
La carretera BI-625 está en el entorno <strong>de</strong> Bilbao y cuenta con dos tramos:<br />
√ Tramo BI-604 – N-634<br />
El localizado más al oeste une <strong>la</strong> carretera BI-604 con <strong>la</strong> N-634. Este tramo, <strong>de</strong> apenas 5 kilómetros,<br />
cuenta en casi toda su longitud con radios <strong>de</strong> curvatura bastante amplios por lo general, superando<br />
en prácticamente todo su recorrido los 150 metros, a excepción <strong>de</strong> los en<strong>la</strong>ces con <strong>la</strong>s dos carreteras<br />
citadas.<br />
√ Tramo Límite con Á<strong>la</strong>va – cruce con N-634<br />
El otro tramo, que une <strong>la</strong> carretera N-634 con el límite <strong>de</strong>l Territorio Histórico <strong>de</strong> Á<strong>la</strong>va, se mantiene<br />
por lo general por encima <strong>de</strong> los 250 metros <strong>de</strong> radio <strong>de</strong> curvatura, con excepción <strong>de</strong> los tramos<br />
coinci<strong>de</strong>ntes con <strong>la</strong>s travesías <strong>de</strong> Arrigorriaga, Aguirre y Ugao-Miraballes, entre otras, en que los<br />
radios <strong>de</strong>scien<strong>de</strong>n por <strong>de</strong>bajo <strong>de</strong> los 130 metros.<br />
Carretera BI-630: <strong>de</strong> Balmaseda a Carranza. Tramo Balmaseda – Límite con Cantabria<br />
Es <strong>la</strong> carretera <strong>de</strong> <strong>la</strong> Red Básica sita más al oeste <strong>de</strong> toda <strong>la</strong> Comunidad Autónoma <strong>de</strong>l País Vasco. Su<br />
trazado es sinuoso con curvas cuyos radios son inferiores a los 130 metros y en algunos casos llegan a ser<br />
incluso inferiores a los 50 metros.<br />
Carretera BI-631: <strong>de</strong> Bilbao a Bermeo. Tramo N-633 - Bermeo<br />
Es una vía que comunica el Área Metropolitana <strong>de</strong> Bilbao con <strong>la</strong> localidad costera <strong>de</strong> Bermeo al norte. Es una<br />
carretera <strong>de</strong> doble calzada hasta <strong>la</strong> localidad <strong>de</strong> Mungia y cuenta hasta este punto con radios superiores a<br />
350 metros. A partir <strong>de</strong> <strong>la</strong> variante <strong>de</strong> Mungia (P.K 19) y hasta Bermeo, el trazado se vuelve sinuoso siendo<br />
frecuente <strong>la</strong> presencia <strong>de</strong> curvas <strong>de</strong> radio inferior a 50 metros.<br />
27<br />
Revisión <strong>de</strong>l Segundo P<strong>la</strong>n General <strong>de</strong> Carreteras <strong>de</strong>l País Vasco
Carretera BI-633: <strong>de</strong> Durango a Ondarroa por Trabakua. Tramo Matiena - Ondarroa<br />
La BI-633 cuenta con radios superiores a los 250 metros excepto en el tramo localizado entre los P.K. 40 y<br />
50. En dicho tramo, el trazado es sinuoso en zona montañosa, con presencia <strong>de</strong> curvas <strong>de</strong> radio inferior a 50<br />
metros, y coincidiendo en parte con <strong>la</strong>s travesías <strong>de</strong> Markina, Berriatua y Ondarroa.<br />
Carretera BI-635: <strong>de</strong> Lemoa a Gernika-Lumo<br />
Esta carretera se encuentra c<strong>la</strong>ramente dividida en dos tramos. El primero <strong>de</strong> ellos presenta un trazado<br />
irregu<strong>la</strong>r con radios inferiores a 130 metros entre los P.K. 17 y 29 (se hace especialmente sinuoso en <strong>la</strong><br />
travesía <strong>de</strong> Amorebieta entre el P.K. 20 y el 23 don<strong>de</strong> los radios llegan a ser inferiores a 70 metros y ente los<br />
P.K. 23 y 29 siendo ésta una zona montañosa con rampas <strong>de</strong> radios inferiores a 100 m). A partir <strong>de</strong> este<br />
punto y hasta el kilómetro 35, <strong>la</strong> vía tiene radios superiores a los 250 metros.<br />
Carretera BI-636: <strong>de</strong> Bilbao a Reinosa. Tramo Bilbao – Límite con Burgos<br />
De Bilbao a Balmaseda esta carretera convencional <strong>de</strong> radios irregu<strong>la</strong>res <strong>de</strong> más 170 metros en <strong>la</strong> mayor<br />
parte <strong>de</strong> <strong>la</strong> vía, contiene no obstante <strong>la</strong>s siguientes excepciones:<br />
√ P.K. 10 a 12; radios inferiores a 130 metros coinci<strong>de</strong>ntes con <strong>la</strong> travesía <strong>de</strong> Zaramillo.<br />
√ P.K. 14,5 a 15,5; radios inferiores a 100 metros en <strong>la</strong>s inmediaciones <strong>de</strong> Sodupe.<br />
Carretera BI-637: <strong>de</strong> Artaza a Sope<strong>la</strong>na<br />
Carretera semi-urbana que nace en Bilbao y se dirige a <strong>la</strong> costa y que recorre <strong>la</strong>s inmediaciones <strong>de</strong> Leioa,<br />
Algorta, Erandio y Artatza. Dispone <strong>de</strong> dos carriles por sentido <strong>de</strong> circu<strong>la</strong>ción y radios superiores a 300<br />
metros exceptuando los en<strong>la</strong>ces <strong>de</strong> inicio y final <strong>de</strong> <strong>la</strong> vía y una excepcional glorieta en sentido ascen<strong>de</strong>nte<br />
en el P.K. 13,4 <strong>de</strong> radio inferior a 130 m.<br />
Finalmente, en <strong>la</strong> siguiente tab<strong>la</strong> se han presentado los aspectos más importantes <strong>de</strong> <strong>la</strong> geometría <strong>de</strong> <strong>la</strong><br />
carretera, tanto en p<strong>la</strong>nta (radios <strong>de</strong> curvatura y longitu<strong>de</strong>s <strong>de</strong> transición), como en alzado (pendientes<br />
máximas y peraltes máximos), así como <strong>la</strong>s velocida<strong>de</strong>s medias en régimen <strong>de</strong> circu<strong>la</strong>ción libre (<strong>de</strong> ligeros y<br />
pesados) para cada una <strong>de</strong> <strong>la</strong>s carreteras <strong>de</strong> <strong>la</strong> Red Objeto y que se han <strong>de</strong>ducido <strong>de</strong>l <strong>análisis</strong> anterior:<br />
28<br />
Revisión <strong>de</strong>l Segundo P<strong>la</strong>n General <strong>de</strong> Carreteras <strong>de</strong>l País Vasco
Carretera<br />
Red <strong>de</strong> Interés Preferente<br />
CARACTERÍSTICAS GEOMÉTRICAS Y VELOCIDADES MEDIAS, SEGÚN CARRETERA Y TIPO DE RED<br />
Trazado en p<strong>la</strong>nta Trazado en alzado Velocidad en régimen libre<br />
Radio <strong>de</strong><br />
curvatura<br />
mínimo (m)<br />
Longitud <strong>de</strong><br />
transición<br />
(%)<br />
Pendiente<br />
máxima<br />
(%)<br />
Peralte<br />
máximo<br />
Velocidad<br />
ligeros<br />
(km/h)<br />
Velocidad<br />
pesados<br />
(km/h)<br />
AP-68 300 67 6 > 8 120 73,9<br />
A-8 (límite provincia <strong>de</strong><br />
Cantabria – Donostia-San<br />
Sebastián - ascen<strong>de</strong>nte)<br />
A-8 (límite provincia <strong>de</strong><br />
Cantabria – Donostia-San<br />
Sebastián – <strong>de</strong>scen<strong>de</strong>nte)<br />
A-8 (Donostia-San<br />
Sebastián – frontera<br />
francesa)<br />
200 66 > 8 > 8 114,1 71<br />
300 70 > 8 > 8 113,5 71,8<br />
230 77 6 > 8 115,7 71,4<br />
A-15 (ascen<strong>de</strong>nte) 350 61 > 8 > 8 106,8 62,4<br />
A-15 (<strong>de</strong>scen<strong>de</strong>nte) 350 63 > 8 > 8 109,8 45,8<br />
A-1 175 (peaje) 41 > 8 > 8 120 69,5<br />
N-I 300 (en<strong>la</strong>ce) 44 6 > 8 102,1 71,5<br />
N-I (Á<strong>la</strong>va - ascen<strong>de</strong>nte) 350 29 6 > 8 120 78,4<br />
N-I (Á<strong>la</strong>va - <strong>de</strong>scen<strong>de</strong>nte) 350 26 5 > 8 120 79,4<br />
N-I (Límite provincia <strong>de</strong><br />
Navarra – Donostia-San<br />
Sebastián - ascen<strong>de</strong>nte)<br />
N-I (Límite provincia <strong>de</strong><br />
Navarra – Donostia-San<br />
Sebastián - <strong>de</strong>scen<strong>de</strong>nte)<br />
N-I (Variante <strong>de</strong> Donostia-<br />
San Sebastián –<br />
ascen<strong>de</strong>nte)<br />
N-I (Variante <strong>de</strong> Donostia-<br />
San Sebastián –<br />
<strong>de</strong>scen<strong>de</strong>nte)<br />
N-I (Donostia-San<br />
Sebastián – frontera<br />
francesa – ascen<strong>de</strong>nte)<br />
N-I (Donostia-San<br />
Sebastián – frontera<br />
francesa – <strong>de</strong>scen<strong>de</strong>nte)<br />
100 61 7 > 8 100,6 74,4<br />
100 67 > 8 > 8 106,9 64,7<br />
350 67 > 8 > 8 98,4 73,6<br />
80 80 7 > 8 103,4 68<br />
80 58 > 8 > 8 92,6 73,4<br />
80 58 > 8 > 8 95,5 73,6<br />
N-102 50 (glorieta) 35 4 > 8 95,8 75,4<br />
Carretera<br />
Trazado en p<strong>la</strong>nta Trazado en alzado Velocidad en régimen libre<br />
Radio <strong>de</strong><br />
curvatura<br />
mínimo (m)<br />
Longitud <strong>de</strong><br />
transición<br />
(%)<br />
Pendiente<br />
máxima<br />
(%)<br />
Peralte<br />
máximo<br />
Velocidad<br />
ligeros<br />
(km/h)<br />
29<br />
Velocidad<br />
pesados<br />
(km/h)<br />
N-104 117 20 5 > 8 100 78,4<br />
N-121-A < 50 (glorieta) 66 > 8 > 8 84,5 76,4<br />
N-124 175 40 6,5 > 8 100 78,1<br />
N-240 < 50 43 > 8 > 8 90,4 74<br />
N-622 88 33 > 8 > 8 120 74,2<br />
N-624 < 50 58 5 > 8 95 77,5<br />
N-629 < 50 68 > 8 > 8 83,1 72,2<br />
N-633 (acceso al<br />
aeropuerto <strong>de</strong> Loiu)<br />
80 77 > 8 > 8 88,4 77,3<br />
N-633 (BI-631 – N-637) 60 80 > 8 > 8 104,3 77,9<br />
N-634 (límite provincia <strong>de</strong><br />
Cantabria – Bilbao)<br />
N-634 (Bilbao – límite<br />
T.H. Gipuzkoa)<br />
N-634 (límite T.H.<br />
Gipuzkoa – Donostia-San<br />
Sebastián)<br />
< 50 64 > 8 > 8 85,1 66,2<br />
50 (glorieta) 54 > 8 > 8 89,5 73,5<br />
< 50 71 > 8 > 8 78,4 70,2<br />
N-636 (Cor<strong>red</strong>or BI-632) < 50 60 > 8 > 8 90,5 72,9<br />
N-636 (límite T.H. Bizkaia<br />
– GI-627)<br />
350 62 > 8 > 8 96,9 74,2<br />
N-636 (GI-627 – A-1) < 50 71 > 8 > 8 83,1 64,2<br />
N-637 (Bilbao – BI-604) 110 67 > 8 > 8 94,1 67,8<br />
N-637 (BI-604 – BI-631) 350 71 8 > 8 120 75,1<br />
N-637 (BI-631 – N-634) 175 72 8 > 8 115,4 73,4<br />
N-638 < 50 (glorieta) 52 > 8 > 8 98,5 78<br />
N-639 < 50 77 >8 > 8 86,1 72,4<br />
N-644 < 50 74 > 8 > 8 77 55,5<br />
Revisión <strong>de</strong>l Segundo P<strong>la</strong>n General <strong>de</strong> Carreteras <strong>de</strong>l País Vasco
CARACTERÍSTICAS GEOMÉTRICAS Y VELOCIDADES MEDIAS, SEGÚN CARRETERA Y TIPO DE<br />
RED<br />
Trazado en p<strong>la</strong>nta Trazado en alzado Velocidad en régimen libre<br />
Red Básica<br />
Carretera<br />
Radio <strong>de</strong><br />
curvatura<br />
mínimo (m)<br />
Longitud <strong>de</strong><br />
transición<br />
(%)<br />
Pendiente<br />
máxima<br />
(%)<br />
Peralte<br />
máximo<br />
Velocidad<br />
ligeros<br />
(km/h)<br />
Velocidad<br />
pesados<br />
(km/h)<br />
A-124 (Labastida) 70 53 > 8 > 8 91,2 55,5<br />
A-124 (Logroño – Ábalos) 100 44 > 8 > 8 100 71,2<br />
A-132 80 42 > 8 > 8 97,8 65,4<br />
A-623 < 50 69 7 > 8 84,9 78<br />
A-624 < 50 65 > 8 > 8 88,4 51<br />
A-625 (AP-68 - Amurrio) 300 65 7 > 8 100 70,1<br />
A-625 (Amurrio - A-624) 110 67 > 8 > 8 100 70,9<br />
A-625 (A-624 - límite T.H.<br />
Bizkaia)<br />
90 69 > 8 > 8 100 71,7<br />
A-627 < 50 51 > 8 > 8 100 74,8<br />
BI-604 120 75 > 8 > 8 84,9 60,4<br />
BI-623 < 50 60 > 8 > 8 86,5 51,9<br />
BI-624 < 50 91 > 8 > 8 75,7 45,5<br />
BI-625 (BI-604 – N-634) 180 53 > 8 > 8 87,9 65,4<br />
BI-625 (N-634 – límite<br />
T.H. Á<strong>la</strong>va)<br />
100 69 > 8 > 8 89,3 72,1<br />
BI-630 < 50 77 > 8 > 8 71,9 61,2<br />
BI-631 (N-633 – Bermeo) < 50 63 > 8 > 8 79,2 54<br />
BI-631 (N-633 – N-634) 70 87 > 8 > 8 82 378<br />
BI-633 < 50 70 > 8 > 8 89,8 61<br />
BI-635 < 50 71 > 8 > 8 100 63,9<br />
BI-636 < 50 67 > 8 > 8 98,4 73,6<br />
BI-637 (Berango – Areta) 60 67 > 8 > 8 94,3 70,9<br />
BI-637 (Areta – N-637) 120 38 7 > 8 97,5 77,2<br />
BI-638 < 5 93 > 8 > 8 67 60,9<br />
GI-131 < 50 (glorieta) 61 > 8 > 8 85,3 72,9<br />
GI-627 < 50 78 > 8 > 8 81,2 71,2<br />
GI-631 (ascen<strong>de</strong>nte) < 50 (glorieta) 74 > 8 > 8 75,1 72,3<br />
GI-631 (<strong>de</strong>scen<strong>de</strong>nte) < 50 (glorieta) 68 > 8 > 8 76,1 76<br />
GI-638 < 50 76 > 8 > 8 74,1 70,1<br />
Fuente: Inventarios Diputaciones y e<strong>la</strong>boración propia.<br />
30<br />
Revisión <strong>de</strong>l Segundo P<strong>la</strong>n General <strong>de</strong> Carreteras <strong>de</strong>l País Vasco
<strong>2.</strong>1.<strong>2.</strong>3. Velocida<strong>de</strong>s específicas<br />
A continuación se presenta una tab<strong>la</strong> que recoge <strong>la</strong>s velocida<strong>de</strong>s específicas <strong>de</strong> <strong>la</strong>s carreteras <strong>de</strong> <strong>la</strong> Red<br />
Básica, según porcentajes <strong>de</strong> longitud con respecto al total que se sitúen en los rangos: <strong>de</strong> 0 a 40 km/h, <strong>de</strong><br />
40 a 60 km/h, <strong>de</strong> 60 a 80 km/h, <strong>de</strong> 80 a 100 km/h, y más <strong>de</strong> 100 km/h. El resultado es el siguiente:<br />
Carretera v e < 40 km/h<br />
40 km/h < v e <<br />
60 km/h<br />
60 km/h < v e <<br />
80 km/h<br />
VELOCIDADES ESPECÍFICAS SEGÚN CARRETERA Y TIPO DE RED<br />
80 km/h < v e<br />
< 100 km/h<br />
v e > 100 km/h<br />
Red <strong>de</strong> Interés Preferente<br />
AP-1 0,00 0,00 0,00 0,00 100,00<br />
AP-68 0,00 0,00 0,00 0,38 99,62<br />
A-1 0,00 0,00 0,00 0,00 100,00<br />
A-8 0,00 0,00 0,00 0,00 100,00<br />
A-15 0,00 0,00 0,00 0,00 100,00<br />
N-I 0,00 0,67 5,49 4,97 88,88<br />
N-102 0,00 0,00 0,00 3,57 96,43<br />
N-104 0,00 0,00 0,00 3,09 96,91<br />
N-121-A 0,00 2,83 21,22 27,86 48,09<br />
N-124 0,00 0,00 0,00 2,24 97,76<br />
N-240 0,00 12,23 17,95 34,71 35,11<br />
N-622 0,00 0,00 0,00 2,07 97,93<br />
N-624 0,00 5,00 12,50 7,50 75,00<br />
N-629 0,00 12,50 7,50 55,00 25,00<br />
N-633 0,00 0,00 15,03 8,01 76,96<br />
N-634 0,38 8,63 32,66 28,52 29,81<br />
N-636 0,75 12,31 10,30 23,85 52,78<br />
N-637 0,00 0,00 6,43 3,24 90,33<br />
N-638 0,00 2,17 6,52 20,87 70,43<br />
N-639 0,00 13,37 11,30 36,45 38,88<br />
N-644 0,00 5,71 40,00 5,71 48,57<br />
(% LONGITUD)<br />
Carretera v e < 40 km/h<br />
40 km/h < v e <<br />
60 km/h<br />
60 km/h < v e <<br />
80 km/h<br />
80 km/h < v e<br />
< 100 km/h<br />
v e > 100 km/h<br />
Red Básica<br />
A-124 0,00 1,80 2,52 8,65 87,03<br />
A-132 0,00 0,00 6,38 18,90 74,72<br />
A-623 0,00 5,64 18,80 44,36 31,20<br />
A-624 1,04 20,82 1,82 16,92 59,40<br />
A-625 0,00 0,00 2,63 12,11 85,26<br />
A-627 0,00 3,60 12,59 26,08 57,73<br />
BI-604 0,00 7,85 21,60 11,64 58,90<br />
BI-623 7,15 5,72 10,73 28,95 47,45<br />
BI-624 0,00 12,03 39,86 48,11 0,00<br />
BI-625 0,00 0,00 10,10 55,56 34,34<br />
BI-630 0,00 24,32 47,96 17,61 10,12<br />
BI-631 0,00 10,69 32,41 19,82 37,09<br />
BI-633 0,00 2,48 7,09 47,20 43,23<br />
BI-635 0,00 5,05 25,81 35,35 33,78<br />
BI-636 0,00 0,00 6,84 19,23 73,93<br />
BI-637 0,00 3,77 1,99 24,83 69,41<br />
BI-638 0,00 0,00 100,00 0,00 0,00<br />
GI-131 0,00 12,29 15,56 16,98 55,17<br />
GI-627 0,00 20,18 15,72 30,29 33,81<br />
GI-631 0,58 7,87 47,52 22,16 21,87<br />
GI-638 0,00 14,23 43,73 22,64 19,40<br />
Fuente: E<strong>la</strong>boración propia.<br />
31<br />
Revisión <strong>de</strong>l Segundo P<strong>la</strong>n General <strong>de</strong> Carreteras <strong>de</strong>l País Vasco
Con respecto a <strong>la</strong> Red <strong>de</strong> Interés Preferente, <strong>de</strong>staca que todas <strong>la</strong>s autopistas y autovías cuentan con porcentajes<br />
cercanos al 100% en que <strong>la</strong> velocidad específica supera los 100 km/h. En el <strong>la</strong>do contrario, sólo dos carreteras <strong>de</strong><br />
esta <strong>red</strong> cuentan con algún tramo en que <strong>la</strong> velocidad se sitúe por <strong>de</strong>bajo <strong>de</strong> los 40 km/h. Estas carreteras son <strong>la</strong><br />
N-634 y <strong>la</strong> N-636, en menos <strong>de</strong>l 1% <strong>de</strong> su recorrido.<br />
Entre 40 y 60 km/h se sitúa mayor número <strong>de</strong> carreteras. De el<strong>la</strong>s, <strong>la</strong> N-240, <strong>la</strong> N-629, <strong>la</strong> N-636 y <strong>la</strong> N-639<br />
cuentan con más <strong>de</strong>l 10% <strong>de</strong> su longitud en este rango.<br />
Por su parte, con excepción <strong>de</strong> <strong>la</strong>s autopistas y autovías, el resto <strong>de</strong> carreteras <strong>de</strong> <strong>la</strong> Red <strong>de</strong> Interés Preferente<br />
cuentan con tramos en el rango <strong>de</strong> 60 a 80 km/h, <strong>de</strong>stacando <strong>la</strong> N-121-A, con un 21,22% <strong>de</strong> longitud en este<br />
rango, <strong>la</strong> N-240, 17,95%, <strong>la</strong> N-634, 32,66%, y <strong>la</strong> N-644, 40%.<br />
Finalmente, sólo 6 carreteras <strong>de</strong> <strong>la</strong> Red <strong>de</strong> Interés Preferente tienen menos <strong>de</strong>l 50% <strong>de</strong> su longitud en el rango <strong>de</strong><br />
más <strong>de</strong> 100 km/h. Estas carreteras son <strong>la</strong> N-121-A (48,09%), <strong>la</strong> N-240 (35,11%), <strong>la</strong> N-629 (25%), <strong>la</strong> N-634<br />
(29,8%), <strong>la</strong> N-639 (38,88%) y <strong>la</strong> N-644 (48,57%).<br />
En lo que se refiere a <strong>la</strong> Red Básica, tres carreteras cuentan con tramos en que <strong>la</strong> velocidad específica es menor<br />
<strong>de</strong> 40 km/h. Estas carreteras son <strong>la</strong> A-624, con un 1,04%, <strong>la</strong> GI-631, con un 0,58%, y <strong>la</strong> BI-623, que cuenta con<br />
un 7,15% <strong>de</strong> su longitud en este rango.<br />
En el rango <strong>de</strong> 40 a 60 km/h hay un total <strong>de</strong> 13 carreteras que tienen tramos <strong>de</strong>ntro <strong>de</strong>l mismo. De el<strong>la</strong>s superan<br />
el 10% <strong>de</strong> su longitud <strong>la</strong>s carreteras A-624 (20,82%), BI-624 (12,03%), BI-630 (24,32%), BI-631 (10,69%), GI-<br />
131 (12,29%), GI-627 (20,18%) y GI-638 (14,23%).<br />
Una mayoría <strong>de</strong> carreteras <strong>de</strong> <strong>la</strong> Red Básica tienen menos <strong>de</strong>l 50% <strong>de</strong> su longitud con una velocidad específica<br />
por <strong>de</strong>bajo <strong>de</strong> los 100 km/h. Entre el<strong>la</strong>s cabe citar <strong>la</strong> BI-624 y <strong>la</strong> BI-638, que no cuentan con tramo alguno es este<br />
rango, <strong>la</strong> BI-630, que sólo alcanza el 10%, <strong>la</strong> GI-638, el 19%, y <strong>la</strong> GI-631, el 22%.<br />
En resumen, <strong>la</strong>s carreteras <strong>de</strong> <strong>la</strong> Red <strong>de</strong> Interés Preferente más <strong>de</strong>ficiente <strong>de</strong>s<strong>de</strong> el punto <strong>de</strong> contar con menores<br />
velocida<strong>de</strong>s específicas son <strong>la</strong> N-634, N-629, N-240, N-644, N-639, N-636 y N-121-A. En cuanto a <strong>la</strong> Red Básica,<br />
<strong>la</strong>s más <strong>de</strong>ficientes son <strong>la</strong> BI-638, BI-630, BI-624, GI-638, GI-631, GI-627, BI-631 y BI-635.<br />
En el gráfico siguiente se representan <strong>la</strong>s velocida<strong>de</strong>s específicas <strong>de</strong> <strong>la</strong>s carreteras <strong>de</strong> <strong>la</strong> Red Objeto <strong>de</strong>l P<strong>la</strong>n.<br />
32<br />
Revisión <strong>de</strong>l Segundo P<strong>la</strong>n General <strong>de</strong> Carreteras <strong>de</strong>l País Vasco
<strong>2.</strong>1.<strong>2.</strong>4. Caídas <strong>de</strong> Velocidad<br />
La pérdida <strong>de</strong> velocidad <strong>de</strong>l vehículo pesado tipo se obtiene <strong>de</strong> acuerdo con <strong>la</strong> Instrucción <strong>de</strong> Carreteras 3.1-IC<br />
Apartado 7.4.3. El indicador <strong>de</strong> caídas <strong>de</strong> velocidad <strong>de</strong>termina los tramos <strong>de</strong> <strong>la</strong> Red Objeto en los cuales se<br />
produce una pérdida consi<strong>de</strong>rable <strong>de</strong> <strong>la</strong> velocidad <strong>de</strong>bido a <strong>la</strong> circu<strong>la</strong>ción <strong>de</strong> vehículos pesados y permite apreciar<br />
<strong>la</strong> necesidad <strong>de</strong> incorporar carriles auxiliares.<br />
En concreto se consi<strong>de</strong>ran tramos con caída <strong>de</strong> velocidad a aquellos tramos en los cuales <strong>la</strong> velocidad <strong>de</strong> un<br />
vehículo pesado tipo que circule a velocidad constante, en l<strong>la</strong>no, <strong>de</strong> 80 km/h disminuye por <strong>de</strong>bajo <strong>de</strong> una<br />
velocidad crítica <strong>de</strong> 40 km/h <strong>de</strong>bido a <strong>la</strong> inclinación y <strong>la</strong> longitud <strong>de</strong> <strong>la</strong> rasante.<br />
En <strong>la</strong> tab<strong>la</strong> siguiente se muestran <strong>la</strong>s carreteras y tramos <strong>de</strong> <strong>la</strong>s mismas que cuentan con caídas <strong>de</strong> velocidad:<br />
TRAMOS CON CAÍDAS DE VELOCIDAD EN LA RED OBJETO DEL PLAN<br />
Carretera P.K. Inicio P.K. Final Carril adicional<br />
Red <strong>de</strong> Interés Preferente<br />
14,0 15,0 Sí<br />
N-634<br />
33,0<br />
62,0<br />
34,0<br />
62,7<br />
No<br />
Sí<br />
68,0 69,5 No<br />
N-644<br />
Red Básica<br />
130,7 131,1 Sí<br />
A-124<br />
41,7<br />
56,8<br />
42,3<br />
57,2<br />
No<br />
No<br />
A-132 12,9 16,9 Sí<br />
A-624<br />
21,9 23,7 No<br />
27,6 28,1 No<br />
31,4 32,7 No<br />
34,7 34,9 No<br />
38,1 38,9 No<br />
42,9 43,2 No<br />
47,4 48,7 No<br />
54,9 57,1 No<br />
BI-604 4,0 4,3 Sí<br />
BI-623 34,4 39,9 No<br />
BI-624 64,9 65,7 No<br />
BI-625 383,9 385,2 No<br />
BI-630 35,2 40,0 No<br />
BI-631<br />
BI-633<br />
BI-635<br />
3,8 6,1 Sí (no en toda <strong>la</strong> longitud)<br />
13,2 13,4 No<br />
20,4 21,4 No<br />
24,6 27,4 No<br />
33,1 33,8 Sí<br />
34,2 34,5 Sí<br />
35,6 37,1 Sí<br />
23,4 24,1 No<br />
24,8 25,3 No<br />
BI-636 33,1 33,7 No<br />
GI-627 52,2 53,0 Sí<br />
Fuente: E<strong>la</strong>boración propia.<br />
34<br />
Revisión <strong>de</strong>l Segundo P<strong>la</strong>n General <strong>de</strong> Carreteras <strong>de</strong>l País Vasco
En <strong>la</strong> tab<strong>la</strong> figura, asimismo, <strong>la</strong> coinci<strong>de</strong>ncia, o no, <strong>de</strong> tramos con caída <strong>de</strong> velocidad y <strong>de</strong> carriles adicionales para<br />
vehículos lentos, ya que su presencia permitiría apartarse a estos vehículos sin afectar, por tanto, <strong>la</strong>s condiciones<br />
<strong>de</strong> circu<strong>la</strong>ción <strong>de</strong> los restantes.<br />
Sólo dos carreteras <strong>de</strong> <strong>la</strong> Red <strong>de</strong> Interés Preferente cuentan con tramos con caídas <strong>de</strong> velocidad, <strong>la</strong> N-644 y <strong>la</strong> N-<br />
634, esta última en cuatro puntos a lo <strong>la</strong>rgo <strong>de</strong> su recorrido. La N-644 es carretera <strong>de</strong>sdob<strong>la</strong>da, entendiéndose por<br />
tanto que ya cuenta, en principio, con carriles adicionales que permiten el apartado <strong>de</strong> los vehículos lentos. En<br />
cuanto a <strong>la</strong> N-634, tan sólo dos <strong>de</strong> los cuatro tramos coinci<strong>de</strong>n con <strong>la</strong> existencia <strong>de</strong> carriles para vehículos lentos.<br />
En <strong>la</strong> Red Básica tienen caídas <strong>de</strong> velocidad hasta 13 carreteras, <strong>de</strong>stacando <strong>la</strong> A-624, con ocho tramos, <strong>la</strong> BI-631,<br />
con cuatro, <strong>la</strong> BI-633, con tres tramos, y <strong>la</strong> BI-635 y <strong>la</strong> A-124, con dos cada una, teniendo el resto tan sólo un<br />
tramo con caídas <strong>de</strong> velocidad. La longitud <strong>de</strong> los tramos con caídas <strong>de</strong> velocidad suele osci<strong>la</strong>r entre 1 y 3<br />
kilómetros.<br />
Nuevamente <strong>de</strong>staca <strong>la</strong> A-624 en lo que respecta a los carriles <strong>de</strong> vehículos lentos, ya que carece <strong>de</strong> ellos en<br />
coinci<strong>de</strong>ncia con los tramos <strong>de</strong> caídas <strong>de</strong> velocidad con que cuenta.<br />
En <strong>la</strong> página siguiente se muestra un mapa con <strong>la</strong>s caídas <strong>de</strong> velocidad y <strong>la</strong> presencia <strong>de</strong> carriles para vehículos<br />
lentos en <strong>la</strong> Red Objeto <strong>de</strong>l P<strong>la</strong>n.<br />
35<br />
Revisión <strong>de</strong>l Segundo P<strong>la</strong>n General <strong>de</strong> Carreteras <strong>de</strong>l País Vasco
<strong>2.</strong>1.3 Radios <strong>de</strong> Curvatura<br />
El trazado en p<strong>la</strong>nta lo forman <strong>la</strong>s alineaciones rectas, curvas circu<strong>la</strong>res <strong>de</strong> distintos radios y <strong>la</strong>s alineaciones <strong>de</strong><br />
curvatura variable (clotoi<strong>de</strong>s) que permitan una transición suave entre alineaciones rectas y curvas circu<strong>la</strong>res, o<br />
entre curvas circu<strong>la</strong>res <strong>de</strong> distintos radios.<br />
Los radios <strong>de</strong> <strong>la</strong>s curvas circu<strong>la</strong>res <strong>de</strong>pen<strong>de</strong>rán <strong>de</strong>l tipo <strong>de</strong> vía que se trate, <strong>de</strong> <strong>la</strong> velocidad específica <strong>de</strong> <strong>la</strong><br />
carretera, <strong>de</strong> su peralte y <strong>de</strong> <strong>la</strong>s singu<strong>la</strong>rida<strong>de</strong>s existentes en el<strong>la</strong>, tales como <strong>la</strong>s intersecciones.<br />
Así, según <strong>la</strong> Instrucción <strong>de</strong> Carreteras 3.1.-IC se <strong>de</strong>finen unos radios mínimos para el grupo 1 (Autopistas,<br />
Autovías, Vías rápidas y Carreteras C-100) y otros para el grupo 2 (Carreteras C-80, C-60 y C-40).<br />
El <strong>análisis</strong> que a continuación se presenta ha c<strong>la</strong>sificado los radios <strong>de</strong> <strong>la</strong>s carreteras según éstos sean:<br />
√ Radios menores a 85 metros.<br />
√ Radios mayores o iguales a 85 metros y menores a 190 metros.<br />
√ Radios mayores o iguales a 190 metros y menores a 350 metros.<br />
√ Radios mayores o iguales a 350 metros.<br />
A continuación, se presentan tab<strong>la</strong>s y gráficos don<strong>de</strong> figura para cada Territorio histórico el porcentaje que cada<br />
carretera tiene con los rangos <strong>de</strong> radios acabados <strong>de</strong> <strong>de</strong>finir.<br />
Cuando en <strong>la</strong> carretera se diferencia entre calzada <strong>de</strong>recha e izquierda, se <strong>de</strong>be a que <strong>la</strong> base <strong>de</strong> datos <strong>de</strong> don<strong>de</strong><br />
se han obtenido los datos, diferenciaba entre ambas calzadas.<br />
Radios <strong>de</strong> Curvatura <strong>de</strong>l Territorio Histórico <strong>de</strong> Á<strong>la</strong>va<br />
RADIOS DE CURVATURA EN LAS CARRETERAS DE LA RED FUNCIONAL<br />
(% LONGITUD)<br />
Carretera R 350 m<br />
Red <strong>de</strong> Interés Preferente<br />
AP-68 <strong>de</strong>r. 0,0 0,0 0,0 0,0 100,0<br />
AP-68 izq. 0,0 0,0 0,0 0,0 100,0<br />
N-I 0,0 0,0 1,8 8,2 90,0<br />
N-102 0,0 0,0 2,5 3,7 93,8<br />
N-104 0,0 0,0 3,1 19,6 77,3<br />
N-124 0,0 1,0 5,6 19,2 75,2<br />
N-240 <strong>de</strong>r. 14,8 10,1 3,4 4,9 66,7<br />
N-240 izq. 9,6 11,3 2,5 2,6 74,0<br />
N-622 0,0 0,0 0,0 11,7 88,3<br />
N-624<br />
Red Básica<br />
0,0 0,5 2,8 4,3 92,4<br />
A-124 50,9 21,2 6,4 4,1 17,4<br />
A-126 32,5 12,1 5,4 5,8 44,3<br />
A-132 26,3 17,2 4,0 5,8 46,7<br />
A-623 55,3 17,5 4,3 7,9 15,0<br />
A-624 45,1 17,8 7,1 7,2 22,8<br />
A-625 <strong>de</strong>r. 45,9 16,5 4,9 8,1 24,6<br />
A-625 izq. 71,2 9,4 3,8 5,7 9,9<br />
A-627<br />
Red Comarcal<br />
32,4 7,7 2,1 4,7 53,1<br />
A-2122 35,1 14,0 6,3 6,9 37,6<br />
A-2124 50,9 21,2 6,4 4,1 17,4<br />
A-2126 45,8 13,2 6,2 5,8 29,0<br />
A-2128 48,8 15,2 3,3 5,6 27,1<br />
A-2130 9,1 24,0 6,7 8,2 52,0<br />
A-2134 37,9 8,5 2,5 4,8 46,2<br />
A-2521 42,3 13,7 6,4 6,3 31,3<br />
A-2522 60,2 19,8 6,4 5,0 8,5<br />
A-2604 45,6 12,9 4,2 4,9 32,4<br />
A-2620 54,5 16,6 5,1 5,2 18,7<br />
A-2622 30,6 12,5 5,1 6,6 45,2<br />
A-2625 39,3 14,5 5,9 5,6 34,7<br />
Fuente: Inventarios Diputaciones y e<strong>la</strong>boración propia.<br />
37<br />
Revisión <strong>de</strong>l Segundo P<strong>la</strong>n General <strong>de</strong> Carreteras <strong>de</strong>l País Vasco
RADIOS DE CURVATURA (%) EN LAS CARRETERAS DE LA RED DE INTERÉS PREFERENTE<br />
100<br />
90<br />
80<br />
70<br />
60<br />
50<br />
40<br />
30<br />
20<br />
10<br />
0<br />
N-I AP-68<br />
<strong>de</strong>r.<br />
AP-68<br />
izq.<br />
N-240<br />
<strong>de</strong>r.<br />
N-240 izq. N-622 N-102 N-104 N-124 N-624<br />
% lo ng. 350 (m)<br />
Fuente: Inventarios Diputaciones y e<strong>la</strong>boración propia.<br />
En <strong>la</strong>s carreteras <strong>de</strong> <strong>la</strong> Red <strong>de</strong> Interés Preferente los radios <strong>de</strong> curvatura <strong>de</strong> <strong>la</strong>s carreteras son en <strong>la</strong> mayoría <strong>de</strong> los<br />
casos superiores a los 350 metros, salvo en el caso <strong>de</strong> <strong>la</strong> N-240, que cuenta con porcentajes <strong>de</strong> longitud<br />
significativos con radios menores.<br />
RADIOS DE CURVATURA (%) EN LAS CARRETERAS DE LA RED BÁSICA<br />
80,0<br />
70,0<br />
60,0<br />
50,0<br />
40,0<br />
30,0<br />
20,0<br />
10,0<br />
0,0<br />
A-132 A-624 A-124 A-627 A-625 <strong>de</strong>r. A-625 izq. A-623 A-126<br />
% long. 350 (m)<br />
Fuente: Inventarios Diputaciones y e<strong>la</strong>boración propia.<br />
La Red Básica <strong>de</strong> Á<strong>la</strong>va muestra importantes variaciones entre tramos <strong>de</strong> radio <strong>de</strong> curvatura superior a 350<br />
metros y tramos <strong>de</strong> radio <strong>de</strong> curvatura inferior a 85 metros. En este último caso l<strong>la</strong>ma <strong>la</strong> atención <strong>la</strong> carretera A-<br />
625 en sentido <strong>de</strong>scen<strong>de</strong>nte que contiene un 71% <strong>de</strong> longitud con radios inferiores a 85 metros.<br />
RADIOS DE CURVATURA (%) EN LAS CARRETERAS DE LA RED COMARCAL<br />
70,0<br />
60,0<br />
50,0<br />
40,0<br />
30,0<br />
20,0<br />
10,0<br />
0,0<br />
A-2126 A-2128 A-2124 A-2130 A-2134 A-2122 A-2622 A-2625 A-2521 A-2604 A-2522 A-2620<br />
% lo ng. 350 (m)<br />
Fuente: Inventarios Diputaciones y e<strong>la</strong>boración propia.<br />
En <strong>la</strong> Red Comarcal <strong>de</strong> Á<strong>la</strong>va, igual que en <strong>la</strong> Red Básica p<strong>red</strong>ominan <strong>la</strong>s carreteras en <strong>la</strong>s que en <strong>la</strong> mayor parte<br />
<strong>de</strong> su longitud los radios son superiores a 350 metros o inferiores a 85 metros. En el caso <strong>de</strong> <strong>la</strong> A-2124, A-2522 y<br />
A-2620 el porcentaje <strong>de</strong> longitud <strong>de</strong> carretera con radio inferior a 85 supera el 50% y en el extremo opuesto, está<br />
<strong>la</strong> carretera A-2130 en <strong>la</strong> que en más <strong>de</strong>l 50% <strong>de</strong> su longitud los radios <strong>de</strong> curvatura son superiores a 350 metros.<br />
38<br />
Revisión <strong>de</strong>l Segundo P<strong>la</strong>n General <strong>de</strong> Carreteras <strong>de</strong>l País Vasco
Radios <strong>de</strong> Curvatura <strong>de</strong>l Territorio Histórico <strong>de</strong> Bizkaia<br />
Carretera R 350 m<br />
Red <strong>de</strong> Interés Preferente<br />
AP-68 <strong>de</strong>r. 0,0 0,0 0,0 0,0 100,0<br />
AP-68 izq. 0,0 0,0 0,0 0,0 100,0<br />
A-8 <strong>de</strong>r. 0,0 0,0 0,3 5,8 93,9<br />
A-8 izq. 0,0 0,0 0,3 6,6 93,2<br />
N-240 3,1 11,9 4,1 5,5 75,4<br />
N-629 4,4 18,2 5,2 7,3 64,8<br />
N-633 <strong>de</strong>r. 0,0 14,9 3,6 1,8 79,7<br />
N-633 izq. 0,0 11,8 1,1 1,1 86,0<br />
N-634 <strong>de</strong>r. 3,0 10,9 4,5 7,1 74,5<br />
N-634 izq. 1,0 11,0 6,0 6,8 75,2<br />
N-636 <strong>de</strong>r. 4,9 7,4 3,7 6,2 77,9<br />
N-636 izq. 4,9 2,3 0,0 2,3 90,5<br />
N-637 <strong>de</strong>r. 0,0 0,0 0,0 2,6 97,4<br />
N-637 izq. 0,0 0,0 0,0 4,5 95,5<br />
N-639 2,6 14,6 8,9 11,5 62,4<br />
N-644 <strong>de</strong>r. 12,3 12,6 2,8 4,4 67,9<br />
N-644 izq.<br />
Red Básica<br />
8,0 8,7 1,4 13,6 68,2<br />
BI-604 <strong>de</strong>r. 4,0 7,5 7,5 21,9 59,1<br />
BI-604 izq. 5,0 8,6 15,4 8,1 62,8<br />
BI-623 <strong>de</strong>r. 0,0 0,0 0,0 25,7 74,3<br />
BI-623 izq. 5,0 8,8 3,0 5,6 77,6<br />
BI-624 15,2 18,3 12,5 12,5 41,4<br />
BI-625 <strong>de</strong>r. 0,6 14,8 8,2 6,2 70,1<br />
BI-625 izq. 0,7 9,2 5,9 6,8 77,5<br />
BI-630 13,1 19,0 5,1 6,6 56,3<br />
BI-631 <strong>de</strong>r. 0,1 2,9 2,5 8,5 86,1<br />
BI-631 izq. 8,0 10,5 4,9 9,5 67,1<br />
BI-633 2,5 11,0 7,4 9,2 69,9<br />
RADIOS DE CURVATURA EN LAS CARRETERAS DE LA RED FUNCIONAL<br />
(% LONGITUD)<br />
Carretera R 350 m<br />
BI-634 5,1 11,9 4,2 8,3 70,6<br />
BI-635 5,0 17,0 4,5 6,1 67,3<br />
BI-636 0,9 4,4 5,7 8,0 81,1<br />
BI-637 <strong>de</strong>r. 1,1 3,1 2,6 7,9 85,4<br />
BI-637 izq. 1,0 1,8 1,8 9,5 85,9<br />
BI-638<br />
Red Comarcal<br />
13,6 35,2 4,8 9,6 36,8<br />
BI-2121 11,2 14,5 5,9 7,8 60,6<br />
BI-2122 6,9 16,9 6,7 6,0 63,5<br />
BI-2224 23,1 18,1 6,0 8,9 43,9<br />
BI-2235 2,1 7,9 2,6 3,3 84,0<br />
BI-2238 21,5 17,4 5,6 6,2 49,2<br />
BI-2521 14,2 11,8 4,2 6,0 63,9<br />
BI-2522 3,2 17,6 9,1 7,4 62,7<br />
BI-2543 11,6 17,8 5,4 7,2 58,0<br />
BI-2604 1,2 6,1 2,4 6,2 84,1<br />
BI-2617 5,0 17,8 5,3 9,5 62,3<br />
BI-2625 0,0 0,0 0,0 0,0 100,0<br />
BI-2636 22,5 14,8 4,6 8,9 49,2<br />
BI-2701 7,3 16,9 7,4 10,0 58,4<br />
BI-2704 13,7 13,7 5,6 9,4 57,6<br />
BI-2713 16,6 20,2 4,7 7,2 51,4<br />
Fuente: Inventarios Diputaciones y e<strong>la</strong>boración propia.<br />
39<br />
Revisión <strong>de</strong>l Segundo P<strong>la</strong>n General <strong>de</strong> Carreteras <strong>de</strong>l País Vasco
RADIOS DE CURVATURA (%) EN LAS CARRETERAS DE LA RED DE INTERÉS PREFERENTE<br />
100,0<br />
90,0<br />
80,0<br />
70,0<br />
60,0<br />
50,0<br />
40,0<br />
30,0<br />
20,0<br />
10,0<br />
0,0<br />
% lo ng. 350 (m)<br />
Fuente: Inventarios Diputaciones y e<strong>la</strong>boración propia.<br />
En <strong>la</strong> Red <strong>de</strong> Interés Preferente <strong>de</strong> Bizkaia <strong>la</strong> mayoría <strong>de</strong> <strong>la</strong>s carreteras cuentan con radios superiores a los 350<br />
metros en porcentajes muy altos <strong>de</strong> su longitud total. Destacan porcentajes, siempre inferiores al 10%, <strong>de</strong> radios<br />
inferiores a 85 metros en <strong>la</strong>s carreteras convencionales <strong>de</strong> <strong>la</strong> Red <strong>de</strong> Interés Preferente, si bien en estos casos<br />
también <strong>la</strong> mayor parte <strong>de</strong> <strong>la</strong> longitud <strong>de</strong> <strong>la</strong> vía cuenta con radios superiores a los 350 metros.<br />
RADIOS DE CURVATURA (%) EN LAS CARRETERAS DE LA RED BÁSICA<br />
90,0<br />
80,0<br />
70,0<br />
60,0<br />
50,0<br />
40,0<br />
30,0<br />
20,0<br />
10,0<br />
0,0<br />
% lo ng. 350 (m)<br />
Fuente: Inventarios Diputaciones y e<strong>la</strong>boración propia.<br />
En cuanto a <strong>la</strong> Red Básica <strong>de</strong> Bizkaia, también p<strong>red</strong>ominan los radios superiores a los 350 metros, si bien en este<br />
caso son más frecuentes los tramos con radios inferiores. Sólo en <strong>la</strong>s carreteras BI-624, BI-630 y BI-638 el<br />
porcentaje <strong>de</strong> longitud con radios inferiores a 85 metros supera el 10%.<br />
RADIOS DE CURVATURA (%) EN LAS CARRETERAS DE LA RED COMARCAL<br />
100,0<br />
90,0<br />
80,0<br />
70,0<br />
60,0<br />
50,0<br />
40,0<br />
30,0<br />
20,0<br />
10,0<br />
0,0<br />
% lo ng. 350 (m)<br />
Fuente: Inventarios Diputaciones y e<strong>la</strong>boración propia.<br />
En <strong>la</strong> Red Comarcal Bizkaia se mantiene <strong>la</strong> misma tónica que en los casos anteriores, es <strong>de</strong>cir, <strong>la</strong> mayor parte <strong>de</strong><br />
<strong>la</strong>s longitu<strong>de</strong>s e <strong>la</strong>s carreteras disponen <strong>de</strong> radios mayores <strong>de</strong> 350 metros, siendo <strong>la</strong> presencia <strong>de</strong> radios inferiores<br />
mucho más importante en este caso.<br />
40<br />
Revisión <strong>de</strong>l Segundo P<strong>la</strong>n General <strong>de</strong> Carreteras <strong>de</strong>l País Vasco
Radios <strong>de</strong> Curvatura <strong>de</strong>l Territorio Histórico <strong>de</strong> Gipuzkoa<br />
RADIOS DE CURVATURA EN LAS CARRETERAS DE LA RED FUNCIONAL<br />
(% LONGITUD)<br />
Carretera R 350 m<br />
Red <strong>de</strong> Interés Preferente<br />
A-1 <strong>de</strong>r. 0,0 0,1 0,3 2,5 97,1<br />
A-1 izq. 0,0 0,0 0,0 0,8 99,2<br />
A-8 <strong>de</strong>r. 0,0 0,1 5,8 4,4 89,7<br />
A-8 izq. 0,0 0,0 6,6 4,3 89,0<br />
A-15 <strong>de</strong>r. 0,0 0,1 2,1 9,2 88,6<br />
A-15 izq. 0,1 0,1 2,0 7,3 90,6<br />
N-I <strong>de</strong>r. 0,9 3,7 9,8 5,2 80,5<br />
N-I izq. 0,9 4,0 9,9 4,9 80,3<br />
N-634 9,6 20,0 9,8 3,1 57,4<br />
N-636 <strong>de</strong>r. 21,2 9,7 10,3 4,0 54,8<br />
N-636 izq. 0,0 0,7 27,2 14,9 57,2<br />
N-638<br />
Red Básica<br />
1,8 5,8 4,0 2,2 86,3<br />
GI-131 5,3 10,5 6,2 4,7 73,2<br />
GI-627 7,9 16,0 13,8 5,3 57,0<br />
GI-631 11,2 19,9 10,1 2,8 55,9<br />
GI-638 15,0 18,6 11,0 3,7 51,8<br />
Red Comarcal<br />
GI-2120 12,9 18,8 10,4 3,6 54,4<br />
GI-2130 11,9 18,3 9,7 2,9 57,2<br />
GI-2132 2,3 17,2 7,4 2,6 70,4<br />
GI-2135 6,6 29,5 8,3 2,8 52,7<br />
GI-2620 8,5 16,5 10,1 2,9 62,0<br />
GI-2630 9,3 16,1 9,4 3,0 62,3<br />
GI-2632 63,2 7,9 4,5 1,4 23,0<br />
GI-2634 12,7 13,7 9,9 3,7 59,9<br />
GI-2636 39,1 21,4 9,5 3,0 26,9<br />
Fuente: Inventarios Diputaciones y e<strong>la</strong>boración propia.<br />
RADIOS DE CURVATURA (%) EN LAS CARRETERAS DE LA RED DE INTERÉS PREFERENTE<br />
100,0<br />
90,0<br />
80,0<br />
70,0<br />
60,0<br />
50,0<br />
40,0<br />
30,0<br />
20,0<br />
10,0<br />
0,0<br />
N-I <strong>de</strong>r. N-I izq. A-8<br />
<strong>de</strong>r.<br />
A-8 izq. A-15<br />
<strong>de</strong>r.<br />
A-15<br />
izq.<br />
AP-1<br />
<strong>de</strong>r.<br />
AP-1<br />
izq.<br />
N-634 N-636<br />
<strong>de</strong>r.<br />
% lo ng. 350 (m)<br />
Fuente: Inventarios Diputaciones y e<strong>la</strong>boración propia.<br />
Nota: La carretera N-636 es carretera convencional a excepción <strong>de</strong> un pequeño tramo al comienzo <strong>de</strong> <strong>la</strong> misma don<strong>de</strong> se trata <strong>de</strong> una vía <strong>de</strong><br />
doble calzada. La calzada izquierda <strong>de</strong> esta carretera se refiere a ese tramo <strong>de</strong> doble calzada.<br />
En todas <strong>la</strong>s carreteras <strong>de</strong> <strong>la</strong> Red <strong>de</strong> Interés Preferente <strong>de</strong> Gipuzkoa los radios <strong>de</strong> curvatura <strong>de</strong> <strong>la</strong>s carreteras son<br />
en más <strong>de</strong>l 50% <strong>de</strong> sus longitu<strong>de</strong>s, superiores a los 350 metros.<br />
N-636<br />
izq.<br />
N-638<br />
RADIOS DE CURVATURA (%) EN LAS CARRETERAS DE LA RED BÁSICA<br />
80,0<br />
70,0<br />
60,0<br />
50,0<br />
40,0<br />
30,0<br />
20,0<br />
10,0<br />
0,0<br />
GI-131 GI-627 GI-631 GI-638<br />
% lo ng. 350 (m)<br />
Fuente: Inventarios Diputaciones y e<strong>la</strong>boración propia.<br />
41<br />
Revisión <strong>de</strong>l Segundo P<strong>la</strong>n General <strong>de</strong> Carreteras <strong>de</strong>l País Vasco
Al igual que en <strong>la</strong>s carreteras <strong>de</strong> <strong>la</strong> Red <strong>de</strong> Interés Preferente, en <strong>la</strong>s cuatro carreteras <strong>de</strong> <strong>la</strong> Red Básica los radios<br />
<strong>de</strong> curvatura son, en más <strong>de</strong>l 50% <strong>de</strong> <strong>la</strong> longitud total <strong>de</strong> <strong>la</strong>s vías, superiores a los 350 metros.<br />
RADIOS DE CURVATURA (%) EN LAS CARRETERAS DE LA RED COMARCAL<br />
80,0<br />
70,0<br />
60,0<br />
50,0<br />
40,0<br />
30,0<br />
20,0<br />
10,0<br />
0,0<br />
GI-2620 GI-2630 GI-2120 GI-2132 GI-2135 GI-2632 GI-2130 GI-2634 GI-2636<br />
% lo ng. 350 (m)<br />
Fuente: Inventarios Diputaciones y e<strong>la</strong>boración propia.<br />
En <strong>la</strong> Red Comarcal guipuzcoana, salvo en el caso <strong>de</strong> <strong>la</strong>s carreteras GI-2632 y GI-2636 que contienen radios<br />
menores <strong>de</strong> 85 metros en <strong>la</strong> mayor parte <strong>de</strong> <strong>la</strong> vía (63% <strong>de</strong> su longitud en el caso <strong>de</strong> <strong>la</strong> GI-2632 y 39% en <strong>la</strong> GI-<br />
2636), <strong>la</strong> mayoría <strong>de</strong> <strong>la</strong>s carreteras discurren por tramos don<strong>de</strong> en más <strong>de</strong>l 50% <strong>de</strong> su longitud el radio <strong>de</strong><br />
curvatura es superior a 350 metros.<br />
42<br />
Revisión <strong>de</strong>l Segundo P<strong>la</strong>n General <strong>de</strong> Carreteras <strong>de</strong>l País Vasco
<strong>2.</strong>1.4 Sección transversal<br />
<strong>2.</strong>1.4.1. Número <strong>de</strong> carriles<br />
Para el estudio <strong>de</strong> <strong>la</strong> sección transversal en <strong>la</strong>s carreteras <strong>de</strong> <strong>la</strong> Red Funcional, se ha diferenciado entre<br />
Autopistas; Autovías y vías <strong>de</strong> doble calzada, y carreteras convencionales, distinguiendo en cada caso y en primer<br />
lugar el número <strong>de</strong> carriles que <strong>la</strong>s constituyen. Se presenta en primer lugar una tab<strong>la</strong> don<strong>de</strong> figura el porcentaje<br />
<strong>de</strong> cada una <strong>de</strong> <strong>la</strong>s carreteras <strong>de</strong> <strong>la</strong> Red Funcional que tienen <strong>de</strong>s<strong>de</strong> 1 carril (en algún caso <strong>de</strong> carreteras <strong>de</strong> <strong>la</strong> Red<br />
Comarcal) hasta 8 carriles (4 por sentido <strong>de</strong> circu<strong>la</strong>ción).<br />
46<br />
Revisión <strong>de</strong>l Segundo P<strong>la</strong>n General <strong>de</strong> Carreteras <strong>de</strong>l País Vasco
NÚMERO DE CARRILES EN LAS CARRETERAS DE LA RED FUNCIONAL<br />
(% LONGITUD)<br />
Carretera 1 carril 2 carriles 3 carriles 4 carriles 5 carriles 6 carriles 7 carriles 8 carriles<br />
Red <strong>de</strong> Interés Preferente<br />
AP-68 0 0 0 56 2 42 0 0<br />
A-1 0 0 0 100 0 0 0 0<br />
A-1 0 0 0 95 4 1 0 0<br />
A-8 0 0 0 81 7 12 0 0<br />
A-15 0 0 0 100 0 0 0 0<br />
N-I 0 8 2 84 2 3 0 0<br />
N-102 0 0 0 80 20 0 0 0<br />
N-104 0 95 5 0 0 0 0 0<br />
N-121-A 0 100 0 0 0 0 0 0<br />
N-124 0 100 0 0 0 0 0 0<br />
N-240 0 70 9 19 2 0 0 0<br />
N-622 0 0 0 100 0 0 0 0<br />
N-624 0 0 0 100 0 0 0 0<br />
N-629 0 100 0 0 0 0 0 0<br />
N-633 0 0 10 77 13 0 0 0<br />
N-634 0 95 4 1 0 0 0 0<br />
N-636 0 70 15 15 0 0 0 0<br />
N-637 0 0 0 63 17 15 0 4<br />
N-638 0 94 6 0 0 0 0 0<br />
N-639 0 90 10 0 0 0 0 0<br />
N-644 0 0 0 100 0 0 0 0<br />
47<br />
Revisión <strong>de</strong>l Segundo P<strong>la</strong>n General <strong>de</strong> Carreteras <strong>de</strong>l País Vasco
NÚMERO DE CARRILES EN LAS CARRETERAS DE LA RED FUNCIONAL<br />
(% LONGITUD)<br />
Carretera 1 carril 2 carriles 3 carriles 4 carriles 5 carriles 6 carriles 7 carriles 8 carriles<br />
Red Básica<br />
A-124 0 89 11 0 0 0 0 0<br />
A-126 0 99,5 0,5 0 0 0 0 0<br />
A-132 0 84 16 0 0 0 0 0<br />
A-623 0 100 0 0 0 0 0 0<br />
A-624 0 93 7 0 0 0 0 0<br />
A-625 0 81 11 9 0 0 0 0<br />
A-627 0 100 0 0 0 0 0 0<br />
BI-604 0 25 11 16 11 37 0 0<br />
BI-623 0 91 3 6 0 0 0 0<br />
BI-624 0 100 0 0 0 0 0 0<br />
BI-625 0 75 0 25 0 0 0 0<br />
BI-630 0 100 0 0 0 0 0 0<br />
BI-631 0 49 16 33 2 0 0 0<br />
BI-633 0 72 28 0 0 0 0 0<br />
BI-634 0 89 10 1 0 0 0 0<br />
BI-635 0 74 26 0 0 0 0 0<br />
BI-636 0 87 4 9 1 0 0 0<br />
BI-637 0 11 0 87 2 0 0 0<br />
BI-638 0 100 0 0 0 0 0 0<br />
GI-131 0 100 0 0 0 0 0 0<br />
GI-627 0 94 6 0 0 0 0 0<br />
GI-631 0 94 5 1 0 0 0 0<br />
GI-638 0 100 0 0 0 0 0 0<br />
48<br />
Revisión <strong>de</strong>l Segundo P<strong>la</strong>n General <strong>de</strong> Carreteras <strong>de</strong>l País Vasco
NÚMERO DE CARRILES EN LAS CARRETERAS DE LA RED FUNCIONAL<br />
(% LONGITUD)<br />
Carretera 1 carril 2 carriles 3 carriles 4 carriles 5 carriles 6 carriles 7 carriles 8 carriles<br />
Red Comarcal<br />
A-2122 0 99,8 0,2 0 0 0 0 0<br />
A-2124 0 100 0 0 0 0 0 0<br />
A-2126 0 99,7 0,3 0 0 0 0 0<br />
A-2128 0 99,3 0,3 0,4 0 0 0 0<br />
A-2130 0 98,8 0,3 0,9 0 0 0 0<br />
A-2134 9 85 3 3 0 0 0 0<br />
A-2521 2 97 0,4 0,6 0 0 0 0<br />
A-2522 10 47 39 4 0 0 0 0<br />
A-2604 0 100 0 0 0 0 0 0<br />
A-2620 0 99,7 0,3 0 0 0 0 0<br />
A-2622 0 99,3 0,5 0,2 0 0 0 0<br />
A-2625 0 99,9 0,1 0 0 0 0 0<br />
BI-2121 0 94 5 1 0 0 0 0<br />
BI-2122 0 83 2 0 0 0 0 0<br />
BI-2224 0 100 0 0 0 0 0 0<br />
BI-2235 0 96 3 1 0 0 0 0<br />
BI-2238 0 99 1 0 0 0 0 0<br />
BI-2405 0 97 2 1 0 0 0 0<br />
BI-2521 0 100 0 0 0 0 0 0<br />
BI-2522 0 92 6 2 0 0 0 0<br />
BI-2543 0 99,4 0,5 0,1 0 0 0 0<br />
BI-2604 0 99 1 0 0 0 0 0<br />
BI-2617 0 100 0 0 0 0 0 0<br />
BI-2625 0 93 4 3 0 0 0 0<br />
BI-2636 0 100 0 0 0 0 0 0<br />
BI-2701 0 97 2 1 0 0 0 0<br />
BI-2704 0 78 18 3 0 0 0 0<br />
BI-2713 0 100 0 0 0 0 0 0<br />
GI-2120 0 99 1 0 0 0 0 0<br />
GI-2130 0 100 0 0 0 0 0 0<br />
GI-2132 0 100 0 0 0 0 0 0<br />
GI-2135 0,6 99 0,4 0 0 0 0 0<br />
GI-2620 0 100 0 0 0 0 0 0<br />
GI-2630 0 100 0 0 0 0 0 0<br />
GI-2633 0 100 0 0 0 0 0 0<br />
GI-2634 0 93 7 0 0 0 0 0<br />
GI-2636 0 100 0 0 0 0 0 0<br />
Fuente: Inventarios Diputaciones y e<strong>la</strong>boración propia.<br />
49<br />
Revisión <strong>de</strong>l Segundo P<strong>la</strong>n General <strong>de</strong> Carreteras <strong>de</strong>l País Vasco
NÚMERO DE CARRILES EN LAS AUTOPISTAS DE LA RED DE INTERÉS PREFERENTE<br />
100<br />
90<br />
80<br />
70<br />
60<br />
50<br />
40<br />
30<br />
20<br />
10<br />
0<br />
% Long. con 2<br />
carriles<br />
% Long. con 3<br />
carriles<br />
% Long. con 4<br />
carriles<br />
% Long. con 5<br />
carriles<br />
% Long. con 6<br />
carriles<br />
A-1 A-8 A-15 AP-1 AP-68<br />
Fuente: E<strong>la</strong>boración propia.<br />
% Long. con 7<br />
carriles<br />
% Long. con 8<br />
carriles<br />
El grueso <strong>de</strong> <strong>la</strong> longitud total <strong>de</strong> Autopistas <strong>de</strong> <strong>la</strong> Red Objeto cuenta con 2 carriles por sentido <strong>de</strong> circu<strong>la</strong>ción, salvo<br />
<strong>la</strong> AP-68 y tramos seña<strong>la</strong>dos <strong>de</strong> <strong>la</strong> A-8.<br />
En el caso concreto <strong>de</strong> <strong>la</strong> AP-68 se trata <strong>de</strong> una vía que posee un tramo <strong>de</strong> tres carriles por sentido contenido<br />
entre el P.K. 4+150 y el P.K. 35+510 que nace en <strong>la</strong>s inmediaciones <strong>de</strong> Bilbao y que supone el 42% <strong>de</strong> <strong>la</strong> vía. El<br />
58% restante es una vía <strong>de</strong> 2 carriles por sentido <strong>de</strong> circu<strong>la</strong>ción con tramos ais<strong>la</strong>dos que disponen <strong>de</strong> un tercer<br />
carril adicional <strong>de</strong>pendiendo <strong>de</strong>l sentido.<br />
La A-8 sirve <strong>de</strong> arteria principal <strong>de</strong>l eje Este- Oeste <strong>de</strong> <strong>la</strong> Comunidad Autónoma <strong>de</strong>l País Vasco y atraviesa los<br />
Territorios Históricos <strong>de</strong> Bizkaia y Gipuzkoa. Esta carretera, aunque cuenta en un 81% <strong>de</strong> su longitud con 2<br />
carriles por sentido, posee un tramo comprendido entre los P.K. 113+830 y 140+400, que se caracteriza por<br />
numerosas variaciones en el número carriles por sentido, alternando prácticamente cada kilómetro entre 4, 5 y 6<br />
carriles en p<strong>la</strong>taforma. Esta peculiaridad se <strong>de</strong>be principalmente a <strong>la</strong>s numerosas salidas y entradas con carril<br />
propio así como carriles <strong>de</strong> trenzado que acaecen en <strong>la</strong>s inmediaciones <strong>de</strong> Bilbao Metropolitano.<br />
NÚMERO DE CARRILES EN LAS AUTOVÍAS Y CARRETERAS CONVENCIONALES DE LA RED DE<br />
INTERÉS PREFERENTE<br />
100<br />
90<br />
80<br />
70<br />
60<br />
50<br />
40<br />
30<br />
20<br />
10<br />
0<br />
% Long. con 2 carriles % Long. con 3 carriles % Long. con 4 carriles % Long. con 5 carriles % Long. con 6 carriles<br />
N-I N-102 N-104 N-121 N-124 N-240 N-622 N-624 N-629 N-633 N-634 N-636 N-638<br />
N-639 N-644 N-637<br />
Fuente: E<strong>la</strong>boración propia.<br />
Como se pue<strong>de</strong> apreciar en el gráfico, <strong>la</strong> Red <strong>de</strong> Interés Preferente cuenta en su mayor parte con autovías <strong>de</strong> 2<br />
carriles por sentido <strong>de</strong> circu<strong>la</strong>ción y carreteras convencionales <strong>de</strong> 1 carril por sentido salvo casos concretos.<br />
La N-I, que conecta los núcleos urbanos <strong>de</strong> Vitoria-Gasteiz con Burgos y Donostia-San Sebastián discurre en un<br />
84% <strong>de</strong> su longitud sobre una carretera con dos carriles por sentido. En el caso <strong>de</strong>l tramo comprendido entre<br />
Donostia-San Sebastián y <strong>la</strong> frontera con Francia, dicha carretera cuenta únicamente con un carril por sentido<br />
suponiendo este tramo el 8% <strong>de</strong> <strong>la</strong> longitud total. También hay que <strong>de</strong>stacar que a su paso por Vitoria-Gasteiz en<br />
algo más <strong>de</strong> 4,5 kilómetros aumenta <strong>la</strong> anchura <strong>de</strong> calzada hasta contener un máximo <strong>de</strong> 3 carriles por sentido.<br />
La carretera N-637 sita en el entorno <strong>de</strong>l Bilbao Metropolitano alterna significativamente su número <strong>de</strong> carriles<br />
llegando a contener <strong>de</strong>s<strong>de</strong> 2 hasta 4 carriles por sentido. Esta heterodoxia <strong>de</strong> <strong>la</strong> p<strong>la</strong>taforma <strong>viaria</strong> esta<br />
condicionada por los numerosos en<strong>la</strong>ces <strong>de</strong> entrada y <strong>de</strong> salida que, al igual que <strong>la</strong> A-8, conectan con Bilbao y sus<br />
inmediaciones.<br />
L<strong>la</strong>ma <strong>la</strong> atención en <strong>la</strong>s carreteras N-102 y N-633 el elevado porcentaje, 20% y 12% respectivamente,<br />
correspondiente a <strong>la</strong> longitud <strong>de</strong> vía con 5 carriles. Este dato no es significativo ya que <strong>la</strong> longitud <strong>de</strong> ambas<br />
carreteras es pequeña (5 km y 6 km respectivamente) y por tanto estos porcentajes representan carriles<br />
adicionales y <strong>de</strong> trenzado <strong>de</strong> escasa longitud.<br />
También merece una consi<strong>de</strong>ración <strong>la</strong> N-240 ya que cuenta con un tramo <strong>de</strong> 10 kilómetros (entre el inicio <strong>de</strong> <strong>la</strong><br />
vía en Vitoria-Gasteiz y el nudo con <strong>la</strong>s carreteras A-623, A-2622 y <strong>la</strong> A-627) con 2 carriles por sentido. A partir <strong>de</strong><br />
50<br />
Revisión <strong>de</strong>l Segundo P<strong>la</strong>n General <strong>de</strong> Carreteras <strong>de</strong>l País Vasco
este punto <strong>la</strong> carretera pasa a tener un carril por sentido <strong>de</strong> circu<strong>la</strong>ción, aunque resulta notable que el 12% <strong>de</strong><br />
este tramo <strong>de</strong> carretera convencional correspon<strong>de</strong> a carriles lentos. Esta cifra es significativa en cuanto que esta<br />
carretera vertebra el eje Norte - Sur <strong>de</strong>l Territorio Histórico y es <strong>la</strong> principal alternativa a <strong>la</strong> autopista <strong>de</strong> peaje AP-<br />
68 para realizar el trayecto entre Vitoria-Gasteiz y Bilbao.<br />
De <strong>la</strong> N-636 <strong>de</strong>staca su característico comportamiento en cuanto a carriles por sentido se refiere. En su comienzo<br />
intersecta a <strong>la</strong> N-I como una autovía <strong>de</strong> 2 carriles por sentido y a partir <strong>de</strong>l P.K. 4+500 hasta el P.K. 43+900 se<br />
comporta como una carretera convencional que llega a tener en algunos tramos una p<strong>la</strong>taforma con un total <strong>de</strong> 4<br />
carriles. Este aumento <strong>de</strong>l número <strong>de</strong> carriles llega a representar el 19% <strong>de</strong> <strong>la</strong> longitud completa <strong>de</strong> <strong>la</strong> carretera.<br />
La N-634, dado su recorrido sensiblemente paralelo a <strong>la</strong> A-8, supone una alternativa para recorrer el eje Este -<br />
Oeste <strong>de</strong> <strong>la</strong> Comunidad Autónoma Vasca. Aunque esta carretera funciona como una carretera convencional con un<br />
carril por sentido en el 85% <strong>de</strong> su longitud, al llegar a <strong>la</strong>s inmediaciones <strong>de</strong> Bilbao Metropolitano <strong>la</strong> vía<br />
experimenta un cambio motivado por el carácter peri-urbano <strong>de</strong> <strong>la</strong> zona, y entre los P.K 97+400 y 117+850,<br />
posee 2 carriles por sentido <strong>de</strong> circu<strong>la</strong>ción, representado este fenómeno el 12% <strong>de</strong> <strong>la</strong> longitud total <strong>de</strong> <strong>la</strong> vía.<br />
NÚMERO DE CARRILES EN LAS CARRETERAS DE LA RED BÁSICA. T.H. DE ÁLAVA<br />
100<br />
90<br />
80<br />
70<br />
60<br />
50<br />
40<br />
30<br />
20<br />
10<br />
0<br />
% Long. con 2 carriles % Long. con 3 carriles % Long. con 4 carriles<br />
A-124 A-126 A-132 A-623 A-624 A-625 A-627<br />
Fuente: E<strong>la</strong>boración propia.<br />
Respecto <strong>de</strong> <strong>la</strong> Red Básica <strong>de</strong>l Territorio Histórico <strong>de</strong> Á<strong>la</strong>va cabe seña<strong>la</strong>r <strong>la</strong> carretera A-132 por contener un<br />
importante tramo (<strong>de</strong> 5 kilómetros) con carriles para vehículos lentos en <strong>la</strong>s inmediaciones <strong>de</strong> Vitoria-Gasteiz.<br />
NÚMERO DE CARRILES EN LAS CARRETERAS DE LA RED BÁSICA. T.H. DE BIZKAIA<br />
100<br />
90<br />
80<br />
70<br />
60<br />
50<br />
40<br />
30<br />
20<br />
10<br />
0<br />
% Long. con 2 carriles % Long. con 3 carriles % Long. con 4 carriles % Long. con 5 carriles % Long. con 6 carriles<br />
BI-604 BI-623 BI-624 BI-625 BI-630 BI-631 BI-633 BI-635 BI-636 BI-638 BI-637<br />
Fuente: E<strong>la</strong>boración propia.<br />
La Red Básica <strong>de</strong>l Territorio Histórico <strong>de</strong> Bizkaia es <strong>la</strong> más compleja <strong>de</strong> <strong>la</strong> Red Objeto. Su complejidad resi<strong>de</strong> en <strong>la</strong><br />
cantidad <strong>de</strong> cambios experimentados para albergar el flujo <strong>de</strong> circu<strong>la</strong>ción que genera una gran urbe como Bilbao.<br />
A primera vista se pue<strong>de</strong> observar en el grafico que, aunque <strong>la</strong> mayor parte <strong>de</strong> <strong>la</strong> Red que se está tratando<br />
discurre por carreteras convencionales <strong>de</strong> un solo carril por sentido <strong>de</strong> circu<strong>la</strong>ción, un importante porcentaje <strong>de</strong><br />
carreteras contienen vías <strong>de</strong> dos carriles por sentido y hasta 3 carriles por sentido como es el caso <strong>de</strong> <strong>la</strong> BI-604.<br />
Otro factor seña<strong>la</strong>do es <strong>la</strong> importante proporción <strong>de</strong> carriles lentos para vehículos pesados representados en <strong>la</strong>s<br />
carreteras BI-631, BI-633 y <strong>la</strong> BI-635 <strong>la</strong>s cuales intersectan <strong>de</strong> Norte a Sur <strong>la</strong> A-8 a lo <strong>la</strong>rgo <strong>de</strong> su paso por<br />
Bizkaia. Este factor da lugar a una mejor circu<strong>la</strong>ción <strong>de</strong> vehículos en una zona principalmente montañosa.<br />
Volviendo al singu<strong>la</strong>r caso <strong>de</strong> <strong>la</strong> BI-604, se hace patente el hecho <strong>de</strong> ser una <strong>de</strong> <strong>la</strong>s vías que circunda Bilbao<br />
Metropolitano y por tanto su constante variación <strong>de</strong> carriles totales (2, 3, 4, 5 y hasta 6 carriles totales) a lo <strong>la</strong>rgo<br />
<strong>de</strong> sus escasos 5 kilómetros es una consecuencia <strong>de</strong> los en<strong>la</strong>ces con carril propio que pueda contener así como <strong>la</strong>s<br />
necesida<strong>de</strong>s <strong>de</strong> pasare<strong>la</strong> entre <strong>la</strong> urbe y <strong>la</strong>s <strong>de</strong>más carreteras.<br />
Así mismo <strong>la</strong> BI-637 que conecta Getxo con Bilbao es en su mayor parte una autovía <strong>de</strong> dos carriles por sentido<br />
que hace <strong>la</strong>s veces <strong>de</strong> pasare<strong>la</strong> norte, salvo el último tramo <strong>de</strong> <strong>la</strong> vía que <strong>de</strong> 1,4 kilómetros que contiene un carril<br />
por sentido como carretera convencional.<br />
51<br />
Revisión <strong>de</strong>l Segundo P<strong>la</strong>n General <strong>de</strong> Carreteras <strong>de</strong>l País Vasco
NÚMERO DE CARRILES EN LAS CARRETERAS DE LA RED BÁSICA. T.H. DE GIPUZKOA<br />
100<br />
90<br />
80<br />
70<br />
60<br />
50<br />
40<br />
30<br />
20<br />
10<br />
0<br />
% Long. con 2 carriles % Long. con 3 carriles % Long. con 4 carriles<br />
GI-131 GI-627 GI-631 GI-638<br />
Fuente: E<strong>la</strong>boración propia.<br />
De <strong>la</strong> Red Básica <strong>de</strong> Gipuzkoa solo cabe <strong>de</strong>cir que contiene en su totalidad carreteras convencionales con un carril<br />
por sentido con una baja tasa <strong>de</strong> carriles lentos.<br />
NÚMERO DE CARRILES EN LAS CARRETERAS DE LA RED COMARCAL. T.H. DE ÁLAVA<br />
100<br />
90<br />
80<br />
70<br />
60<br />
50<br />
40<br />
30<br />
20<br />
10<br />
0<br />
% Long. con 1 carril % Long. con 2 carriles % Long. con 3 carriles % Long. con 4 carriles<br />
A-2122 A-2124 A-2126 A-2128 A-2130 A-2134 A-2521 A-2522 A-2604 A-2620 A-2622 A-2625<br />
Fuente: Inventarios Diputaciones y e<strong>la</strong>boración propia.<br />
En <strong>la</strong> Red Comarcal que completa <strong>la</strong> Red Funcional en el Territorio Histórico <strong>de</strong> Á<strong>la</strong>va, todas <strong>la</strong>s carreteras tienen<br />
<strong>la</strong> mayor parte <strong>de</strong> su longitud con dos carriles, uno por sentido <strong>de</strong> circu<strong>la</strong>ción. La excepción <strong>la</strong> cumple <strong>la</strong> carretera<br />
A-2522 (parale<strong>la</strong> en un tramo a <strong>la</strong> AP-68), por constar en el 39% <strong>de</strong> su longitud con tres carriles, es <strong>de</strong>cir, a lo<br />
<strong>la</strong>rgo <strong>de</strong> un gran tramo <strong>de</strong> longitud dispone <strong>de</strong> carril para vehículos lentos. A<strong>de</strong>más, en tres carreteras hay<br />
pequeños tramos, que en ningún caso superan el 10% <strong>de</strong>l total <strong>de</strong> <strong>la</strong> longitud <strong>de</strong> <strong>la</strong> carretera, con p<strong>la</strong>taforma <strong>de</strong><br />
un carril, son <strong>la</strong>s carreteras A-2134, A-2521 y A-252<strong>2.</strong><br />
NÚMERO DE CARRILES EN LAS CARRETERAS DE LA RED COMARCAL. T.H. DE BIZKAIA<br />
100<br />
90<br />
80<br />
70<br />
60<br />
50<br />
40<br />
30<br />
20<br />
10<br />
0<br />
% Long. con 2 carriles % Long. con 3 carriles % Long. con 4 carriles % Long. con 5 carriles<br />
BI-2121 BI-2122 BI-2224 BI-2235 BI-2238 BI-2405 BI-2521 BI-2522 BI-2543 BI-2604 BI-2617<br />
BI-2625 BI-2636 BI-2701 BI-2704 BI-2713<br />
Fuente: Inventarios Diputaciones y e<strong>la</strong>boración propia.<br />
Tal y como ocurre en el caso <strong>de</strong> <strong>la</strong> Red Comarcal <strong>de</strong> Á<strong>la</strong>va, en Gipuzkoa todas <strong>la</strong>s carreteras tienen en <strong>la</strong> práctica<br />
totalidad <strong>de</strong> su longitud un carril por sentido <strong>de</strong> circu<strong>la</strong>ción, es <strong>de</strong>cir, una p<strong>la</strong>taforma <strong>de</strong> dos carriles. La carretera<br />
BI-2704 (al norte <strong>de</strong> Bilbao) es aquel<strong>la</strong> en <strong>la</strong> que <strong>la</strong> longitud <strong>de</strong> carril adicional para vehículos lentos es <strong>la</strong> mayor<br />
<strong>de</strong> todas <strong>la</strong>s consi<strong>de</strong>radas en este grupo con el 18% <strong>de</strong>l total <strong>de</strong> su longitud.<br />
52<br />
Revisión <strong>de</strong>l Segundo P<strong>la</strong>n General <strong>de</strong> Carreteras <strong>de</strong>l País Vasco
NÚMERO DE CARRILES EN LAS CARRETERAS DE LA RED COMARCAL. T.H. DE GIPUKOA<br />
100<br />
90<br />
80<br />
70<br />
60<br />
50<br />
40<br />
30<br />
20<br />
10<br />
0<br />
% Long. con 2 carriles % Long. con 3 carriles<br />
GI-2120 GI-2130 GI-2135 GI-2132 GI-2620 GI-2630 GI-2633 GI-2634 GI-2636<br />
Fuente: Inventarios Diputaciones y e<strong>la</strong>boración propia.<br />
Sólo dos carreteras <strong>de</strong> <strong>la</strong> Red Comarcal guipuzcoana, <strong>la</strong> GI-2120 (antigua GI-120) y <strong>la</strong> GI-2634, tienen algún<br />
tramo con tres carriles, que suponen el 1% y el 7% respectivamente sobre <strong>la</strong> longitud total <strong>de</strong> estas carreteras. El<br />
resto <strong>de</strong> carreteras no disponen <strong>de</strong> carril adicional para <strong>la</strong> circu<strong>la</strong>ción <strong>de</strong> vehículos lentos, <strong>de</strong> modo que a lo <strong>la</strong>rgo<br />
<strong>de</strong> toda su traza constan <strong>de</strong> un carril por sentido <strong>de</strong> circu<strong>la</strong>ción.<br />
53<br />
Revisión <strong>de</strong>l Segundo P<strong>la</strong>n General <strong>de</strong> Carreteras <strong>de</strong>l País Vasco
<strong>2.</strong>1.4.<strong>2.</strong> Anchos <strong>de</strong> p<strong>la</strong>taforma<br />
El estudio <strong>de</strong> <strong>la</strong> sección transversal <strong>de</strong> <strong>la</strong> Red Funcional <strong>de</strong> Carreteras <strong>de</strong>l País Vasco, se completa con el <strong>análisis</strong><br />
<strong>de</strong> los anchos <strong>de</strong> p<strong>la</strong>taforma (calzada más arcenes), habiéndose establecido <strong>la</strong> siguiente c<strong>la</strong>sificación:<br />
√ Carreteras con p<strong>la</strong>taformas menores o iguales a 5 metros.<br />
√ Carreteras con p<strong>la</strong>taformas mayores a 5 metros y menores o iguales a 7 metros.<br />
√ Carreteras con p<strong>la</strong>taformas mayores a 7 metros y menores o iguales a 9 metros.<br />
√ Carreteras con p<strong>la</strong>taformas mayores a 9 metros.<br />
Para cada una <strong>de</strong> <strong>la</strong>s carreteras y según <strong>la</strong> tipología <strong>de</strong> <strong>red</strong> establecida, se ha analizado <strong>la</strong> anchura <strong>de</strong> p<strong>la</strong>taforma<br />
según los rangos <strong>de</strong>finidos expresada como porcentaje <strong>de</strong> longitud respecto al total <strong>de</strong> <strong>la</strong> carretera.<br />
Cuando en <strong>la</strong> carretera se diferencia entre calzada <strong>de</strong>recha e izquierda, se <strong>de</strong>be a que <strong>la</strong> base <strong>de</strong> datos <strong>de</strong> don<strong>de</strong><br />
se han obtenido los datos, diferenciaba entre ambas calzadas.<br />
Anchos <strong>de</strong> P<strong>la</strong>taforma <strong>de</strong>l Territorio Histórico <strong>de</strong> Á<strong>la</strong>va<br />
ANCHOS DE PLATAFORMA EN LAS CARRETERAS DE LA RED FUNCIONAL<br />
Carretera p<strong>la</strong>taforma ≤ 5 metros<br />
Red <strong>de</strong> Interés Preferente<br />
(% LONGITUD)<br />
5 < p<strong>la</strong>taforma ≤ 7<br />
metros<br />
7 < p<strong>la</strong>taforma ≤ 9<br />
metros<br />
p<strong>la</strong>taforma > 9<br />
metros<br />
N-I 0,2 0,6 8,9 90,3<br />
N-102 0,0 1,3 4,4 94,3<br />
N-104 0,0 2,6 9,1 88,3<br />
N-124 0,0 1,2 3,2 95,6<br />
N-240 <strong>de</strong>r. 0,0 3,7 7,0 89,3<br />
N-240 izq. 0,0 1,2 12,8 86,0<br />
Red Básica<br />
N-622 0,0 0,0 9,0 91,0<br />
N-624 2,6 3,8 6,4 87,3<br />
A-124 0,0 46,8 7,4 45,8<br />
A-126 15,0 44,6 39,8 0,7<br />
A-132 0,0 22,2 3,6 74,2<br />
A-623 0,0 88,1 5,3 6,6<br />
A-624 4,1 33,6 19,2 43,1<br />
A-625 <strong>de</strong>r. 0,0 24,7 18,2 57,1<br />
A-625 izq. 0,0 8,0 21,2 70,8<br />
A-627 0,0 12,7 13,1 74,2<br />
Red Comarcal<br />
A-2122 0,3 86,7 12,2 0,8<br />
A-2124 16,8 69,5 0,9 12,8<br />
A-2126 4,6 36,9 50,5 7,9<br />
A-2128 21,2 75,7 1,2 1,9<br />
A-2130 0,0 0,6 10,3 89,1<br />
A-2134 0,0 8,8 9,8 81,4<br />
A-2521 0,7 90,8 4,5 4,0<br />
A-2522 0,4 61,3 26,9 11,5<br />
A-2604 0,0 94,8 3,8 1,4<br />
A-2620 0,9 66,4 21,8 10,8<br />
A-2622 0,7 89,0 8,6 1,7<br />
A-2625 0,0 86,7 12,0 1,4<br />
Fuente: Inventarios Diputaciones y e<strong>la</strong>boración propia.<br />
55<br />
Revisión <strong>de</strong>l Segundo P<strong>la</strong>n General <strong>de</strong> Carreteras <strong>de</strong>l País Vasco
ANCHOS DE PLATAFORMA (%) EN LAS CARRETERAS DE LA RED DE INTERÉS PREFERENTE<br />
10 0<br />
90<br />
80<br />
70<br />
60<br />
50<br />
40<br />
30<br />
20<br />
10<br />
0<br />
A-1 N-240 <strong>de</strong>r. N-240 izq. N-622 N-102 N-104 N-124 N-624<br />
% long.9 (m)<br />
Fuente: Inventarios Diputaciones y e<strong>la</strong>boración propia.<br />
Todas <strong>la</strong>s carreteras <strong>de</strong> <strong>la</strong> Red <strong>de</strong> Interés Preferente <strong>de</strong> Á<strong>la</strong>va, tienen anchos <strong>de</strong> p<strong>la</strong>taforma que en más <strong>de</strong>l 90%<br />
<strong>de</strong> su longitud es superior a 7 metros.<br />
ANCHOS DE PLATAFORMA (%) EN LAS CARRETERAS DE LA RED BÁSICA<br />
90<br />
80<br />
70<br />
60<br />
50<br />
40<br />
30<br />
20<br />
10<br />
0<br />
A-132 A-624 A124 A-627 A-625 <strong>de</strong>r. A-625 izq. A-623 A-126<br />
% long.9 (m)<br />
Fuente: Inventarios Diputaciones y e<strong>la</strong>boración propia.<br />
Respecto a <strong>la</strong>s 7 carreteras convencionales <strong>de</strong> <strong>la</strong> Red Básica a<strong>la</strong>vesa, sólo <strong>la</strong> A-126 contiene un tramo <strong>de</strong> notable<br />
longitud (15% respecto a <strong>la</strong> longitud total <strong>de</strong> <strong>la</strong> carretera) con ancho <strong>de</strong> p<strong>la</strong>taforma inferior a 5 metros. El resto <strong>de</strong><br />
<strong>la</strong> Red Básica <strong>de</strong> Á<strong>la</strong>va cuenta con anchos <strong>de</strong> p<strong>la</strong>taforma que varían entre 5 metros y anchos superiores a 9<br />
metros con <strong>la</strong> única excepción <strong>de</strong> <strong>la</strong> A-623 que discurre en <strong>la</strong> práctica totalidad <strong>de</strong> su longitud por una calzada <strong>de</strong><br />
5 a 7 metros <strong>de</strong> ancho.<br />
ANCHOS DE PLATAFORMA (%) EN LAS CARRETERAS DE LA RED COMARCAL<br />
10 0<br />
90<br />
80<br />
70<br />
60<br />
50<br />
40<br />
30<br />
20<br />
10<br />
0<br />
% long.9 (m)<br />
Fuente: Inventarios Diputaciones y e<strong>la</strong>boración propia.<br />
La mayoría <strong>de</strong> <strong>la</strong>s carreteras <strong>de</strong> <strong>la</strong> Red Comarcal a<strong>la</strong>vesa tienen anchos <strong>de</strong> p<strong>la</strong>taforma comprendidos entre 5 y 7<br />
metros, tal y como se observa en <strong>la</strong> gráfica adjunta, y <strong>de</strong>stacan respecto al resto <strong>la</strong>s carreteras A-2130 y A-2134<br />
por tener importantes tramos (más <strong>de</strong>l 80% <strong>de</strong> su longitud) con anchos <strong>de</strong> p<strong>la</strong>taforma superiores a 9 metros. En<br />
el extremo opuesto, <strong>la</strong>s carreteras A-2124 y A-2128 son <strong>la</strong>s que registran los mayores tramos con anchos <strong>de</strong><br />
p<strong>la</strong>taforma inferiores a 5 metros que en ningún caso superan el 22% <strong>de</strong>l total <strong>de</strong> <strong>la</strong> longitud <strong>de</strong> <strong>la</strong> misma.<br />
56<br />
Revisión <strong>de</strong>l Segundo P<strong>la</strong>n General <strong>de</strong> Carreteras <strong>de</strong>l País Vasco
Anchos <strong>de</strong> P<strong>la</strong>taforma <strong>de</strong>l Territorio Histórico <strong>de</strong> Bizkaia<br />
Carretera p<strong>la</strong>taforma ≤ 5 metros<br />
Red <strong>de</strong> Interés Preferente<br />
5 < p<strong>la</strong>taforma ≤ 7<br />
metros<br />
7 < p<strong>la</strong>taforma ≤ 9<br />
metros<br />
ANCHOS DE PLATAFORMA EN LAS CARRETERAS DE LA RED FUNCIONAL<br />
p<strong>la</strong>taforma > 9<br />
metros<br />
AP-68 <strong>de</strong>r. 0,0 0,0 1,1 98,9<br />
AP-68 izq. 0,0 0,0 1,2 98,8<br />
A-8 <strong>de</strong>r. 0,0 0,0 7,7 92,3<br />
A-8 izq. 0,0 0,0 7,2 92,8<br />
N-240 0,0 14,4 9,5 76,1<br />
N-629 8,4 74,9 16,7 0,0<br />
N-633 <strong>de</strong>r. 5,4 15,4 10,9 68,3<br />
N-633 izq. 0,0 17,3 28,6 54,1<br />
N-634 <strong>de</strong>r. 0,0 18,5 28,1 53,4<br />
N-634 izq. 4,1 28,9 43,8 23,2<br />
N-636 <strong>de</strong>r. 0,4 47,5 15,7 36,4<br />
N-636 izq. 0,0 6,1 9,9 84,0<br />
N-637 <strong>de</strong>r. 1,5 1,8 7,7 88,9<br />
N-637 izq. 0,0 0,5 9,2 90,3<br />
N-639 0,0 12,0 37,9 50,1<br />
N-644 <strong>de</strong>r. 0,0 0,4 23,5 76,1<br />
N-644 izq. 2,8 0,0 30,6 66,6<br />
Red Básica<br />
BI-604 <strong>de</strong>r. 4,0 11,7 27,8 56,5<br />
BI-604 izq. 13,0 5,7 14,7 66,7<br />
BI-623 <strong>de</strong>r. 0,0 52,7 26,0 21,2<br />
BI-623 izq. 5,6 4,9 60,8 28,7<br />
BI-624 6,5 62,2 26,3 5,0<br />
BI-625 <strong>de</strong>r. 0,3 15,1 32,8 52,1<br />
BI-625 izq. 1,0 30,8 19,9 48,3<br />
BI-630 0,0 77,3 21,6 1,1<br />
BI-631 <strong>de</strong>r. 0,0 5,8 36,6 57,6<br />
BI-631 izq. 0,0 18,5 53,3 28,1<br />
BI-633 0,0 19,8 4,5 75,7<br />
BI-634 0,0 18,0 58,7 23,3<br />
BI-635 0,0 1,7 21,0 77,3<br />
BI-636 0,6 17,7 12,1 69,6<br />
(% LONGITUD)<br />
Carretera p<strong>la</strong>taforma ≤ 5 metros<br />
5 < p<strong>la</strong>taforma ≤ 7<br />
metros<br />
7 < p<strong>la</strong>taforma ≤ 9<br />
metros<br />
p<strong>la</strong>taforma > 9<br />
metros<br />
BI-637 <strong>de</strong>r. 0,2 0,0 23,6 76,2<br />
BI-637 izq. 0,2 0,2 27,0 72,6<br />
BI-638 0,0 59,2 23,3 17,5<br />
Red Comarcal<br />
BI-2121 0,0 0,0 29,5 70,5<br />
BI-2122 0,0 30,0 21,8 48,2<br />
BI-2224 0,0 98,0 1,7 0,4<br />
BI-2235 0,0 70,8 7,9 21,3<br />
BI-2238 0,0 80,2 16,3 3,5<br />
BI-2521 18,7 75,8 4,2 1,3<br />
BI-2522 0,0 27,4 46,9 25,7<br />
BI-2543 0,2 34,6 63,9 1,3<br />
BI-2604 0,0 56,9 33,4 9,7<br />
BI-2617 2,9 78,7 6,1 12,2<br />
BI-2625 0,0 0,0 88,4 11,6<br />
BI-2636 0,0 80,7 17,9 1,4<br />
BI-2701 0,0 47,6 15,1 37,3<br />
BI-2704 1,1 60,7 9,9 28,4<br />
BI-2713 1,2 15,8 20,5 62,6<br />
Fuente: Inventarios Diputaciones y e<strong>la</strong>boración propia.<br />
57<br />
Revisión <strong>de</strong>l Segundo P<strong>la</strong>n General <strong>de</strong> Carreteras <strong>de</strong>l País Vasco
ANCHOS DE PLATAFORMA (%) EN LAS CARRETERAS DE LA RED DE INTERÉS PREFERENTE<br />
100<br />
90<br />
80<br />
70<br />
60<br />
50<br />
40<br />
30<br />
20<br />
10<br />
0<br />
AP-68 <strong>de</strong>r.<br />
AP-68 Izq.<br />
A-8 <strong>de</strong>r.<br />
A-8 izq.<br />
N-240<br />
N-629<br />
N-633 <strong>de</strong>r.<br />
N-633 izq.<br />
% long.9 (m)<br />
N-637 <strong>de</strong>r<br />
N-637 izq.<br />
N-639<br />
Fuente: Inventarios Diputaciones y e<strong>la</strong>boración propia.<br />
Los anchos <strong>de</strong> p<strong>la</strong>taforma <strong>de</strong> <strong>la</strong>s carreteras convencionales vizcaínas que forman parte <strong>de</strong> <strong>la</strong> Red <strong>de</strong> Interés<br />
Preferente son los que se muestran en el gráfico adjunto. En él se observa que <strong>la</strong> mayor parte <strong>la</strong>s carreteras<br />
contienen anchos <strong>de</strong> p<strong>la</strong>taforma superiores a 9 metros.<br />
La excepción, <strong>la</strong> forman <strong>la</strong> carretera N-629 don<strong>de</strong> no por no tener ningún tramo a lo <strong>la</strong>rgo <strong>de</strong> sus casi 4<br />
kilómetros con ancho <strong>de</strong> p<strong>la</strong>taforma superior a 9 metros.<br />
N-644 <strong>de</strong>r.<br />
N-644 izq.<br />
N-636 <strong>de</strong>r.<br />
N-636 izq.<br />
ANCHOS DE PLATAFORMA (%) EN LAS CARRETERAS DE LA RED BÁSICA<br />
80<br />
70<br />
60<br />
50<br />
40<br />
30<br />
20<br />
10<br />
0<br />
% long.9 (m)<br />
Fuente: Inventarios Diputaciones y e<strong>la</strong>boración propia.<br />
En el caso <strong>de</strong> <strong>la</strong> Red Básica <strong>de</strong> Bizkaia el ancho <strong>de</strong> p<strong>la</strong>taforma a lo <strong>la</strong>rgo <strong>de</strong> <strong>la</strong> longitud total <strong>de</strong> <strong>la</strong>s carreteras<br />
se reparte indistintamente entre calzadas <strong>de</strong> 5 a 7 metros, 7 a 9 metros y más <strong>de</strong> 9 metros. A pesar <strong>de</strong> esta<br />
heterogeneidad p<strong>red</strong>ominan, en 9 <strong>de</strong> <strong>la</strong>s 17 carreteras, <strong>la</strong>s calzadas en <strong>la</strong>s que más <strong>de</strong>l 50% <strong>de</strong> su longitud<br />
contiene anchos <strong>de</strong> p<strong>la</strong>taforma superiores a 9 metros.<br />
ANCHOS DE PLATAFORMA (%) EN LAS CARRETERAS DE LA RED COMARCAL<br />
10 0<br />
90<br />
80<br />
70<br />
60<br />
50<br />
40<br />
30<br />
20<br />
10<br />
0<br />
% long.9 (m)<br />
Fuente: Inventarios Diputaciones y e<strong>la</strong>boración propia.<br />
58<br />
Revisión <strong>de</strong>l Segundo P<strong>la</strong>n General <strong>de</strong> Carreteras <strong>de</strong>l País Vasco
Finalmente, en <strong>la</strong> Red Comarcal <strong>de</strong> Bizkaia <strong>la</strong> mayor parte <strong>de</strong> <strong>la</strong>s carreteras presentan anchos <strong>de</strong> p<strong>la</strong>taforma<br />
que varían entre los 5 metros y los 7 metros. Las carreteras que cuentan en alguno <strong>de</strong> sus tramos con<br />
anchos inferiores a 5 metros son <strong>la</strong> BI-2521 con el 19% <strong>de</strong> <strong>la</strong> longitud total <strong>de</strong> <strong>la</strong> carretera, <strong>la</strong> BI-2617 con el<br />
3% y <strong>la</strong> BI-2713 con tan sólo el 1%.<br />
Anchos <strong>de</strong> P<strong>la</strong>taforma <strong>de</strong>l Territorio Histórico <strong>de</strong> Gipuzkoa<br />
ANCHOS DE PLATAFORMA EN LAS CARRETERAS DE LA RED FUNCIONAL<br />
Carretera p<strong>la</strong>taforma ≤ 5 metros<br />
Red <strong>de</strong> Interés Preferente<br />
(% LONGITUD)<br />
5 < p<strong>la</strong>taforma ≤ 7<br />
metros<br />
7 < p<strong>la</strong>taforma ≤ 9<br />
metros<br />
p<strong>la</strong>taforma > 9<br />
metros<br />
A-1 <strong>de</strong>r. 0,0 0,0 22,0 78,0<br />
A-1 izq. 0,0 0,0 27,1 72,9<br />
A-8 <strong>de</strong>r. 0,0 0,0 0,9 99,1<br />
A-8 izq. 0,0 2,0 6,6 91,4<br />
A-15 <strong>de</strong>r. 0,0 0,6 11,6 87,8<br />
A-15 izq. 0,0 5,2 43,9 50,9<br />
N-I <strong>de</strong>r. 1,2 5,0 26,8 66,9<br />
N-I izq. 0,5 6,1 24,4 69,0<br />
N-121-A 1,4 73,2 25,3 0,0<br />
N-634 0,1 35,5 46,8 17,6<br />
N-636 <strong>de</strong>r. 0,1 10,3 26,1 63,4<br />
N-636 izq. 0,0 0,0 9,2 90,8<br />
Red Básica<br />
N-638 0,0 28,7 22,3 49,0<br />
GI-131 2,6 58,3 24,9 14,2<br />
GI-627 0,4 16,6 45,7 37,3<br />
GI-631 0,3 33,5 37,4 28,8<br />
GI-638 7,8 43,6 43,4 5,1<br />
Red Comarcal<br />
GI-2120 6,4 81,1 12,5 0,0<br />
GI-2130 5,7 79,0 10,4 4,9<br />
GI-2132 0,2 3,5 73,9 22,4<br />
GI-2135 0,0 10,5 86,5 3,0<br />
GI-2620 0,0 8,0 66,6 25,4<br />
GI-2630 1,3 50,0 39,6 9,1<br />
GI-2632 0,2 79,1 15,4 5,3<br />
GI-2634 0,0 71,9 5,7 22,4<br />
GI-2636 7,0 93,0 0,0 0,0<br />
Fuente: Inventarios Diputaciones y e<strong>la</strong>boración propia.<br />
ANCHOS DE PLATAFORMA (%) EN LAS CARRETERAS DE LA RED DE INTERÉS PREFERENTE<br />
10 0 ,0<br />
90,0<br />
80,0<br />
70,0<br />
60,0<br />
50,0<br />
40,0<br />
30,0<br />
20,0<br />
10 ,0<br />
0,0<br />
% long.9 (m)<br />
Fuente: Inventarios Diputaciones y e<strong>la</strong>boración propia.<br />
Nota: La carretera N-636 es carretera convencional a excepción <strong>de</strong> un pequeño tramo al comienzo <strong>de</strong> <strong>la</strong> misma don<strong>de</strong> se trata <strong>de</strong> una<br />
vía <strong>de</strong> doble calzada. La calzada izquierda <strong>de</strong> esta carretera se refiere a ese tramo <strong>de</strong> doble calzada.<br />
En <strong>la</strong>s carreteras guipuzcoanas <strong>de</strong> <strong>la</strong> Red <strong>de</strong> Interés Preferente están c<strong>la</strong>ramente diferenciadas <strong>la</strong>s Autovías<br />
y Autopistas <strong>de</strong> <strong>la</strong>s carreteras convencionales. En el primer caso, el ancho <strong>de</strong> p<strong>la</strong>taforma supera en <strong>la</strong> mayor<br />
parte <strong>de</strong> <strong>la</strong> vía los 9 metros (<strong>la</strong> Autopista A-15 es <strong>la</strong> que menor longitud <strong>de</strong> vía con este ancho tiene, pero<br />
que en cualquier caso es superior a 50%.<br />
Respecto a <strong>la</strong>s carreteras convencionales, su ancho <strong>de</strong> p<strong>la</strong>taforma varía entre los 5 y los 9 metros en <strong>la</strong><br />
mayor parte <strong>de</strong> sus respectivas longitu<strong>de</strong>s.<br />
59<br />
Revisión <strong>de</strong>l Segundo P<strong>la</strong>n General <strong>de</strong> Carreteras <strong>de</strong>l País Vasco
ANCHOS DE PLATAFORMA (%) EN LAS CARRETERAS DE LA RED BÁSICA<br />
90<br />
80<br />
70<br />
60<br />
50<br />
40<br />
30<br />
20<br />
10<br />
0<br />
GI-131 GI-627 GI-631 GI-638 GI-120<br />
% long.9 (m)<br />
Fuente: Inventarios Diputaciones y e<strong>la</strong>boración propia.<br />
La carretera que contiene a lo <strong>la</strong>rgo <strong>de</strong> su trazado el mayor tramo con ancho <strong>de</strong> p<strong>la</strong>taforma menor a 5<br />
metros es <strong>la</strong> GI-638, don<strong>de</strong> el 8% <strong>de</strong> su longitud tiene <strong>la</strong> p<strong>la</strong>taforma por <strong>de</strong>bajo <strong>de</strong> este valor.<br />
Las carreteras contienen tramos con anchos <strong>de</strong> p<strong>la</strong>taforma entre 7 y 9 metros, respecto a sus longitu<strong>de</strong>s<br />
totales, que varían entre el 10% y el 50%.<br />
Finalmente, <strong>la</strong> carretera GI-627 es <strong>la</strong> que contiene el mayor porcentaje <strong>de</strong> longitud con p<strong>la</strong>taformas mayores<br />
a 9 metros.<br />
ANCHOS DE PLATAFORMA (%) EN LAS CARRETERAS DE LA RED COMARCAL<br />
10 0<br />
90<br />
80<br />
70<br />
60<br />
50<br />
40<br />
30<br />
20<br />
10<br />
0<br />
GI-2620 GI-2630 GI-2132 GI-2632 GI-2120 GI-2130 GI-2135 GI-2634 GI-2636<br />
% long.9 (m)<br />
Fuente: Inventarios Diputaciones y e<strong>la</strong>boración propia.<br />
Todas <strong>la</strong>s carreteras <strong>de</strong> <strong>la</strong> Red Comarcal <strong>de</strong> Gipuzkoa, a excepción <strong>de</strong> dos, presentan, en más <strong>de</strong>l 50% <strong>de</strong> su<br />
longitud, anchos <strong>de</strong> p<strong>la</strong>taforma comprendidos entre 5 y 7 metros. Estas dos carreteras son <strong>la</strong> GI-2132 y <strong>la</strong><br />
GI-2620 y en el<strong>la</strong>s el ancho <strong>de</strong> p<strong>la</strong>taforma p<strong>red</strong>ominante (en más <strong>de</strong>l 60% <strong>de</strong> sus longitu<strong>de</strong>s respectivas)<br />
está comprendido entre los 7 metros y los 9 metros.<br />
Comparativa <strong>de</strong> los anchos <strong>de</strong> p<strong>la</strong>taforma en <strong>la</strong> Revisión <strong>actual</strong>, con P<strong>la</strong>nes <strong>de</strong> Carreteras<br />
anteriores<br />
Con objeto <strong>de</strong> comparar <strong>la</strong> evolución <strong>de</strong> los anchos <strong>de</strong> p<strong>la</strong>taforma a lo <strong>la</strong>rgo <strong>de</strong> los años, se presentan <strong>la</strong>s<br />
siguientes tab<strong>la</strong>s y gráficos, en los que para <strong>la</strong>s carreteras <strong>de</strong> <strong>la</strong> Red Funcional se comparan los datos (en<br />
%) que figuran en <strong>la</strong> presente Revisión (datos <strong>de</strong>l año 2004) con los correspondientes a p<strong>la</strong>nes anteriores, el<br />
P<strong>la</strong>n <strong>de</strong> Carreteras <strong>de</strong>l año 1999 (cuyos datos son <strong>de</strong>l año 1997) y el P<strong>la</strong>n <strong>de</strong> Carreteras <strong>de</strong>l año 1993 (datos<br />
<strong>de</strong> 1991).<br />
COMPARATIVA DE ANCHOS DE PLATAFORMA CON PLANES ANTERIORES. T.H. DE ÁLAVA<br />
Ancho <strong>de</strong> p<strong>la</strong>taforma<br />
Revisión<br />
(Datos 2004)<br />
P.C.1999<br />
(Datos 1997)<br />
P.C.1993<br />
(Datos 1991)<br />
A.P. ≤ 5m 3,0 % 0,0 % 4,0 %<br />
5m < A.P. ≤ 7m 39,0 % 34,0 % 37,0%<br />
7m < A.P. ≤ 9m 11,0 % 15,0 % 22,0%<br />
9m < A.P. 47,0 % 51,0 % 37,0%<br />
Fuente: E<strong>la</strong>boración propia.<br />
60<br />
Revisión <strong>de</strong>l Segundo P<strong>la</strong>n General <strong>de</strong> Carreteras <strong>de</strong>l País Vasco
ANCHOS DE PLATAFORMA EN LAS CARRETERAS DE LA RED FUNCIONAL. T.H. DE ÁLAVA<br />
60<br />
50<br />
40<br />
30<br />
20<br />
10<br />
0<br />
Revisión (Datos 2004) P.C.1999 (Datos 1997) P.C.1993 (Datos 1991)<br />
A.P.
ANCHOS DE PLATAFORMA EN LAS CARRETERAS DE LA RED FUNCIONAL. T.H. DE GIPUZKOA<br />
60<br />
50<br />
40<br />
30<br />
20<br />
10<br />
0<br />
Revisión (Datos 2004) P.C.1999 (Datos 1997) P.C.1993 (Datos 1991)<br />
A.P.
<strong>2.</strong>1.5 Posibilidad <strong>de</strong> a<strong>de</strong><strong>la</strong>ntamiento<br />
Se han analizado <strong>la</strong>s posibilida<strong>de</strong>s <strong>de</strong> a<strong>de</strong><strong>la</strong>ntamiento en <strong>la</strong>s carreteras <strong>de</strong> <strong>la</strong> Red Objeto y, en <strong>la</strong> tab<strong>la</strong> y<br />
gráficos adjuntos se presentan los porcentajes <strong>de</strong> a<strong>de</strong><strong>la</strong>ntamiento en cada una <strong>de</strong> <strong>la</strong>s mismas respecto a su<br />
longitud total, diferenciando si está permitido a<strong>de</strong><strong>la</strong>ntar en sentido ascen<strong>de</strong>nte (P.K.s crecientes), en sentido<br />
<strong>de</strong>scen<strong>de</strong>nte (P.K. <strong>de</strong>crecientes), en ambos sentidos, o bien si por el contrario no está permitido a<strong>de</strong><strong>la</strong>ntar.<br />
Lógicamente <strong>la</strong>s Autovías y Autopistas que constan <strong>de</strong> dos o más carriles por sentido <strong>de</strong> circu<strong>la</strong>ción tienen<br />
permitido a<strong>de</strong><strong>la</strong>ntar en ambos sentidos en el 100% <strong>de</strong> <strong>la</strong> longitud <strong>de</strong> <strong>la</strong> carretera.<br />
POSIBILIDAD DE ADELANTAMIENTO EN LAS CARRETERAS DE LA RED OBJETO<br />
Carretera<br />
% Long. prohibido<br />
a<strong>de</strong><strong>la</strong>ntar<br />
% Long. permitido<br />
a<strong>de</strong><strong>la</strong>ntar sentido<br />
ascen<strong>de</strong>nte<br />
% Long. permitido<br />
a<strong>de</strong><strong>la</strong>ntar sentido<br />
<strong>de</strong>scen<strong>de</strong>nte<br />
% Long. permitido<br />
a<strong>de</strong><strong>la</strong>ntar ambos<br />
sentidos<br />
AP-68 0,0 0,0 0,0 100,0<br />
A-1 0,0 0,0 0,0 100,0<br />
A-8 0,0 0,0 0,0 100,0<br />
A-15 0,0 0,0 0,0 100,0<br />
N-I 6,0 1,3 1,4 91,3<br />
N-102 0,0 0,0 0,0 100,0<br />
N-104 50,6 16,0 4,8 28,6<br />
N-121-A 24,7 20,4 19,9 35,1<br />
N-124 67,5 4,0 10,3 18,3<br />
N-240 31,5 11,0 19,7 37,8<br />
N-622 0,0 0,0 0,0 100,0<br />
N-624 0,0 0,0 0,0 100,0<br />
N-629 4,7 20,7 33,4 41,1<br />
N-633 0,0 0,0 0,0 100,0<br />
N-634 46,7 13,1 16,0 24,3<br />
N-636 42,2 14,9 11,9 31,0<br />
N-637 0,0 0,0 0,0 100,0<br />
N-638 60,4 0,0 12,5 27,1<br />
N-639 59,5 8,6 8,9 23,0<br />
N-644 0,0 0,0 0,0 100,0<br />
A-124 28,3 16,5 15,6 39,6<br />
A-132 32,6 17,7 15,8 33,8<br />
A-623 61,2 15,4 8,2 15,2<br />
Carretera<br />
% Long. prohibido<br />
a<strong>de</strong><strong>la</strong>ntar<br />
% Long. permitido<br />
a<strong>de</strong><strong>la</strong>ntar sentido<br />
ascen<strong>de</strong>nte<br />
% Long. permitido<br />
a<strong>de</strong><strong>la</strong>ntar sentido<br />
<strong>de</strong>scen<strong>de</strong>nte<br />
% Long. permitido<br />
a<strong>de</strong><strong>la</strong>ntar ambos<br />
sentidos<br />
A-624 49,2 23,5 5,7 21,7<br />
A-625 58,9 9,6 8,1 23,3<br />
A-627 61,9 9,9 9,7 18,6<br />
BI-604 14,2 32,2 0,0 53,6<br />
BI-623 38,5 11,4 13,9 36,2<br />
BI-624 39,5 10,7 12,4 37,5<br />
BI-625 63,9 3,6 13,5 19,0<br />
BI-630 44,8 16,9 15,9 22,5<br />
BI-631 28,6 10,9 15,2 45,3<br />
BI-633 48,6 17,6 12,1 21,8<br />
BI-635 62,5 13,6 10,8 13,1<br />
BI-636 54,0 10,0 11,4 24,6<br />
BI-637 12,7 0,0 0,0 87,3<br />
BI-638 100,0 0,0 0,0 0,0<br />
GI-131 67,3 7,4 2,3 23,1<br />
GI-627 49,4 15,2 14,0 21,4<br />
GI-631 40,2 23,1 14,2 22,6<br />
GI-638 64,2 8,4 10,0 17,4<br />
Fuente: E<strong>la</strong>boración propia.<br />
Destacan, por su mayor <strong>de</strong>ficiencia en esta cuestión, carreteras como <strong>la</strong> BI-638, en <strong>la</strong> que no es posible<br />
a<strong>de</strong><strong>la</strong>ntar en todo el recorrido, pero también otras que superan el 50%, como <strong>la</strong> GI-131, <strong>la</strong> GI-138 en<br />
Gipuzkoa, <strong>la</strong> BI-636, <strong>la</strong> BI-625, en Bizkaia, o <strong>la</strong>s <strong>de</strong> Á<strong>la</strong>va A-627, A-625 o A-623, todas el<strong>la</strong>s <strong>de</strong> <strong>la</strong> Red Básica.<br />
Dentro <strong>de</strong> <strong>la</strong> Red <strong>de</strong> Interés Preferente <strong>de</strong>stacan <strong>la</strong> N-638, con un porcentaje <strong>de</strong>l 60% <strong>de</strong> prohibido<br />
a<strong>de</strong><strong>la</strong>ntar, N-639, con otro 60%, o <strong>la</strong> N-104, con un 51%.<br />
66<br />
Revisión <strong>de</strong>l Segundo P<strong>la</strong>n General <strong>de</strong> Carreteras <strong>de</strong>l País Vasco
POSIBILIDAD DE ADELANTAMIENTO EN LAS CARRETERAS DE LA RED DE INTERÉS PREFERENTE<br />
(EXCLUYENDO AUTOVÍAS Y AUTOPISTAS)<br />
100,0<br />
90,0<br />
80,0<br />
70,0<br />
60,0<br />
50,0<br />
40,0<br />
30,0<br />
20,0<br />
10,0<br />
0,0<br />
% Long. prohibido<br />
a<strong>de</strong><strong>la</strong>ntar<br />
% Long. permitido a<strong>de</strong><strong>la</strong>ntar<br />
sentido ascen<strong>de</strong>nte<br />
% Long. permitido a<strong>de</strong><strong>la</strong>ntar<br />
sentido <strong>de</strong>scen<strong>de</strong>nte<br />
N-I N-104 N-121-A N-124 N-240 N-629 N-634 N-636 N-638 N-639<br />
Fuente: E<strong>la</strong>boración propia.<br />
% Long. permitido a<strong>de</strong><strong>la</strong>ntar<br />
ambos sentidos<br />
En <strong>la</strong>s carreteras <strong>de</strong> <strong>la</strong> Red <strong>de</strong> Interés Preferente, excluyendo aquel<strong>la</strong>s que son Autopistas o Autovías por<br />
tener permitido el a<strong>de</strong><strong>la</strong>ntamiento en toda <strong>la</strong> vía, en más <strong>de</strong>l 50% <strong>de</strong> <strong>la</strong> longitud <strong>de</strong> sus carreteras está<br />
permitido a<strong>de</strong><strong>la</strong>ntar en los dos sentidos <strong>de</strong> manera simultánea y en el 30% <strong>de</strong> los mismos, no se permite<br />
a<strong>de</strong><strong>la</strong>ntar ni en sentido ascen<strong>de</strong>nte ni en <strong>de</strong>scen<strong>de</strong>nte.<br />
POSIBILIDAD DE ADELANTAMIENTO EN LAS CARRETERAS DE LA RED BÁSICA. T.H. DE ÁLAVA<br />
70<br />
60<br />
50<br />
40<br />
30<br />
20<br />
10<br />
0<br />
% Long. prohibido<br />
a<strong>de</strong><strong>la</strong>ntar<br />
% Long. permitido a<strong>de</strong><strong>la</strong>ntar<br />
sentido ascen<strong>de</strong>nte<br />
% Long. permitido a<strong>de</strong><strong>la</strong>ntar<br />
sentido <strong>de</strong>scen<strong>de</strong>nte<br />
A-124 A-132 A-623 A-624 A-625 A-627<br />
Fuente: E<strong>la</strong>boración propia.<br />
% Long. permitido a<strong>de</strong><strong>la</strong>ntar<br />
ambos sentidos<br />
En el caso <strong>de</strong> <strong>la</strong>s carreteras <strong>de</strong> <strong>la</strong> Red Básica sitas en el Territorio Histórico <strong>de</strong> Á<strong>la</strong>va, en casi <strong>la</strong> mitad <strong>de</strong> <strong>la</strong><br />
longitud total <strong>de</strong> <strong>la</strong>s mismas (43,3%) está prohibido a<strong>de</strong><strong>la</strong>ntar tanto para los vehículos que circu<strong>la</strong>n en un<br />
sentido como para los que lo hacen en sentido contrario.<br />
POSIBILIDAD DE ADELANTAMIENTO EN LAS CARRETERAS DE LA RED BÁSICA. T.H. DE BIZKAIA<br />
100<br />
90<br />
80<br />
70<br />
60<br />
50<br />
40<br />
30<br />
20<br />
10<br />
0<br />
% Long. prohibido<br />
a<strong>de</strong><strong>la</strong>ntar<br />
% Long. permitido a<strong>de</strong><strong>la</strong>ntar<br />
sentido ascen<strong>de</strong>nte<br />
% Long. permitido a<strong>de</strong><strong>la</strong>ntar<br />
sentido <strong>de</strong>scen<strong>de</strong>nte<br />
% Long. permitido a<strong>de</strong><strong>la</strong>ntar<br />
ambos sentidos<br />
BI-604 BI-623 BI-624 BI-625 BI-630 BI-631 BI-633 BI-635 BI-636 BI-637 BI-638<br />
Fuente: E<strong>la</strong>boración propia.<br />
67<br />
Revisión <strong>de</strong>l Segundo P<strong>la</strong>n General <strong>de</strong> Carreteras <strong>de</strong>l País Vasco
Tal y como se observa en <strong>la</strong> gráfica adjunta, <strong>la</strong> mayor parte <strong>de</strong> los tramos <strong>de</strong> <strong>la</strong>s carreteras que constituyen<br />
<strong>la</strong> Red Básica <strong>de</strong> Bizkaia tienen prohibido el a<strong>de</strong><strong>la</strong>ntamiento en ambos sentidos, <strong>de</strong>stacando <strong>la</strong> carretera BI-<br />
638 por ser <strong>la</strong> única que tiene prohibido el a<strong>de</strong><strong>la</strong>ntamiento en toda su longitud.<br />
POSIBILIDAD DE ADELANTAMIENTO EN LAS CARRETERAS DE LA RED BÁSICA. T.H. DE<br />
GIPUZKOA<br />
70<br />
60<br />
50<br />
40<br />
30<br />
20<br />
10<br />
0<br />
% Long. prohibido<br />
a<strong>de</strong><strong>la</strong>ntar<br />
% Long. permitido<br />
a<strong>de</strong><strong>la</strong>ntar sentido<br />
ascen<strong>de</strong>nte<br />
% Long. permitido<br />
a<strong>de</strong><strong>la</strong>ntar sentido<br />
<strong>de</strong>scen<strong>de</strong>nte<br />
GI-131 GI-627 GI-631 GI-638<br />
Fuente: E<strong>la</strong>boración propia.<br />
% Long. permitido<br />
a<strong>de</strong><strong>la</strong>ntar ambos sentidos<br />
Finalmente, en el Territorio Histórico <strong>de</strong> Gipuzkoa, <strong>la</strong> mitad <strong>de</strong> <strong>la</strong> longitud total <strong>de</strong> <strong>la</strong>s carreteras tienen<br />
prohibido el a<strong>de</strong><strong>la</strong>ntamiento en uno u otro sentido, <strong>de</strong>stacando <strong>la</strong>s carreteras GI-131 y GI-638 pues en el<strong>la</strong>s<br />
se prohíbe a<strong>de</strong><strong>la</strong>ntar en más <strong>de</strong>l 60% <strong>de</strong> sus longitu<strong>de</strong>s totales.<br />
POSIBILIDAD DE ADELANTAMIENTO EN LA RED DE INTERÉS PREFERENTE<br />
53,1<br />
(EXCLUYENDO AUTOVÍAS Y AUTOPISTAS)<br />
9,8<br />
29,7<br />
% Long. prohibido a<strong>de</strong><strong>la</strong>ntar<br />
% Long. permitido a<strong>de</strong><strong>la</strong>ntar sentido ascen<strong>de</strong>nte<br />
% Long. permitido a<strong>de</strong><strong>la</strong>ntar sentido <strong>de</strong>scen<strong>de</strong>nte<br />
% Long. permitido a<strong>de</strong><strong>la</strong>ntar ambos sentidos<br />
Fuente: E<strong>la</strong>boración propia.<br />
POSIBILIDAD DE ADELANTAMIENTO EN LA RED BÁSICA<br />
28,5<br />
11,8<br />
14,8<br />
% Long. prohibido a<strong>de</strong><strong>la</strong>ntar<br />
% Long. permitido a<strong>de</strong><strong>la</strong>ntar sentido ascen<strong>de</strong>nte<br />
% Long. permitido a<strong>de</strong><strong>la</strong>ntar sentido <strong>de</strong>scen<strong>de</strong>nte<br />
% Long. permitido a<strong>de</strong><strong>la</strong>ntar ambos sentidos<br />
Fuente: E<strong>la</strong>boración propia.<br />
7,4<br />
44,9<br />
68<br />
Revisión <strong>de</strong>l Segundo P<strong>la</strong>n General <strong>de</strong> Carreteras <strong>de</strong>l País Vasco
<strong>2.</strong>1.6 Seguridad vial<br />
<strong>2.</strong>1.6.1. Acci<strong>de</strong>ntalidad<br />
En <strong>la</strong> siguiente tab<strong>la</strong>, figura <strong>la</strong> acci<strong>de</strong>ntalidad en <strong>la</strong>s carreteras <strong>de</strong> <strong>la</strong> Red Funcional en el período <strong>de</strong> <strong>análisis</strong><br />
(1999 – 2003), distinguiendo entre el número total <strong>de</strong> acci<strong>de</strong>ntes con víctimas ocurridos y el número <strong>de</strong> los<br />
acci<strong>de</strong>ntes mortales; es <strong>de</strong>cir, aquellos en los que al menos una persona ha resultado muerta.<br />
ACCIDENTALIDAD EN LA RED FUNCIONAL (PERÍODO 1999 – 2003)<br />
Territorio Histórico y Año<br />
Á<strong>la</strong>va<br />
Bizkaia<br />
Gipuzkoa<br />
CAPV<br />
Nº Acci<strong>de</strong>ntes con<br />
Víctimas<br />
Nº Acci<strong>de</strong>ntes Mortales<br />
1999 320 38<br />
2000 348 28<br />
2001 393 40<br />
2002 474 25<br />
2003 475 28<br />
1999 1.032 43<br />
2000 1.314 41<br />
2001 1.486 44<br />
2002 1.720 58<br />
2003 1.674 49<br />
1999 494 47<br />
2000 482 42<br />
2001 1.234 42<br />
2002 1.121 43<br />
2003 1.171 49<br />
1999 1.846 128<br />
2000 <strong>2.</strong>144 111<br />
2001 3.113 126<br />
2002 3.315 126<br />
2003 3.320 126<br />
Fuente: E<strong>la</strong>boración propia a partir <strong>de</strong> datos <strong>de</strong> <strong>la</strong> Dirección General <strong>de</strong> Tráfico.<br />
70<br />
Revisión <strong>de</strong>l Segundo P<strong>la</strong>n General <strong>de</strong> Carreteras <strong>de</strong>l País Vasco
DISTRIBUCIÓN DEL TOTAL DE ACCIDENTES CON VÍCTIMAS EN LAS CARRETERAS DE LA RED<br />
FUNCIONAL POR TERRITORIO HISTÓRICO<br />
50,4%<br />
AÑO 2003<br />
Á<strong>la</strong>va Gipuzkoa Bizkaia<br />
14,3%<br />
35,3%<br />
Fuente: E<strong>la</strong>boración propia a partir <strong>de</strong> datos <strong>de</strong> <strong>la</strong> Dirección General <strong>de</strong> Tráfico.<br />
PORCENTAJE DE ACCIDENTES MORTALES SOBRE EL TOTAL DE ACCIDENTES CON VÍCTIMAS EN<br />
LAS CARRETERAS DE LA RED FUNCIONAL POR TERRITORIO HISTÓRICO<br />
2,9%<br />
4,2%<br />
AÑO 2003<br />
Á<strong>la</strong>va Gipuzkoa Bizkaia<br />
5,9%<br />
Fuente: E<strong>la</strong>boración propia a partir <strong>de</strong> datos <strong>de</strong> <strong>la</strong> Dirección General <strong>de</strong> Tráfico.<br />
DISTRIBUCIÓN DE ACCIDENTES MORTALES EN LAS CARRETERAS DE LA RED FUNCIONAL<br />
38,9%<br />
POR TERRITORIO HISTÓRICO.<br />
AÑO 2003<br />
Á<strong>la</strong>va Gipuzkoa Bizkaia<br />
38,9%<br />
22,2%<br />
Fuente: E<strong>la</strong>boración propia a partir <strong>de</strong> datos <strong>de</strong> <strong>la</strong> Dirección General <strong>de</strong> Tráfico.<br />
Se observa en los gráficos adjuntos que es en Á<strong>la</strong>va don<strong>de</strong> el número <strong>de</strong> acci<strong>de</strong>ntes con víctimas ocurridos<br />
en los cinco años consi<strong>de</strong>rados (1999 – 2003) es el menor <strong>de</strong> los tres Territorios Históricos y por el<br />
contrario, es en Bizkaia don<strong>de</strong> se registran el mayor número <strong>de</strong> acci<strong>de</strong>ntes con víctimas <strong>de</strong> toda <strong>la</strong><br />
Comunidad Autónoma Vasca. Tomando como referencia el último año (2003), frente a los 1.674 acci<strong>de</strong>ntes<br />
que han tenido lugar en Bizkaia, tan sólo se han registrado 475 en Á<strong>la</strong>va (siempre consi<strong>de</strong>rando que estos<br />
datos se refieren a los acci<strong>de</strong>ntes con víctimas ocurridos en <strong>la</strong>s carreteras <strong>de</strong> <strong>la</strong> Red Funcional).<br />
Por otro <strong>la</strong>do, comparando los ratios <strong>de</strong> acci<strong>de</strong>ntes con víctimas y acci<strong>de</strong>ntes mortales en cada Territorio<br />
Histórico pue<strong>de</strong> seña<strong>la</strong>rse que tanto en Á<strong>la</strong>va como en Gipuzkoa el porcentaje <strong>de</strong> acci<strong>de</strong>ntes mortales es<br />
superior al <strong>de</strong> acci<strong>de</strong>ntes con víctimas (en ambos casos, referidos al conjunto <strong>de</strong> <strong>la</strong> CAPV). Este hecho se<br />
invierte en el caso <strong>de</strong> Bizkaia, ya que mientras que el 50,4% <strong>de</strong> los acci<strong>de</strong>ntes con víctimas han ocurrido en<br />
este Territorio Histórico, tan sólo presenta el 38,9% <strong>de</strong> los acci<strong>de</strong>ntes mortales.<br />
A<strong>de</strong>más, cabe <strong>de</strong>stacar el hecho <strong>de</strong> que <strong>la</strong> acci<strong>de</strong>ntalidad ha aumentado progresivamente en los tres<br />
Territorios Históricos <strong>de</strong>s<strong>de</strong> el año 1999 hasta el año 2003: un 10,4% en Á<strong>la</strong>va, un 12,9% en Bizkaia y<br />
don<strong>de</strong> más ha crecido con un 24,1%, ha sido en Gipuzkoa, observándose, sin embargo, un estancamiento<br />
entre 2002 y 2003, que se correspon<strong>de</strong> con un <strong>de</strong>scenso en el número <strong>de</strong> acci<strong>de</strong>ntes registrados en Bizkaia.<br />
Este <strong>de</strong>scenso es más acusado en 2004, según <strong>la</strong> última información <strong>de</strong> evaluación <strong>de</strong> <strong>la</strong> acci<strong>de</strong>ntalidad a <strong>la</strong><br />
que se ha tenido acceso en el transcurso <strong>de</strong> <strong>la</strong> e<strong>la</strong>boración <strong>de</strong>l presente documento.<br />
71<br />
Revisión <strong>de</strong>l Segundo P<strong>la</strong>n General <strong>de</strong> Carreteras <strong>de</strong>l País Vasco
En este sentido, en Gipuzkoa los acci<strong>de</strong>ntes con víctimas mortales pasaron <strong>de</strong> 49 en 2003 a 33 en 2004, lo<br />
que equivale a un <strong>de</strong>scenso <strong>de</strong>l 32%. Este fuerte <strong>de</strong>scenso ha sido muy <strong>de</strong>stacable en algunas carreteras <strong>de</strong><br />
<strong>la</strong> Red Funcional. Tal es el caso <strong>de</strong> <strong>la</strong> N-I que ha visto <strong>de</strong>scen<strong>de</strong>r el número <strong>de</strong> acci<strong>de</strong>ntes con víctimas<br />
mortales <strong>de</strong> 16 en 2003 a 4 en 2004, en <strong>la</strong> GI-627 ha <strong>red</strong>ucido <strong>de</strong> 5 a 1, <strong>la</strong> GI-631 <strong>de</strong> 6 a 1, y <strong>la</strong> GI-632 <strong>de</strong> 8<br />
a 0.<br />
EVOLUCIÓN DE LA ACCIDENTALIDAD EN LAS CARRETERAS DE LA RED FUNCIONAL<br />
1.800<br />
1.600<br />
1.400<br />
1.200<br />
1.000<br />
800<br />
600<br />
400<br />
200<br />
0<br />
ACCIDENTES TOTALES 1999 - 2003<br />
1999 2000 2001 2002 2003<br />
Á<strong>la</strong>va Gipuzkoa Bizkaia<br />
Fuente: E<strong>la</strong>boración propia a partir <strong>de</strong> datos <strong>de</strong> <strong>la</strong> Dirección General <strong>de</strong> Tráfico.<br />
A pesar <strong>de</strong> ser Á<strong>la</strong>va el Territorio Histórico don<strong>de</strong> se produce el menor número <strong>de</strong> acci<strong>de</strong>ntescon víctimas, es<br />
don<strong>de</strong> el porcentaje <strong>de</strong> acci<strong>de</strong>ntes mortales respecto al total <strong>de</strong>l año consi<strong>de</strong>rado es el mayor <strong>de</strong> todos. Así,<br />
en el año 2003 <strong>de</strong> los 475 acci<strong>de</strong>ntes que han tenido lugar en dicho Territorio Histórico, el 5,9% han<br />
resultado ser mortales, mientras que en Gipuzkoa y Bizkaia este porcentaje se <strong>red</strong>uce respectivamente al<br />
4,2% y 2,9%.<br />
Al contrario <strong>de</strong> lo que ocurría con el número <strong>de</strong> acci<strong>de</strong>ntes con víctimas producidos (que aumentaban con el<br />
paso <strong>de</strong> los años), el porcentaje <strong>de</strong> acci<strong>de</strong>ntes mortales en <strong>la</strong>s carreteras <strong>de</strong> <strong>la</strong> Red Funcional disminuye en<br />
el mismo período <strong>de</strong> <strong>análisis</strong>. De modo que en Á<strong>la</strong>va, <strong>de</strong> un 11,9% <strong>de</strong> acci<strong>de</strong>ntes mortales en el año 1999,<br />
pasa a tener en el año 2003 un 5,9%. En el caso <strong>de</strong>l Territorio Histórico <strong>de</strong> Gipuzkoa, pasa <strong>de</strong> un 9,5% a un<br />
4,2% y finalmente en Bizkaia, <strong>de</strong> un 4,2% en el año 1999 se pasa a tener en el año 2003 un 2,9% <strong>de</strong><br />
acci<strong>de</strong>ntes mortales respecto <strong>de</strong>l total registrados en este Territorio.<br />
ACCIDENTES MORTALES EN LAS CARRETERAS DE LA RED FUNCIONAL<br />
12,0<br />
10,0<br />
8,0<br />
6,0<br />
4,0<br />
2,0<br />
0,0<br />
<strong>2.</strong>1.6.<strong>2.</strong> Lesividad<br />
(%)<br />
1999 2000 2001 2002 2003<br />
Á<strong>la</strong>va Gipuzkoa Bizkaia<br />
Fuente: E<strong>la</strong>boración propia a partir <strong>de</strong> datos <strong>de</strong> <strong>la</strong> Dirección General <strong>de</strong> Tráfico.<br />
A continuación se presenta <strong>la</strong> evolución <strong>de</strong>s<strong>de</strong> el año 1999 hasta el año 2003 <strong>de</strong> <strong>la</strong> lesividad, es <strong>de</strong>cir, <strong>de</strong> <strong>la</strong>s<br />
personas muertas, los heridos graves y los heridos leves en <strong>la</strong>s carreteras <strong>de</strong> <strong>la</strong> Red Funcional <strong>de</strong> cada uno<br />
<strong>de</strong> los Territorios Históricos así como <strong>de</strong> <strong>la</strong> Comunidad Autónoma <strong>de</strong>l País Vasco.<br />
72<br />
Revisión <strong>de</strong>l Segundo P<strong>la</strong>n General <strong>de</strong> Carreteras <strong>de</strong>l País Vasco
LESIVIDAD EN LAS CARRETERAS DE LA RED FUNCIONAL. PERÍODO 1999 – 2003<br />
Territorio Histórico<br />
y año<br />
Á<strong>la</strong>va<br />
Bizkaia<br />
Gipuzkoa<br />
CAPV<br />
Personas muertas Heridos graves Heridos leves Total víctimas<br />
Nº % Nº % Nº % Nº % s/CAPV<br />
1999 47 8,1 201 34,7 331 57,2 579 18,0<br />
2000 36 5,9 204 33,6 368 60,5 608 16,5<br />
2001 50 6,7 191 25,7 501 67,5 742 15,1<br />
2002 37 4,5 165 20,0 624 75,5 826 15,5<br />
2003 36 4,3 135 16,1 668 79,6 839 15,8<br />
1999 49 2,8 291 16,4 1.433 80,8 1.773 55,2<br />
2000 48 2,2 279 12,8 1.859 85,0 <strong>2.</strong>186 59,5<br />
2001 47 2,0 272 11,9 1.974 86,1 <strong>2.</strong>293 46,5<br />
2002 68 2,4 316 11,2 <strong>2.</strong>436 86,4 <strong>2.</strong>820 52,8<br />
2003 57 2,1 259 9,5 <strong>2.</strong>408 88,4 <strong>2.</strong>724 51,2<br />
1999 50 5,8 221 25,7 588 68,5 859 26,8<br />
2000 48 5,4 253 28,7 581 65,9 882 24,0<br />
2001 43 2,3 272 14,4 1.579 83,4 1.894 38,4<br />
2002 51 3,0 220 13,0 1.419 84,0 1.690 31,7<br />
2003 56 3,2 216 12,3 1.482 84,5 1.754 33,0<br />
1999 146 4,5 713 22,2 <strong>2.</strong>352 73,2 3.211 100,0<br />
2000 132 3,6 736 20,0 2808 76,4 3.676 100,0<br />
2001 140 2,8 735 14,9 4054 82,2 4.929 100,0<br />
2002 156 2,9 701 13,1 4479 83,9 5.336 100,0<br />
2003 149 2,8 610 11,5 4558 85,7 5.317 100,0<br />
Fuente: E<strong>la</strong>boración propia a partir <strong>de</strong> datos <strong>de</strong> <strong>la</strong> Dirección General <strong>de</strong> Tráfico.<br />
DISTRIBUCIÓN DE VÍCTIMAS EN LAS CARRETERAS DE LA RED FUNCIONAL<br />
51,2%<br />
AÑO 2003<br />
Á<strong>la</strong>va Gipuzkoa Bizkaia<br />
15,8%<br />
33,0%<br />
Fuente: E<strong>la</strong>boración propia a partir <strong>de</strong> datos <strong>de</strong> <strong>la</strong> Dirección General <strong>de</strong> Tráfico.<br />
El número <strong>de</strong> víctimas en <strong>la</strong>s carreteras <strong>de</strong> <strong>la</strong> Red Funcional ha crecido <strong>de</strong>s<strong>de</strong> el año 1999 hasta el año 2003<br />
en toda <strong>la</strong> Comunidad Autónoma <strong>de</strong>l País Vasco. Este crecimiento ha sido más acusado en Gipuzkoa, don<strong>de</strong><br />
<strong>la</strong> tasa <strong>de</strong> crecimiento anual acumu<strong>la</strong>do para el período <strong>de</strong> <strong>análisis</strong> ascien<strong>de</strong> al 19,5%, le sigue con una tasa<br />
<strong>de</strong>l 11,3% el Territorio Histórico <strong>de</strong> Bizkaia y finalmente con un 9,7% Á<strong>la</strong>va.<br />
Cabe seña<strong>la</strong>r, sin embargo, que en Bizkaia <strong>la</strong> ten<strong>de</strong>ncia creciente se invierte en 2003, cuando el número <strong>de</strong><br />
víctimas mortales <strong>de</strong>scien<strong>de</strong> un 16% con respecto al año anterior. En Gipuzkoa, por su parte, se observa<br />
también un cambio <strong>de</strong> ten<strong>de</strong>ncia a <strong>la</strong> baja a partir <strong>de</strong> 2004, año en que el número <strong>de</strong> acci<strong>de</strong>ntes mortales<br />
fue <strong>de</strong> 34, lo que representa un <strong>de</strong>scenso <strong>de</strong>l 39% con respecto a 2003.<br />
Por otra parte, <strong>de</strong> igual manera que el número <strong>de</strong> acci<strong>de</strong>ntes con víctimas era mayor en Bizkaia, el número<br />
<strong>de</strong> personas implicadas en los mismos es también mayor en este Territorio Histórico, resultando en el año<br />
2003 <strong>2.</strong>724 víctimas (lo que supone el 51,2% <strong>de</strong>l total <strong>de</strong> víctimas que tienen lugar en <strong>la</strong>s carreteras <strong>de</strong> <strong>la</strong><br />
Red Funcional <strong>de</strong> <strong>la</strong> CAPV). Á<strong>la</strong>va es don<strong>de</strong> este número es el menor <strong>de</strong> todos, con tan sólo 839 víctimas<br />
(15,8% respecto al total <strong>de</strong>l País Vasco).<br />
73<br />
Revisión <strong>de</strong>l Segundo P<strong>la</strong>n General <strong>de</strong> Carreteras <strong>de</strong>l País Vasco
EVOLUCIÓN DEL NÚMERO DE VÍCTIMAS EN LAS CARRETERAS DE LA RED FUNCIONAL<br />
3.000<br />
<strong>2.</strong>500<br />
<strong>2.</strong>000<br />
1.500<br />
1.000<br />
500<br />
0<br />
1999 2000 2001 2002 2003<br />
Á<strong>la</strong>va Gipuzkoa Bizkaia<br />
Fuente: E<strong>la</strong>boración propia a partir <strong>de</strong> datos <strong>de</strong> <strong>la</strong> Dirección General <strong>de</strong> Tráfico.<br />
Analizando el número <strong>de</strong> víctimas mortales, el mayor porcentaje <strong>de</strong> éstas respecto al total <strong>de</strong> víctimas en el<br />
año consi<strong>de</strong>rado se da en el Territorio Histórico <strong>de</strong> Á<strong>la</strong>va, <strong>de</strong> modo que en el año 2003 <strong>de</strong> <strong>la</strong>s 839 víctimas<br />
registradas en los 475 acci<strong>de</strong>ntes, el 4,3% <strong>de</strong> el<strong>la</strong>s han resultado ser víctimas mortales. En Gipuzkoa este<br />
porcentaje se <strong>red</strong>uce al 3,2% y por último en Bizkaia al 2,1%.<br />
La gráfica con <strong>la</strong> evolución <strong>de</strong>l número <strong>de</strong> víctimas mortales en el período <strong>de</strong> <strong>análisis</strong> (1999 – 2003) se<br />
muestra a continuación.<br />
NÚMERO DE VÍCTIMAS MORTALES EN LAS CARRETERAS DE LA RED FUNCIONAL<br />
9,0<br />
8,0<br />
7,0<br />
6,0<br />
5,0<br />
4,0<br />
3,0<br />
2,0<br />
1,0<br />
0,0<br />
1999 2000 2001 2002 2003<br />
Á<strong>la</strong>va Gipuzkoa Bizkaia<br />
Fuente: E<strong>la</strong>boración propia a partir <strong>de</strong> datos <strong>de</strong> <strong>la</strong> Dirección General <strong>de</strong> Tráfico.<br />
<strong>2.</strong>1.6.3. Tipo <strong>de</strong> acci<strong>de</strong>ntes<br />
De acuerdo con los partes que entrega Tráfico, <strong>la</strong>s causas que provocan los acci<strong>de</strong>ntes se c<strong>la</strong>sifican según<br />
siete tipologías:<br />
√ Colisión <strong>de</strong> vehículos: frontal, fronto - <strong>la</strong>teral, <strong>la</strong>teral, alcance y múltiple o en caravana.<br />
√ Colisión <strong>de</strong> vehículo – obstáculo: vehículo estacionado o averiado, val<strong>la</strong> <strong>de</strong> <strong>de</strong>fensa, barrera <strong>de</strong> paso a<br />
nivel, y otro objeto o material.<br />
√ Atropello: peatón sosteniendo bicicleta, peatón reparando vehículo, peatón ais<strong>la</strong>do o en grupo,<br />
conductor <strong>de</strong> animales, animal ais<strong>la</strong>do o rebaño y animales sueltos.<br />
√ Vuelco en calzada.<br />
√ Salidas <strong>de</strong> calzada por <strong>la</strong> <strong>de</strong>recha y por <strong>la</strong> izquierda: choque con árbol o poste, choque con murete o<br />
edificio, choque con cuneta o bordillo, otro tipo <strong>de</strong> choque, con <strong>de</strong>speñamiento, con vuelco, en l<strong>la</strong>no y<br />
otras.<br />
√ Otros.<br />
A continuación se presenta para cada uno <strong>de</strong> los Territorios Históricos <strong>la</strong> evolución <strong>de</strong> <strong>la</strong> acci<strong>de</strong>ntalidad (en<br />
número y porcentaje) en el período <strong>de</strong> <strong>análisis</strong> según su tipo, en lo re<strong>la</strong>tivo a acci<strong>de</strong>ntes con víctomas.<br />
74<br />
Revisión <strong>de</strong>l Segundo P<strong>la</strong>n General <strong>de</strong> Carreteras <strong>de</strong>l País Vasco
Territorio Histórico <strong>de</strong> Á<strong>la</strong>va<br />
ACCIDENTALIDAD SEGÚN TIPO EN LAS CARRETERAS DE LA RED FUNCIONAL 1<br />
Tipo <strong>de</strong> acci<strong>de</strong>nte<br />
Absoluto<br />
PERÍODO 1999 - 2003<br />
1999 2000 2001 2002 2003<br />
%<br />
s/total Absoluto<br />
%<br />
s/total Absoluto<br />
%<br />
s/total Absoluto<br />
%<br />
s/total Absoluto<br />
Colisión <strong>de</strong> vehículos<br />
Frontal 16 5,0 15 4,3 17 4,3 21 4,5% 11 2,3<br />
Fronto - <strong>la</strong>teral 42 13,1 54 15,4 50 12,7 56 12,0 60 12,6<br />
Lateral 11 3,4 14 4,0 16 4,1 11 2,4 15 3,2<br />
Alcance 37 11,6 46 13,1 59 15,0 60 12,8 63 13,3<br />
Múltiple o Caravana 4 1,3 7 2,0 8 2,0 14 3,0 4 0,8<br />
Colisión <strong>de</strong> vehículo – obstáculo<br />
Vehículo estacionado o<br />
averiado 1 0,3 2 0,6 1 0,3 1 0,2 0 0,0<br />
Val<strong>la</strong> <strong>de</strong> <strong>de</strong>fensa 10 3,1 3 0,9 5 1,3 11 2,4 15 3,2<br />
Barrera <strong>de</strong> paso a nivel 0 0,0 0 0,0 0 0,0 4 0,9 1 0,2<br />
Otro objeto o material 4 1,3 2 0,6 1 0,3 4 0,9 1 0,2<br />
Atropello<br />
Peatón sosteniendo<br />
bicicleta 0 0,0 0 0,0 0 0,0 0 0,0 0 0,0<br />
Peatón reparando<br />
vehículo 1 0,3 0 0,0 0 0,0 0 0,0 0 0,0<br />
Peatón ais<strong>la</strong>do o en grupo 9 2,8 5 1,4 6 1,5 7 1,5 5 1,1<br />
Conductor <strong>de</strong> animales 0 0,0 0 0,0 0 0,0 0 0,0 0 0,0<br />
Animal conducido o<br />
rebaño 0 0,0 0 0,0 0 0,0 0 0,0 0 0,0<br />
Animales sueltos 2 0,6 6 1,7 2 0,5 0 0,0 2 0,4<br />
Vuelco en calzada<br />
Vuelco en calzada 5 1,6 10 2,8 3 0,8 7 1,5 5 1,1<br />
Salida <strong>de</strong> <strong>la</strong> calzada izquierda<br />
Choque con árbol o poste 13 4,1 11 3,1 11 2,8 8 1,7 15 3,2<br />
Choque con murete o<br />
edificio 3 0,9 8 2,3 6 1,5 7 1,5 4 0,8<br />
%<br />
s/total<br />
Choque con cuneta o<br />
bordillo 20 6,3 19 5,4 30 7,6 34 7,3 48 10,1<br />
1 Cuando el valor absoluto <strong>de</strong>l número <strong>de</strong> acci<strong>de</strong>ntes no coinci<strong>de</strong> con el que figura en el Apartado <strong>2.</strong>1.6.1, se <strong>de</strong>be a que en algunos <strong>de</strong><br />
los partes a partir <strong>de</strong> los cuales se ha obtenido <strong>la</strong> base <strong>de</strong> datos empleada, no se han rellenado <strong>la</strong>s casil<strong>la</strong>s correspondientes a tipo <strong>de</strong><br />
acci<strong>de</strong>nte.<br />
Tipo <strong>de</strong> acci<strong>de</strong>nte<br />
Absoluto<br />
1999 2000 2001 2002 2003<br />
%<br />
s/total<br />
Absoluto %<br />
s/total Absoluto<br />
%<br />
s/total Absoluto<br />
%<br />
s/total<br />
75<br />
Absoluto %<br />
s/total<br />
Otro tipo <strong>de</strong> choque 12 3,8 17 4,8 23 5,9 25 5,3 27 5,7<br />
Con <strong>de</strong>speñamiento 6 1,9 5 1,4 2 0,5 5 1,1 3 0,6<br />
Con vuelco 15 4,7 20 5,7 22 5,6 31 6,6 26 5,5<br />
En l<strong>la</strong>no 0 0,0 0 0,0 0 0,0 3 0,6 2 0,4<br />
Otra 0 0,0 0 0,0 1 0,3 3 0,6 0 0,0<br />
Salida <strong>de</strong> <strong>la</strong> calzada <strong>de</strong>recha<br />
Choque con árbol o poste 8 2,5 12 3,4 14 3,6 20 4,3 18 3,8<br />
Choque con murete o<br />
edificio 9 2,8 5 1,4 8 2,0 10 2,1 5 1,1<br />
Choque con cuneta o<br />
bordillo 29 9,1 29 8,3 35 8,9 41 8,8 64 13,5<br />
Otro tipo <strong>de</strong> choque 13 4,1 13 3,7 17 4,3 17 3,6 19 4,0<br />
Con <strong>de</strong>speñamiento 1 0,3 5 1,4 2 0,5 8 1,7 6 1,3<br />
Con vuelco 25 7,8 25 7,1 34 8,7 36 7,7 30 6,3<br />
En l<strong>la</strong>no 3 0,9 2 0,6 2 0,5 1 0,2 5 1,1<br />
Otra 6 1,9 2 0,6 2 0,5 6 1,3 3 0,6<br />
Otros<br />
Otro 15 4,7 14 4,0 16 4,1 17 3,6 18 3,8<br />
Fuente: E<strong>la</strong>boración propia a partir <strong>de</strong> datos <strong>de</strong> <strong>la</strong> Dirección General <strong>de</strong> Tráfico.<br />
En el Territorio Histórico <strong>de</strong> Á<strong>la</strong>va, en todos los años consi<strong>de</strong>rados en este <strong>análisis</strong>, <strong>la</strong> causa por <strong>la</strong> que se<br />
produce el mayor número <strong>de</strong> acci<strong>de</strong>ntes en <strong>la</strong>s carreteras <strong>de</strong> <strong>la</strong> Red Funcional es por colisión <strong>de</strong> vehículos<br />
(entre el 30% y 40% <strong>de</strong> los éstos). Entre éstos <strong>de</strong>staca sobre el resto <strong>la</strong> colisión fronto - <strong>la</strong>teral y el alcance.<br />
Las salidas <strong>de</strong> calzada por <strong>la</strong> margen <strong>de</strong>recha y por <strong>la</strong> margen izquierda, representan respectivamente <strong>la</strong><br />
segunda y tercera causa <strong>de</strong> acci<strong>de</strong>ntalidad. En ambos casos, los porcentajes <strong>de</strong> acci<strong>de</strong>ntalidad varían entre<br />
el 20% y el 30% y, es el choque con cuneta o bordillo el tipo <strong>de</strong> acci<strong>de</strong>nte que mayor porcentaje representa<br />
respecto a los diferentes contemp<strong>la</strong>dos en este grupo.<br />
Estos tres tipos <strong>de</strong> acci<strong>de</strong>ntes en cada uno <strong>de</strong> los años consi<strong>de</strong>rados, registran más <strong>de</strong>l 85% <strong>de</strong> <strong>la</strong>s causas<br />
<strong>de</strong> acci<strong>de</strong>ntalidad. El resto <strong>de</strong> acci<strong>de</strong>ntes (que en ningún caso superan el 5%) se distribuyen entre colisión<br />
<strong>de</strong> vehículo – obstáculo, atropello, vuelco en calzada y otros.<br />
Revisión <strong>de</strong>l Segundo P<strong>la</strong>n General <strong>de</strong> Carreteras <strong>de</strong>l País Vasco
EVOLUCIÓN DE LA ACCIDENTALIDAD (%) SEGÚN TIPO EN LAS CARRETERAS DE LA RED<br />
FUNCIONAL<br />
45,0<br />
40,0<br />
35,0<br />
30,0<br />
25,0<br />
20,0<br />
15,0<br />
10,0<br />
5,0<br />
0,0<br />
PERÍODO 1999 – 2003<br />
1999 2000 2001 2002 2003<br />
Colisión vehículos Colisión <strong>de</strong> vehículo - Obstáculo<br />
Atropello Vuelco en calzada<br />
Salida <strong>de</strong> <strong>la</strong> calzada izquierda Salida <strong>de</strong> <strong>la</strong> calzada <strong>de</strong>recha<br />
Otros<br />
Fuente: E<strong>la</strong>boración propia a partir <strong>de</strong> datos <strong>de</strong> <strong>la</strong> Dirección General <strong>de</strong> Tráfico.<br />
En el año 2003, el porcentaje <strong>de</strong> los acci<strong>de</strong>ntes según su tipo es el que se muestra en el siguiente gráfico.<br />
Se comprueba que <strong>la</strong> colisión <strong>de</strong> vehículos y <strong>la</strong>s salidas <strong>de</strong> <strong>la</strong>s calzadas por <strong>la</strong>s márgenes <strong>de</strong>recha e izquierda<br />
son <strong>la</strong>s principales causas que provocan los acci<strong>de</strong>ntes y, que el vuelco es <strong>la</strong> razón que da lugar al menor<br />
número <strong>de</strong> acci<strong>de</strong>ntes en Á<strong>la</strong>va, con tan sólo el 1,1% <strong>de</strong> los mismos.<br />
DISTRIBUCIÓN DE TIPOLOGÍA DE ACCIDENTES EN LAS CARRETERAS DE LA RED FUNCIONAL<br />
31,6%<br />
AÑO 2003<br />
3,8%<br />
26,3%<br />
1,1%<br />
32,2%<br />
3,6%<br />
1,5%<br />
Colisión vehículos Colisión <strong>de</strong> vehículo - Obstáculo<br />
Atropello Vuelco en calzada<br />
Salida <strong>de</strong> <strong>la</strong> calzada izquierda Salida <strong>de</strong> <strong>la</strong> calzada <strong>de</strong>recha<br />
Otros<br />
Fuente: E<strong>la</strong>boración propia a partir <strong>de</strong> datos <strong>de</strong> <strong>la</strong> Dirección General <strong>de</strong> Tráfico.<br />
76<br />
Revisión <strong>de</strong>l Segundo P<strong>la</strong>n General <strong>de</strong> Carreteras <strong>de</strong>l País Vasco
Territorio Histórico <strong>de</strong> Bizkaia<br />
ACCIDENTALIDAD SEGÚN TIPO EN LAS CARRETERAS DE LA RED FUNCIONAL 1<br />
Tipo <strong>de</strong> acci<strong>de</strong>nte<br />
Colisión <strong>de</strong> vehículos<br />
PERÍODO 1999 - 2003<br />
1999 2000 2001 2002 2003<br />
Absoluto %<br />
s/total<br />
Absoluto %<br />
s/total<br />
Absoluto %<br />
s/total<br />
Absoluto %<br />
s/total<br />
Absoluto %<br />
s/total<br />
Frontal 83 8,0 90 6,6 91 6,1 86 5,9 82 5,2<br />
Fronto - <strong>la</strong>teral 200 19,4 211 15,6 218 14,7 246 16,9 238 15,2<br />
Lateral 53 5,1 83 6,1 88 5,9 83 5,7 94 6,0<br />
Alcance 218 21,1 327 24,1 332 22,4 364 25,0 407 26,0<br />
Múltiple o Caravana 54 5,2 58 4,3 68 4,6 36 2,5 58 3,7<br />
Colisión <strong>de</strong> vehículo – obstáculo<br />
Vehículo estacionado o<br />
averiado 3 0,3 4 0,3 8 0,5 3 0,2 4 0,3<br />
Val<strong>la</strong> <strong>de</strong> <strong>de</strong>fensa 40 3,9 72 5,3 122 8,2 51 3,5 64 4,1<br />
Barrera <strong>de</strong> paso a nivel 0 0,0 0 0,0 0 0,0 0 0,0 1 0,1<br />
Otro objeto o material 6 0,6 7 0,5 7 0,5 10 0,7 2 0,1<br />
Atropello<br />
Peatón sosteniendo<br />
bicicleta 2 0,2 0 0,0 0 0,0 0 0,0 1 0,1<br />
Peatón reparando<br />
vehículo 0 0,0 0 0,0 0 0,0 0 0,0 0 0,0<br />
Peatón ais<strong>la</strong>do o en grupo 41 4,0 28 2,1 31 2,1 40 2,7 40 2,6<br />
Conductor <strong>de</strong> animales 0 0,0 0 0,0 0 0,0 0 0,0 0 0,0<br />
Animal conducido o<br />
rebaño 0 0,0 0 0,0 0 0,0 0 0,0 0 0,0<br />
Animales sueltos 0 0,0 1 0,1 5 0,3 1 0,1 4 0,3<br />
Vuelco en calzada<br />
Vuelco en calzada 19 1,8 33 2,4 23 1,5 23 1,6 24 1,5<br />
Salida <strong>de</strong> <strong>la</strong> calzada izquierda<br />
Choque con árbol o poste 16 1,6 15 1,1 18 1,2 27 1,9 24 1,5<br />
Choque con murete o<br />
edificio 28 2,7 34 2,5 35 2,4 54 3,7 76 4,8<br />
Choque con cuneta o<br />
bordillo 37 3,6 33 2,4 48 3,2 35 2,4 38 2,4<br />
Otro tipo <strong>de</strong> choque 22 2,1 36 2,7 37 2,5 41 2,8 55 3,5<br />
Con <strong>de</strong>speñamiento 4 0,4 5 0,4 7 0,5 8 0,5 5 0,3<br />
Con vuelco 8 0,8 14 1,0 14 0,9 28 1,9 31 2,0<br />
Tipo <strong>de</strong> acci<strong>de</strong>nte<br />
1999 2000 2001 2002 2003<br />
Absoluto %<br />
s/total<br />
Absoluto %<br />
s/total<br />
Absoluto %<br />
s/total<br />
Absoluto %<br />
s/total<br />
77<br />
Absoluto %<br />
s/total<br />
En l<strong>la</strong>no 1 0,1 3 0,2 0 0,0 1 0,1 2 0,1<br />
Otra 3 0,3 51 3,8 2 0,1 1 0,1 3 0,2<br />
Salida <strong>de</strong> <strong>la</strong> calzada <strong>de</strong>recha<br />
Choque con árbol o poste 28 2,7 31 2,3 44 3,0 32 2,2 24 1,5<br />
Choque con murete o<br />
edificio 38 3,7 56 4,1 75 5,1 75 5,2 76 4,8<br />
Choque con cuneta o<br />
bordillo 32 3,1 34 2,5 56 3,8 45 3,1 38 2,4<br />
Otro tipo <strong>de</strong> choque 23 2,2 41 3,0 48 3,2 61 4,2 55 3,5<br />
Con <strong>de</strong>speñamiento 7 0,7 10 0,7 9 0,6 9 0,6 5 0,3<br />
Con vuelco 26 2,5 26 1,9 27 1,8 33 2,3 31 2,0<br />
En l<strong>la</strong>no 1 0,1 2 0,1 8 0,5 1 0,1 2 0,1<br />
Otra 3 0,3 5 0,4 1 0,1 4 0,3 3 0,2<br />
Otros<br />
Otro 36 3,5 46 3,4 63 4,2 57 3,9 81 5,2<br />
Fuente: E<strong>la</strong>boración propia a partir <strong>de</strong> datos <strong>de</strong> <strong>la</strong> Dirección General <strong>de</strong> Tráfico.<br />
Tal y como ha ocurrido en los dos Territorios Históricos anteriores, es <strong>la</strong> colisión <strong>de</strong> vehículos <strong>la</strong> principal<br />
causa <strong>de</strong> acci<strong>de</strong>ntalidad en Bizkaia y en <strong>la</strong>s carreteras <strong>de</strong> <strong>la</strong> Red Funcional. En este caso, el porcentaje <strong>de</strong><br />
este tipo <strong>de</strong> acci<strong>de</strong>ntes cada uno <strong>de</strong> los años consi<strong>de</strong>rados (<strong>de</strong>s<strong>de</strong> 1999 hasta 2003) es mayor que en Á<strong>la</strong>va<br />
y en Gipuzkoa, ya que <strong>la</strong> media <strong>de</strong> los cinco años supera el 55%. También, e igual que anteriormente, es <strong>la</strong><br />
colisión fronto - <strong>la</strong>teral y el alcance <strong>la</strong>s dos razones que dan lugar al mayor número <strong>de</strong> acci<strong>de</strong>ntes por<br />
colisión <strong>de</strong> vehículos.<br />
Se siguen manteniendo en segunda y tercera posición (en cuanto a <strong>la</strong> causa <strong>de</strong> acci<strong>de</strong>ntalidad en <strong>la</strong>s<br />
carreteras <strong>de</strong> <strong>la</strong> Red Funcional), <strong>la</strong>s salidas <strong>de</strong> calzada por ambos márgenes (<strong>de</strong>recho e izquierdo).<br />
Observando como aunque su evolución ha sido diferente a lo <strong>la</strong>rgo <strong>de</strong> estos cinco años, el porcentaje <strong>de</strong><br />
acci<strong>de</strong>ntes <strong>de</strong> ambas coinci<strong>de</strong> en el último año (14,9%).<br />
El vuelco <strong>de</strong> calzada se mantiene <strong>de</strong>s<strong>de</strong> el año 1999 hasta el año 2003 como <strong>la</strong> razón que menos acci<strong>de</strong>ntes<br />
provoca.<br />
Revisión <strong>de</strong>l Segundo P<strong>la</strong>n General <strong>de</strong> Carreteras <strong>de</strong>l País Vasco
EVOLUCIÓN DE LA ACCIDENTALIDAD (%) SEGÚN TIPO EN LAS CARRETERAS DE LA RED<br />
FUNCIONAL<br />
60,0<br />
55,0<br />
50,0<br />
45,0<br />
40,0<br />
35,0<br />
30,0<br />
25,0<br />
20,0<br />
15,0<br />
10,0<br />
5,0<br />
0,0<br />
PERÍODO 1999 – 2003<br />
1999 2000 2001 2002 2003<br />
Colisión vehículos Colisión <strong>de</strong> vehículo - Obstáculo<br />
Atropello Vuelco en calzada<br />
Salida <strong>de</strong> <strong>la</strong> calzada izquierda Salida <strong>de</strong> <strong>la</strong> calzada <strong>de</strong>recha<br />
Otros<br />
Fuente: E<strong>la</strong>boración propia a partir <strong>de</strong> datos <strong>de</strong> <strong>la</strong> Dirección General <strong>de</strong> Tráfico.<br />
En el año 2003, el porcentaje <strong>de</strong> los acci<strong>de</strong>ntes según su tipo es el que se muestra en el siguiente gráfico.<br />
DISTRIBUCIÓN DE TIPOLOGÍA DE ACCIDENTES EN LAS CARRETERAS DE LA RED FUNCIONAL<br />
14,9%<br />
1,5%<br />
14,9%<br />
2,9%<br />
4,5%<br />
AÑO 2003<br />
5,2%<br />
56,1%<br />
Colisión vehículos Colisión <strong>de</strong> vehículo - Obstáculo<br />
Atropello Vuelco en calzada<br />
Salida <strong>de</strong> <strong>la</strong> calzada izquierda Salida <strong>de</strong> <strong>la</strong> calzada <strong>de</strong>recha<br />
Otros<br />
Fuente: E<strong>la</strong>boración propia a partir <strong>de</strong> datos <strong>de</strong> <strong>la</strong> Dirección General <strong>de</strong> Tráfico.<br />
Territorio Histórico <strong>de</strong> Gipuzkoa<br />
Tipo <strong>de</strong> acci<strong>de</strong>nte<br />
ACCIDENTALIDAD TIPO EN LAS CARRETERAS DE LA RED FUNCIONAL 1<br />
Absoluto<br />
PERÍODO 1999 - 2003<br />
1999 2000 2001 2002 2003<br />
%<br />
s/total<br />
Absoluto %<br />
s/total Absoluto<br />
%<br />
s/total Absoluto<br />
%<br />
s/total<br />
78<br />
Absoluto %<br />
s/total<br />
Colisión <strong>de</strong> vehículos<br />
Frontal 45 9,1 51 10,6 80 6,6 64 5,7 41 4,1<br />
Fronto - <strong>la</strong>teral 115 23,3 106 22,0 163 13,4 158 14,1 124 12,3<br />
Lateral 18 3,6 16 3,3 69 5,7 52 4,6 60 5,9<br />
Alcance 50 10,1 48 10,0 238 19,5 218 19,4 198 19,6<br />
Múltiple o Caravana 8 1,6 9 1,9 41 3,4 33 2,9 33 3,3<br />
Colisión <strong>de</strong> vehículo – obstáculo<br />
Vehículo estacionado /<br />
averiado 3 0,6 0 0,0 4 0,3 4 0,4 2 0,2<br />
Val<strong>la</strong> <strong>de</strong> <strong>de</strong>fensa 6 1,2 5 1,0 26 2,1 32 2,8 44 4,4<br />
Barrera <strong>de</strong> paso a nivel 0 0,0 1 0,2 0 0,0 2 0,2 0 0,0<br />
Otro objeto o material 1 0,2 3 0,6 12 1,0 10 0,9 5 0,5<br />
Atropello<br />
Peatón sosteniendo<br />
bicicleta 0 0,0 1 0,2 0 0,0 0 0,0 1 0,1<br />
Peatón reparando<br />
vehículo 0 0,0 0 0,0 0 0,0 0 0,0 0 0,0<br />
Peatón ais<strong>la</strong>do o en grupo 37 7,5 32 6,6 32 2,6 42 3,7 27 2,7<br />
Conductor <strong>de</strong> animales 0 0,0 0 0,0 0 0,0 0 0,0 0 0,0<br />
Animal conducido o<br />
rebaño 0 0,0 0 0,0 0 0,0 0 0,0 0 0,0<br />
Animales sueltos 1 0,2 0 0,0 0,0 2 0,2 0 0,0<br />
Vuelco en calzada<br />
Vuelco en calzada 14 2,8 12 2,5 38 3,1 31 2,8 40 4,0<br />
Salida <strong>de</strong> <strong>la</strong> calzada izquierda<br />
Choque con árbol o poste 9 1,8 13 2,7 19 1,6 17 1,5 15 1,5<br />
Choque con murete o<br />
edificio 22 4,5 14 2,9 50 4,1 54 4,8 46 4,6<br />
Choque con cuneta o<br />
bordillo 8 1,6 13 2,7 41 3,4 35 3,1 37 3,7<br />
Otro tipo <strong>de</strong> choque 12 2,4 18 3,7 46 3,8 49 4,4 45 4,5<br />
Con <strong>de</strong>speñamiento 1 0,2 3 0,6 5 0,4 0 0,0 1 0,1<br />
Con vuelco 8 1,6 8 1,7 19 1,6 13 1,2 11 1,1<br />
Revisión <strong>de</strong>l Segundo P<strong>la</strong>n General <strong>de</strong> Carreteras <strong>de</strong>l País Vasco
Tipo <strong>de</strong> acci<strong>de</strong>nte<br />
Absoluto<br />
1999 2000 2001 2002 2003<br />
%<br />
s/total Absoluto<br />
%<br />
s/total Absoluto<br />
%<br />
s/total Absoluto<br />
%<br />
s/total Absoluto<br />
En l<strong>la</strong>no 0 0,0 1 0,2 8 0,7 2 0,2 1 0,1<br />
Otra 0 0,0 1 0,2 1 0,1 5 0,4 3 0,3<br />
Salida <strong>de</strong> <strong>la</strong> calzada <strong>de</strong>recha<br />
Choque con árbol o poste 2 0,4 14 2,9 28 2,3 20 1,8 18 1,8<br />
Choque con murete o<br />
edificio 30 6,1 24 5,0 54 4,4 42 3,7 49 4,9<br />
Choque con cuneta o<br />
bordillo 21 4,3 19 3,9 63 5,2 63 5,6 54 5,4<br />
Otro tipo <strong>de</strong> choque 24 4,9 27 5,6 52 4,3 54 4,8 50 5,0<br />
Con <strong>de</strong>speñamiento 7 1,4 4 0,8 12 1,0 6 0,5 8 0,8<br />
Con vuelco 13 2,6 16 3,3 33 2,7 33 2,9 36 3,6<br />
En l<strong>la</strong>no 0 0,0 1 0,2 7 0,6 5 0,4 3 0,3<br />
Otra 2 0,4 1 0,2 7 0,6 4 0,4 5 0,5<br />
Otros<br />
Otro 37 7,5 21 4,4 70 5,7 74 6,6 52 5,2<br />
Fuente: E<strong>la</strong>boración propia a partir <strong>de</strong> datos <strong>de</strong> <strong>la</strong> Dirección General <strong>de</strong> Tráfico.<br />
%<br />
s/total<br />
En el Territorio Histórico <strong>de</strong> Gipuzkoa, es <strong>la</strong> colisión <strong>de</strong> vehículos <strong>la</strong> principal razón por <strong>la</strong> que tienen lugar los<br />
acci<strong>de</strong>ntes ocurridos en <strong>la</strong> Red Funcional, siendo a<strong>de</strong>más el porcentaje <strong>de</strong> acci<strong>de</strong>ntes <strong>de</strong> este tipo muy<br />
simi<strong>la</strong>r en los cinco años consi<strong>de</strong>rados con un valor en torno al 47%. La colisión fronto - <strong>la</strong>teral y el alcance<br />
son en es grupo, <strong>la</strong>s causas que dan lugar al mayor número <strong>de</strong> acci<strong>de</strong>ntes cada año.<br />
Igual que en Á<strong>la</strong>va, <strong>la</strong> segunda y tercera razón por <strong>la</strong> que se producen los acci<strong>de</strong>ntes son <strong>la</strong>s salidas <strong>de</strong> <strong>la</strong><br />
calzada por <strong>la</strong> margen <strong>de</strong>recha y por <strong>la</strong> margen izquierda, pero se diferencia, en que el porcentaje en este<br />
caso es menor, pues si en Á<strong>la</strong>va variaba entre el 20 y el 30%, en Gipuzkoa, <strong>la</strong>s salidas <strong>de</strong> <strong>la</strong> calzada <strong>de</strong>recha<br />
están en torno al 20% y <strong>la</strong>s <strong>de</strong> <strong>la</strong> calzada izquierda en torno al 14%.<br />
Del resto <strong>de</strong> causas originarias <strong>de</strong> acci<strong>de</strong>ntes, que ningún año supera cada una <strong>de</strong> el<strong>la</strong>s el 10%, el atropello<br />
era en el año 1999 el que registraba un mayor porcentaje (7,7%), pero en el año 2003 pasa a ser <strong>la</strong> razón<br />
que menos acci<strong>de</strong>ntes provoca (2,8%)<br />
EVOLUCIÓN DE LA ACCIDENTALIDAD (%) SEGÚN TIPO EN LAS CARRETERAS DE LA RED<br />
FUNCIONAL<br />
50,0<br />
45,0<br />
40,0<br />
35,0<br />
30,0<br />
25,0<br />
20,0<br />
15,0<br />
10,0<br />
5,0<br />
0,0<br />
PERÍODO 1999 – 2003<br />
1999 2000 2001 2002 2003<br />
Colisión vehículos Colisión <strong>de</strong> vehículo - Obstáculo<br />
Atropello Vuelco en calzada<br />
Salida <strong>de</strong> <strong>la</strong> calzada izquierda Salida <strong>de</strong> <strong>la</strong> calzada <strong>de</strong>recha<br />
Otros<br />
Fuente: E<strong>la</strong>boración propia a partir <strong>de</strong> datos <strong>de</strong> <strong>la</strong> Dirección General <strong>de</strong> Tráfico.<br />
En el año 2003, el porcentaje <strong>de</strong> los acci<strong>de</strong>ntes según su tipo es el que se muestra en el siguiente gráfico.<br />
DISTRIBUCIÓN DE TIPOLOGÍA DE ACCIDENTES EN LAS CARRETERAS DE LA RED FUNCIONAL<br />
22,1%<br />
15,8%<br />
AÑO 2003<br />
5,2%<br />
4,0% 2,8% 5,1%<br />
45,2%<br />
Colisión vehículos Colisión <strong>de</strong> vehículo - Obstáculo<br />
Atropello Vuelco en calzada<br />
Salida <strong>de</strong> <strong>la</strong> calzada izquierda Salida <strong>de</strong> <strong>la</strong> calzada <strong>de</strong>recha<br />
Otros<br />
Fuente: E<strong>la</strong>boración propia a partir <strong>de</strong> datos <strong>de</strong> <strong>la</strong> Dirección General <strong>de</strong> Tráfico.<br />
79<br />
Revisión <strong>de</strong>l Segundo P<strong>la</strong>n General <strong>de</strong> Carreteras <strong>de</strong>l País Vasco
A continuación se presenta una tab<strong>la</strong> resumen <strong>de</strong> los tipos <strong>de</strong> acci<strong>de</strong>ntes que han tenido lugar en el período<br />
1999 – 2003 en <strong>la</strong>s carreteras <strong>de</strong> <strong>la</strong> Red Funcional <strong>de</strong> los tres Territorios Históricos.<br />
RESUMEN DE LA ACCIDENTALIDAD SEGÚN TIPO EN LAS CARRETERAS DE LA RED FUNCIONAL 1<br />
PERÍODO 1999 - 2003<br />
Tipo <strong>de</strong> acci<strong>de</strong>nte<br />
1999 2000 2001 2002 2003<br />
Absoluto % Absoluto % Absoluto % Absoluto % Absoluto %<br />
Á<strong>la</strong>va<br />
Colisión <strong>de</strong> vehículos 110 34,4 136 38,7 150 38,2 162 34,6 153 32,2<br />
Colisión <strong>de</strong> vehículo –<br />
obstáculo 15 4,7 7 2,0 7 1,8 20 4,3 17 3,6<br />
Atropello 12 3,8 11 3,1 8 2,0 7 1,5 7 1,5<br />
Vuelco en Calzada 5 1,6 10 2,8 3 0,8 7 1,5 5 1,1<br />
Salida <strong>de</strong> <strong>la</strong> calzada <strong>de</strong>recha 69 21,6 80 22,8 95 24,2 116 24,8 125 26,3<br />
Salida <strong>de</strong> <strong>la</strong> calzada<br />
izquierda 94 29,4 93 26,5 114 29,0 139 29,7 150 31,6<br />
Otros 15 4,7 14 4,0 16 4,1 17 3,6 18 3,8<br />
Bizkaia<br />
Colisión <strong>de</strong> vehículos 608 58,9 769 56,7 797 53,7 815 56,0 879 56,1<br />
Colisión <strong>de</strong> vehículo –<br />
obstáculo 49 4,7 83 6,1 137 9,2 64 4,4 71 4,5<br />
Atropello 43 4,2 29 2,1 36 2,4 41 2,8 45 2,9<br />
Vuelco en Calzada 19 1,8 33 2,4 23 1,5 23 1,6 24 1,5<br />
Salida <strong>de</strong> <strong>la</strong> calzada <strong>de</strong>recha 119 11,5 191 14,1 161 10,8 195 13,4 234 14,9<br />
Salida <strong>de</strong> <strong>la</strong> calzada<br />
izquierda 158 15,3 205 15,1 268 18,0 260 17,9 234 14,9<br />
Otros 36 3,5 46 3,4 63 4,2 57 3,9 81 5,2<br />
Gipuzkoa<br />
Colisión <strong>de</strong> vehículos 236 47,8 230 47,7 591 48,5 525 46,7 456 45,2<br />
Colisión <strong>de</strong> vehículo –<br />
obstáculo 10 2,0 9 1,9 42 3,4 48 4,3 51 5,1<br />
Atropello 38 7,7 33 6,8 32 2,6 44 3,9 28 2,8<br />
Vuelco en Calzada 14 2,8 12 2,5 38 3,1 31 2,8 40 4,0<br />
Salida <strong>de</strong> <strong>la</strong> calzada <strong>de</strong>recha 60 12,1 71 14,7 189 15,5 175 15,6 159 15,8<br />
Salida <strong>de</strong> <strong>la</strong> calzada<br />
izquierda 99 20,0 106 22,0 256 21,0 227 20,2 223 22,1<br />
Otros 37 7,5 21 4,4 70 5,7 74 6,6 52 5,2<br />
Fuente: E<strong>la</strong>boración propia a partir <strong>de</strong> datos <strong>de</strong> <strong>la</strong> Dirección General <strong>de</strong> Tráfico.<br />
<strong>2.</strong>1.6.4. Luminosidad<br />
La distribución <strong>de</strong> los acci<strong>de</strong>ntes con víctimas entre el período diurno y nocturno es <strong>la</strong> que se muestra en <strong>la</strong><br />
tab<strong>la</strong> adjunta. Entendiendo como “Día” <strong>la</strong>s situaciones <strong>de</strong> pleno día o crepúsculo; y entendiendo como<br />
“Noche” los periodos <strong>de</strong> luminosidad insuficiente, iluminación insuficiente o carencia <strong>de</strong> iluminación.<br />
ACCIDENTALIDAD SEGÚN LA LUMINOSIDAD EXISTENTE EN LAS CARRETERAS DE LA RED<br />
FUNCIONAL<br />
PERÍODO 1999 - 2003<br />
Luminosidad<br />
1999 2000 2001 2002 2003<br />
Absoluto % Absoluto % Absoluto % Absoluto % Absoluto %<br />
Á<strong>la</strong>va<br />
Día 225 70,3 248 71,3 273 69,5 327 69,9 346 72,8<br />
Noche<br />
Bizkaia<br />
95 29,7 100 28,7 120 30,5 141 30,1 129 27,2<br />
Día 702 68,0 866 66,1 1.007 67,8 1.016 69,8 1.105 68,3<br />
Noche 330 32,0 444 33,9 478 32,2 439 30,2 514 31,7<br />
Gipuzkoa<br />
Día 327 66,2 293 60,9 883 72,5 796 70,8 713 70,7<br />
Noche 167 33,8 189 39,2 335 27,5 328 29,2 296 29,3<br />
CAPV<br />
Día 1.254 67,9 1.407 65,7 <strong>2.</strong>163 69,9 <strong>2.</strong>139 70,2 <strong>2.</strong>164 69,7<br />
Noche 592 32,1 733 34,3 933 30,1 908 29,8 939 30,3<br />
Fuente: E<strong>la</strong>boración propia a partir <strong>de</strong> datos <strong>de</strong> <strong>la</strong> Dirección General <strong>de</strong> Tráfico.<br />
En los tres Territorios Históricos y a lo <strong>la</strong>rgo <strong>de</strong> los cinco años <strong>de</strong>l período <strong>de</strong> <strong>análisis</strong> (1999 – 2003), el<br />
porcentaje <strong>de</strong> acci<strong>de</strong>ntes con víctimas en el período diurno es mayor que el <strong>de</strong>l período nocturno. Este<br />
porcentaje <strong>de</strong> acci<strong>de</strong>ntes se ha mantenido prácticamente constante en Á<strong>la</strong>va y Bizkaia, no así en Gipuzkoa<br />
don<strong>de</strong> en el año 2000 se produjo un <strong>de</strong>crecimiento <strong>de</strong> los acci<strong>de</strong>ntes diurnos, para al año siguiente crecer y<br />
ser el 2001 el año que ha registrado el mayor porcentaje <strong>de</strong> acci<strong>de</strong>ntes durante el día en este Territorio<br />
Histórico.<br />
80<br />
Revisión <strong>de</strong>l Segundo P<strong>la</strong>n General <strong>de</strong> Carreteras <strong>de</strong>l País Vasco
DISTRIBUCIÓN DE ACCIDENTES SEGÚN LA LUMINOSIDAD EN LAS CARRETERAS DE LA RED<br />
FUNCIONAL<br />
75,0<br />
70,0<br />
65,0<br />
60,0<br />
55,0<br />
50,0<br />
45,0<br />
40,0<br />
35,0<br />
30,0<br />
25,0<br />
PERÍODO 1999 - 2003<br />
1999 2000 2001 2002 2003<br />
Á<strong>la</strong>va diurnos Á<strong>la</strong>va nocturnos Gipuzkoa diurnos<br />
Gipuzkoa nocturnos Bizkaia diurnos Bizkaia nocturnos<br />
Fuente: E<strong>la</strong>boración propia a partir <strong>de</strong> datos <strong>de</strong> <strong>la</strong> Dirección General <strong>de</strong> Tráfico.<br />
Con objeto <strong>de</strong> apreciar mejor los acci<strong>de</strong>ntes diurnos y nocturnos, se presentan <strong>la</strong>s dos gráficas siguientes.<br />
Observando que en ninguno <strong>de</strong> los tres Territorios Históricos, el porcentaje <strong>de</strong> acci<strong>de</strong>ntes con víctimas que<br />
han tenido lugar a lo <strong>la</strong>rgo <strong>de</strong> <strong>la</strong> noche supera el 40%.<br />
ACCIDENTES DIURNOS EN LAS CARRETERAS DE LA RED FUNCIONAL<br />
74,0<br />
72,0<br />
70,0<br />
68,0<br />
66,0<br />
64,0<br />
62,0<br />
60,0<br />
58,0<br />
56,0<br />
54,0<br />
AÑO 2003<br />
1999 2000 2001 2002 2003<br />
Á<strong>la</strong>va diurnos Gipuzkoa diurnos Bizkaia diurnos<br />
Fuente: E<strong>la</strong>boración propia a partir <strong>de</strong> datos <strong>de</strong> <strong>la</strong> Dirección General <strong>de</strong> Tráfico.<br />
ACCIDENTES NOCTURNOS EN LAS CARRETERAS DE LA RED FUNCIONAL<br />
40,0<br />
35,0<br />
30,0<br />
25,0<br />
20,0<br />
15,0<br />
10,0<br />
5,0<br />
0,0<br />
AÑO 2003<br />
1999 2000 2001 2002 2003<br />
Á<strong>la</strong>va nocturnos Gipuzkoa nocturnos Bizkaia nocturnos<br />
Fuente: E<strong>la</strong>boración propia a partir <strong>de</strong> datos <strong>de</strong> <strong>la</strong> Dirección General <strong>de</strong> Tráfico.<br />
81<br />
Revisión <strong>de</strong>l Segundo P<strong>la</strong>n General <strong>de</strong> Carreteras <strong>de</strong>l País Vasco
<strong>2.</strong>1.6.5. Factores atmosféricos<br />
Las condiciones meteorológicas influyen en <strong>la</strong> distribución temporal <strong>de</strong> los acci<strong>de</strong>ntes. La mayoría <strong>de</strong> los<br />
acci<strong>de</strong>ntes con víctimas que se han producido a lo <strong>la</strong>rgo <strong>de</strong>l período <strong>de</strong> <strong>análisis</strong> (1999 – 2003), y en <strong>la</strong>s<br />
carreteras que constituyen <strong>la</strong> Red Funcional, han tenido lugar en condiciones <strong>de</strong> buen tiempo. Resulta<br />
relevante que en <strong>la</strong>s situaciones <strong>de</strong> condiciones climáticas más adversas, el número <strong>de</strong> acci<strong>de</strong>ntes disminuye<br />
en todos los Territorios Históricos respecto a <strong>la</strong> <strong>situación</strong> <strong>de</strong> buen tiempo (don<strong>de</strong> resulta lógico pensar que<br />
<strong>la</strong>s condiciones <strong>de</strong> conducción son más a<strong>de</strong>cuadas).<br />
ACCIDENTALIDAD SEGÚN CONDICIÓN METEOROLÓGICA EN LAS CARRETERAS DE LA RED<br />
FUNCIONAL<br />
PERÍODO 1999 - 2003<br />
Tipo <strong>de</strong> acci<strong>de</strong>nte<br />
Á<strong>la</strong>va<br />
1999<br />
Absoluto %<br />
2000<br />
Absoluto %<br />
2001<br />
Absoluto %<br />
2002<br />
Absoluto %<br />
2003<br />
Absoluto %<br />
Buen tiempo 211 65,9 239 68,7 266 67,7 284 60,7 307 64,6<br />
Nieb<strong>la</strong> Intensa 6 1,9 2 0,6 6 1,5 10 2,1 1 0,2<br />
Nieb<strong>la</strong> Ligera 3 0,9 5 1,4 3 0,8 3 0,6 7 1,5<br />
Lloviznando 53 16,6 53 15,2 55 14,0 108 23,1 109 22,9<br />
Lluvia fuerte 19 5,9 22 6,3 22 5,6 38 8,1 28 5,9<br />
Granizando 0 0,0 0 0,0 2 0,5 10 2,1 1 0,2<br />
Nevando 8 2,5 3 0,9 14 3,6 2 0,4 7 1,5<br />
Viento fuerte 7 2,2 4 1,1 6 1,5 3 0,6 6 1,3<br />
Otro 13 4,1 20 5,7 19 4,8 10 2,1 9 1,9<br />
Bizkaia<br />
Buen tiempo 649 62,9 823 62,8 929 62,6 875 60,1 981 60,6<br />
Nieb<strong>la</strong> Intensa 4 0,4 5 0,4 3 0,2 1 0,1 1 0,1<br />
Nieb<strong>la</strong> Ligera 2 0,2 8 0,6 8 0,5 2 0,1 8 0,5<br />
Lloviznando 256 24,8 317 24,2 335 22,6 387 26,6 461 28,5<br />
Lluvia fuerte 67 6,5 103 7,9 126 8,5 119 8,2 87 5,4<br />
Granizando 7 0,7 1 0,1 6 0,4 1 0,1 3 0,2<br />
Nevando 6 0,6 0 0,0 3 0,2 0 0,0 2 0,1<br />
Viento fuerte 3 0,3 18 1,4 10 0,7 13 0,9 9 0,6<br />
Otro 38 3,7 35 2,7 65 4,4 57 3,9 67 4,1<br />
Gipuzkoa<br />
Buen tiempo 294 59,5 260 53,9 708 58,1 592 52,7 543 53,8<br />
Nieb<strong>la</strong> Intensa 1 0,2 1 0,2 2 0,2 2 0,2 2 0,2<br />
Nieb<strong>la</strong> Ligera 4 0,8 3 0,6 5 0,4 9 0,8 5 0,5<br />
Lloviznando 131 26,5 160 33,2 353 29,0 376 33,5 334 33,1<br />
Lluvia fuerte 29 5,9 40 8,3 97 8,0 114 10,1 73 7,2<br />
Granizando 0 0,0 3 0,6 5 0,4 5 0,4 9 0,9<br />
Nevando 5 1,0 0 0,0 3 0,2 0 0,0 6 0,6<br />
Viento fuerte 3 0,6 0 0,0 4 0,3 3 0,3 2 0,2<br />
Otro 27 5,5 15 3,1 41 3,4 23 2,0 35 3,5<br />
Fuente: E<strong>la</strong>boración propia a partir <strong>de</strong> datos <strong>de</strong> <strong>la</strong> Dirección General <strong>de</strong> Tráfico.<br />
Des<strong>de</strong> el año 1999 hasta el año 2003, tal y como se citaba anteriormente, <strong>la</strong> mayoría <strong>de</strong> los acci<strong>de</strong>ntes con<br />
víctimas han tenido lugar con buen tiempo. En el siguiente gráfico se observa el porcentaje <strong>de</strong><br />
acci<strong>de</strong>ntalidad para cada Territorio Histórico y para el año 2003. Los acci<strong>de</strong>ntes con víctimas que han tenido<br />
lugar con buen tiempo superan en Á<strong>la</strong>va y Bizkaia el 60% <strong>de</strong>l total <strong>de</strong> acci<strong>de</strong>ntes que tienen lugar en cada<br />
uno <strong>de</strong> los dos Territorios Históricos. En Gipuzkoa, este porcentaje es <strong>de</strong>l 54%, que aunque menor sigue<br />
suponiendo más <strong>de</strong> <strong>la</strong> mitad <strong>de</strong> los acci<strong>de</strong>ntes.<br />
La siguiente <strong>situación</strong> meteorológica en <strong>la</strong> que concurren un gran número <strong>de</strong> acci<strong>de</strong>ntes, es <strong>la</strong> lluvia ligera,<br />
en este caso es en Gipuzkoa don<strong>de</strong> el número <strong>de</strong> acci<strong>de</strong>ntes con vítimas bajo esta <strong>situación</strong> atmosférica es<br />
mayor que en el resto <strong>de</strong> Territorios Históricos, superando el 33% <strong>de</strong> los que han tenido lugar en el año<br />
2003 y en <strong>la</strong>s carreteras <strong>de</strong> <strong>la</strong> Red Funcional <strong>de</strong> Gipuzkoa.<br />
Bajo <strong>la</strong>s condiciones <strong>de</strong> lluvia intensa y granizo (dos <strong>de</strong> <strong>la</strong>s perores situaciones atmosféricas para <strong>la</strong><br />
conducción), el porcentaje <strong>de</strong> acci<strong>de</strong>ntes con víctimas es mínimo, tanto en Á<strong>la</strong>va como en Gipuzkoa y<br />
Bizkaia. Los porcentajes <strong>de</strong> acci<strong>de</strong>ntes en estas condiciones no superan en ningún caso el 1%.<br />
ACCIDENTES CON VÍCTIMAS (%) SEGÚN CONDICIONES METEOROLÓGICAS EN LAS<br />
CARRETERAS DE LA RED FUNCIONAL<br />
70,0<br />
60,0<br />
50,0<br />
40,0<br />
30,0<br />
20,0<br />
10,0<br />
0,0<br />
Buen<br />
Tiempo<br />
Nieb<strong>la</strong><br />
Intensa<br />
Nieb<strong>la</strong><br />
Ligera<br />
AÑO 2003<br />
Lloviznando<br />
Lluvia<br />
Fuerte<br />
Granizando<br />
Á<strong>la</strong>va Gipuzkoa Bizkaia<br />
Nevando<br />
Viento<br />
Fuerte<br />
Fuente: E<strong>la</strong>boración propia a partir <strong>de</strong> datos <strong>de</strong> <strong>la</strong> Dirección General <strong>de</strong> Tráfico.<br />
Otro<br />
82<br />
Revisión <strong>de</strong>l Segundo P<strong>la</strong>n General <strong>de</strong> Carreteras <strong>de</strong>l País Vasco
En el conjunto <strong>de</strong> <strong>la</strong>s carreteras <strong>de</strong> <strong>la</strong> Red Funcional <strong>de</strong> País Vasco, más <strong>de</strong> <strong>la</strong> mitad <strong>de</strong> los acci<strong>de</strong>ntes con<br />
víctimas (59%) se han producido en <strong>la</strong>s mejores condiciones <strong>de</strong> circu<strong>la</strong>ción, que es con buen tiempo, le<br />
sigue con el 29,1% <strong>de</strong> los acci<strong>de</strong>ntes <strong>la</strong> lluvia ligera y con el 6,1% <strong>la</strong> lluvia intensa.<br />
DISTRIBUCIÓN DE ACCIDENTES CON VÍCTIMAS SEGÚN CONDICIONES METEOROLÓGICAS EN<br />
LAS CARRETERAS DE LA RED FUNCIONAL DE LA CAPV<br />
29,1%<br />
0,6%<br />
0,4%<br />
6,1%<br />
AÑO 2003<br />
0,5%<br />
0,5%<br />
0,1%<br />
3,6%<br />
59,0%<br />
Buen Tiempo Nieb<strong>la</strong> Intensa Nieb<strong>la</strong> Ligera Lloviznando Lluvia Fuerte<br />
Granizando Nevando Viento Fuerte Otro<br />
<strong>2.</strong>1.6.6. Acci<strong>de</strong>ntalidad mensual<br />
Fuente: E<strong>la</strong>boración propia a partir <strong>de</strong> datos <strong>de</strong> <strong>la</strong> Dirección General <strong>de</strong> Tráfico.<br />
En el período <strong>de</strong> <strong>análisis</strong> (1999 – 2003), <strong>la</strong> acci<strong>de</strong>ntalidad (referida a los acci<strong>de</strong>ntes con víctimas) a lo <strong>la</strong>rgo<br />
<strong>de</strong> los meses en cada uno <strong>de</strong> los años y en los Territorios Históricos ha sido muy diferente. En <strong>la</strong> siguiente<br />
tab<strong>la</strong> se muestra dicha evolución, así como el porcentaje que los acci<strong>de</strong>ntes en un mes representan respecto<br />
al total <strong>de</strong> los producidos en ese año.<br />
83<br />
Revisión <strong>de</strong>l Segundo P<strong>la</strong>n General <strong>de</strong> Carreteras <strong>de</strong>l País Vasco
Mes<br />
1999 2000 2001 2002 2003<br />
Absoluto % Absoluto % Absoluto % Absoluto % Absoluto %<br />
Á<strong>la</strong>va<br />
Enero 19 5,9 30 8,6 20 5,1 30 6,4 25 5,3<br />
Febrero 27 8,4 27 7,8 17 4,3 19 4,1 24 5,1<br />
Marzo 33 10,3 27 7,8 24 6,1 32 6,8 38 8,0<br />
Abril 30 9,4 37 10,6 22 5,6 36 7,7 23 4,8<br />
Mayo 28 8,8 34 9,8 24 6,1 34 7,3 34 7,2<br />
Junio 27 8,4 29 8,3 55 14,0 43 9,2 52 10,9<br />
Julio 27 8,4 31 8,9 41 10,4 47 10,0 36 7,6<br />
Agosto 22 6,9 29 8,3 46 11,7 53 11,3 56 11,8<br />
Septiembre 22 6,9 27 7,8 33 8,4 39 8,3 46 9,7<br />
Octubre 21 6,6 34 9,8 30 7,6 34 7,3 59 12,4<br />
Noviembre 29 9,1 15 4,3 36 9,2 48 10,3 39 8,2<br />
Diciembre 35 10,9 28 8,0 45 11,5 53 11,3 43 9,1<br />
Bizkaia<br />
Enero 77 7,5 88 6,7 126 8,5 98 6,7 129 8,0<br />
Febrero 79 7,7 77 5,9 96 6,5 99 6,8 114 7,0<br />
Marzo 70 6,8 95 7,3 126 8,5 101 6,9 149 9,2<br />
Abril 88 8,5 92 7,0 116 7,8 108 7,4 104 6,4<br />
Mayo 89 8,6 90 6,9 108 7,3 118 8,1 139 8,6<br />
Junio 96 9,3 140 10,7 141 9,5 170 11,7 103 6,4<br />
Julio 111 10,8 151 11,5 153 10,3 152 10,4 132 8,2<br />
Agosto 66 6,4 97 7,4 105 7,1 108 7,4 131 8,1<br />
Septiembre 102 9,9 107 8,2 130 8,8 93 6,4 143 8,8<br />
Octubre 82 7,9 127 9,7 126 8,5 130 8,9 157 9,7<br />
Noviembre 83 8,0 125 9,5 126 8,5 134 9,2 153 9,5<br />
Diciembre 89 8,6 121 9,2 132 8,9 144 9,9 165 10,2<br />
Gipuzkoa<br />
Enero 32 6,5 39 8,1 103 8,5 70 6,2 85 8,4<br />
Febrero 46 9,3 43 8,9 97 8,0 68 6,0 52 5,2<br />
Marzo 56 11,3 29 6,0 91 7,5 68 6,0 78 7,7<br />
Abril 45 9,1 41 8,5 108 8,9 110 9,8 67 6,6<br />
ACCIDENTALIDAD SEGÚN MES EN LAS CARRETERAS DE LA RED FUNCIONAL<br />
PERÍODO 1999 – 2003<br />
Mes<br />
1999 2000 2001 2002 2003<br />
Absoluto % Absoluto % Absoluto % Absoluto % Absoluto %<br />
Mayo 47 9,5 37 7,7 106 8,7 108 9,6 86 8,5<br />
Junio 53 10,7 48 10,0 124 10,2 93 8,3 81 8,0<br />
Julio 38 7,7 56 11,6 146 12,0 109 9,7 87 8,6<br />
Agosto 32 6,5 37 7,7 74 6,1 111 9,9 81 8,0<br />
Septiembre 39 7,9 34 7,1 121 9,9 81 7,2 110 10,9<br />
Octubre 36 7,3 38 7,9 88 7,2 105 9,3 99 9,8<br />
Noviembre 41 8,3 45 9,3 85 7,0 92 8,2 84 8,3<br />
Diciembre 29 5,9 35 7,3 75 6,2 109 9,7 99 9,8<br />
CAPV<br />
Enero 128 6,9 157 7,3 249 8,0 198 6,5 239 7,7<br />
Febrero 152 8,2 147 6,9 210 6,8 186 6,1 190 6,1<br />
Marzo 159 8,6 151 7,1 241 7,8 201 6,6 265 8,5<br />
Abril 163 8,8 170 7,9 246 7,9 254 8,3 194 6,3<br />
Mayo 164 8,9 161 7,5 238 7,7 260 8,5 259 8,3<br />
Junio 176 9,5 217 10,1 320 10,3 306 10,0 236 7,6<br />
Julio 176 9,5 238 11,1 340 11,0 308 10,1 255 8,2<br />
Agosto 120 6,5 163 7,6 225 7,3 272 8,9 268 8,6<br />
Septiembre 163 8,8 168 7,9 284 9,2 213 7,0 299 9,6<br />
Octubre 139 7,5 199 9,3 244 7,9 269 8,8 315 10,2<br />
Noviembre 153 8,3 185 8,6 247 8,0 274 9,0 276 8,9<br />
Diciembre 153 8,3 184 8,6 252 8,1 306 10,0 307 9,9<br />
Fuente: E<strong>la</strong>boración propia a partir <strong>de</strong> datos <strong>de</strong> <strong>la</strong> Dirección General <strong>de</strong> Tráfico.<br />
En <strong>la</strong>s siguientes gráficas se presenta <strong>la</strong> evolución <strong>de</strong> <strong>la</strong> acci<strong>de</strong>ntalidad <strong>de</strong>s<strong>de</strong> el año 1999 y hasta el año<br />
2003 para cada uno <strong>de</strong> sus meses en Á<strong>la</strong>va, Bizkaia y Gipuzkoa (expresado en tanto por ciento).<br />
84<br />
Revisión <strong>de</strong>l Segundo P<strong>la</strong>n General <strong>de</strong> Carreteras <strong>de</strong>l País Vasco
ACCIDENTES CON VÍCTIMAS SEGÚN MES EN LAS CARRETERAS DE LA RED FUNCIONAL DE<br />
ÁLAVA<br />
15,0<br />
14,0<br />
13,0<br />
12,0<br />
11,0<br />
10,0<br />
9,0<br />
8,0<br />
7,0<br />
6,0<br />
5,0<br />
4,0<br />
3,0<br />
(%)<br />
Ene. Feb. Mar. Abr. May. Jun. Jul. Ago. Sep. Oct. Nov. Dic.<br />
1999 2000 2001 2002 2003<br />
Fuente: E<strong>la</strong>boración propia a partir <strong>de</strong> datos <strong>de</strong> <strong>la</strong> Dirección General <strong>de</strong> Tráfico.<br />
ACCIDENTES CON VÍCTIMAS SEGÚN MES EN LAS CARRETERAS DE LA RED FUNCIONAL DE<br />
BIZKAIA<br />
12,0<br />
11,0<br />
10,0<br />
9,0<br />
8,0<br />
7,0<br />
6,0<br />
5,0<br />
(%)<br />
Ene. Feb. Mar. Abr. May. Jun. Jul. Ago. Sep. Oct. Nov. Dic.<br />
1999 2000 2001 2002 2003<br />
Fuente: E<strong>la</strong>boración propia a partir <strong>de</strong> datos <strong>de</strong> <strong>la</strong> Dirección General <strong>de</strong> Tráfico.<br />
85<br />
Revisión <strong>de</strong>l Segundo P<strong>la</strong>n General <strong>de</strong> Carreteras <strong>de</strong>l País Vasco
ACCIDENTES CON VÍCTIMAS SEGÚN MES EN LAS CARRETERAS DE LA RED FUNCIONAL DE<br />
GIPUZKOA<br />
13,0<br />
12,0<br />
11,0<br />
10,0<br />
9,0<br />
8,0<br />
7,0<br />
6,0<br />
5,0<br />
4,0<br />
(%)<br />
Ene. Feb. Mar. Abr. May. Jun. Jul. Ago. Sep. Oct. Nov. Dic.<br />
1999 2000 2001 2002 2003<br />
Fuente: E<strong>la</strong>boración propia a partir <strong>de</strong> datos <strong>de</strong> <strong>la</strong> Dirección General <strong>de</strong> Tráfico.<br />
Tomando como referencia el año 2003 y tal y como se observa en <strong>la</strong> gráfica adjunta, el Territorio Histórico<br />
<strong>de</strong> Á<strong>la</strong>va registra los mayores índices <strong>de</strong> acci<strong>de</strong>ntalidad en los meses <strong>de</strong> junio, agosto y octubre con<br />
porcentajes respectivos <strong>de</strong>l 10,9%, 11,8% y 12,4%, y los índices más bajos en los meses <strong>de</strong> enero (5,3%),<br />
febrero (5,1%) y abril (8%).<br />
En Gipuzkoa, con un porcentaje <strong>de</strong>l 10,9% es el mes <strong>de</strong> septiembre el que concentra el mayor número <strong>de</strong><br />
acci<strong>de</strong>ntes y febrero el mes en el que se producen el menor número, registrándose tan sólo el 5,2% <strong>de</strong><br />
todos los ocurridos en este Territorio Histórico.<br />
Finalmente, Bizkaia es el Territorio don<strong>de</strong> <strong>la</strong>s variaciones <strong>de</strong> un mes respecto a otro son <strong>la</strong>s menos<br />
significativas, <strong>de</strong>stacando diciembre con el 10,2% <strong>de</strong> los acci<strong>de</strong>ntes y abril y junio con el 6,4% <strong>de</strong> los<br />
mismos.<br />
ACCIDENTES SEGÚN MES EN LAS CARRETERAS DE LA RED FUNCIONAL POR TERRITORIO<br />
HISTÓRICO<br />
14,0<br />
12,0<br />
10,0<br />
8,0<br />
6,0<br />
4,0<br />
2,0<br />
0,0<br />
AÑO 2003<br />
Ene. Feb. Mar. Abr. May. Jun. Jul. Ago. Sep. Oct. Nov. Dic.<br />
Á<strong>la</strong>va Gipuzkoa Bizkaia<br />
Fuente: E<strong>la</strong>boración propia a partir <strong>de</strong> datos <strong>de</strong> <strong>la</strong> Dirección General <strong>de</strong> Tráfico.<br />
Analizando <strong>la</strong> acci<strong>de</strong>ntalidad no ya por Territorio Histórico sino en el conjunto <strong>de</strong> <strong>la</strong> Comunidad Autónoma<br />
Vasca, son los meses <strong>de</strong> febrero y abril aquellos en los que tienen lugar el menor número <strong>de</strong> acci<strong>de</strong>ntes con<br />
porcentajes en el año 2003 en torno al 6%. Y es el mes <strong>de</strong> octubre <strong>de</strong>l mismo año aquel en el que <strong>la</strong><br />
acci<strong>de</strong>ntalidad ha sido mayor (10,2%).<br />
86<br />
Revisión <strong>de</strong>l Segundo P<strong>la</strong>n General <strong>de</strong> Carreteras <strong>de</strong>l País Vasco
ACCIDENTES SEGÚN MES EN LAS CARRETERAS DE LA RED FUNCIONAL DE LA CAPV<br />
12,0<br />
10,0<br />
8,0<br />
6,0<br />
4,0<br />
2,0<br />
0,0<br />
AÑO 2003<br />
Ene. Feb. Mar. Abr. May. Jun. Jul. Ago. Sep. Oct. Nov. Dic.<br />
Fuente: E<strong>la</strong>boración propia a partir <strong>de</strong> datos <strong>de</strong> <strong>la</strong> Dirección General <strong>de</strong> Tráfico.<br />
<strong>2.</strong>1.6.7. Acci<strong>de</strong>ntes en <strong>la</strong>s carreteras <strong>de</strong> <strong>la</strong> Red Funcional<br />
En <strong>la</strong>s tab<strong>la</strong>s adjuntas se presenta <strong>la</strong> acci<strong>de</strong>ntalidad (número <strong>de</strong> acci<strong>de</strong>ntes con víctimas y número <strong>de</strong><br />
acci<strong>de</strong>ntes mortales) y <strong>la</strong> lesividad (muertos, heridos leves y graves) <strong>de</strong> <strong>la</strong>s carreteras <strong>de</strong> <strong>la</strong> Red Funcional <strong>de</strong><br />
los tres Territorios Históricos <strong>de</strong>l País Vasco, <strong>de</strong>s<strong>de</strong> el año 1999 hasta el año 2003, según los datos<br />
facilitados por <strong>la</strong> Dirección General <strong>de</strong> Tráfico. Las carreteras que no figuran en dichas tab<strong>la</strong>s no han tenido<br />
ningún acci<strong>de</strong>nte con víctimas en el citado período.<br />
87<br />
Revisión <strong>de</strong>l Segundo P<strong>la</strong>n General <strong>de</strong> Carreteras <strong>de</strong>l País Vasco
Carretera<br />
Acci<strong>de</strong>ntes<br />
con Víctimas<br />
Acci<strong>de</strong>ntes<br />
Mortales<br />
Muertos<br />
Heridos<br />
Leves<br />
ACCIDENTALIDAD Y LESIVIDAD EN LAS CARRETERAS DE LA RED FUNCIONAL<br />
Heridos<br />
Graves<br />
Total<br />
Víctimas<br />
Red <strong>de</strong> Interés Preferente<br />
Á<strong>la</strong>va<br />
AP-1 2 0 0 0 4 4<br />
AP-68 101 8 11 32 163 206<br />
N-I 116 8 10 45 159 214<br />
N-102 13 0 0 1 17 18<br />
N-104 14 1 1 4 19 24<br />
N-124 15 1 1 3 15 19<br />
N-240 30 0 0 6 46 52<br />
N-622 29 3 3 4 37 44<br />
N-624<br />
Bizkaia<br />
2 0 0 0 4 4<br />
AP-68 38 4 4 6 55 65<br />
A-8 468 6 7 46 732 785<br />
N-240 47 0 0 10 55 65<br />
N-629 1 0 0 0 1 1<br />
N-633 9 0 0 3 22 25<br />
N-634 254 10 11 35 376 422<br />
N-636 16 1 3 4 19 26<br />
N-637 119 3 3 12 159 174<br />
N-639 9 0 0 6 12 18<br />
N-644<br />
Gipuzkoa<br />
9 0 0 3 9 12<br />
A-8 225 4 5 40 299 344<br />
A-15 18 0 0 4 22 26<br />
N-I 420 16 18 72 515 605<br />
N-634 155 5 5 29 220 254<br />
N-636 57 8 11 11 82 104<br />
N-638 18 0 0 3 20 23<br />
AÑO 2003<br />
Carretera<br />
Acci<strong>de</strong>ntes<br />
con Víctimas<br />
Acci<strong>de</strong>ntes<br />
Mortales<br />
Muertos<br />
Heridos<br />
Leves<br />
Heridos<br />
Graves<br />
Total<br />
Víctimas<br />
Red Básica<br />
Á<strong>la</strong>va<br />
A-124 17 1 1 2 27 30<br />
A-126 2 0 0 1 1 2<br />
A-132 19 1 1 6 25 32<br />
A-623 6 1 1 1 8 10<br />
A-624 24 2 4 4 33 41<br />
A-625 27 1 1 6 33 40<br />
A-627<br />
Bizkaia<br />
7 0 0 0 17 17<br />
BI-604 26 0 0 4 29 33<br />
BI-623 27 0 0 0 38 38<br />
BI-625 47 5 5 18 59 82<br />
BI-630 8 0 0 1 10 11<br />
BI-631 73 2 2 13 97 112<br />
BI-633 29 2 2 8 41 51<br />
BI-634 44 1 2 11 49 62<br />
BI-635 55 3 3 8 73 84<br />
BI-636 91 4 7 20 156 183<br />
BI-637<br />
Gipuzkoa<br />
109 1 1 11 154 166<br />
GI-131 37 0 0 5 46 51<br />
GI-627 55 5 5 9 67 81<br />
GI-631 38 6 6 13 34 53<br />
GI-638 12 0 0 2 13 15<br />
88<br />
Revisión <strong>de</strong>l Segundo P<strong>la</strong>n General <strong>de</strong> Carreteras <strong>de</strong>l País Vasco
Carretera<br />
Acci<strong>de</strong>ntes<br />
con Víctimas<br />
Acci<strong>de</strong>ntes<br />
Mortales<br />
Muertos<br />
Heridos<br />
Leves<br />
ACCIDENTALIDAD Y LESIVIDAD EN LAS CARRETERAS DE LA RED FUNCIONAL<br />
Heridos<br />
Graves<br />
Total<br />
Víctimas<br />
Red Comarcal<br />
Á<strong>la</strong>va<br />
A-2122 6 0 0 2 8 10<br />
A-2124 7 0 0 3 7 10<br />
A-2126 6 0 0 1 8 9<br />
A-2128 2 0 0 0 6 6<br />
A-2130 3 1 1 2 2 5<br />
A-2134 7 1 1 4 6 11<br />
A-2521 2 0 0 3 3 6<br />
A-2522 3 0 0 0 3 3<br />
A-2620 1 0 0 1 0 1<br />
A-2622 12 0 0 3 17 20<br />
A-2625<br />
Bizkaia<br />
4 0 0 1 4 5<br />
BI-2121 14 0 0 5 16 21<br />
BI-2122 12 1 1 5 18 24<br />
BI-2224 5 0 0 1 6 7<br />
BI-2235 24 1 1 6 40 47<br />
BI-2238 12 1 1 0 13 14<br />
BI-2301 4 0 0 3 5 8<br />
BI-2405 13 0 0 2 15 17<br />
BI-2521 1 0 0 1 0 1<br />
BI-2543 2 0 0 0 2 2<br />
BI-2604 4 0 0 0 6 6<br />
BI-2636 1 0 0 0 1 1<br />
BI-2701 19 0 0 3 28 31<br />
BI-2704 23 1 1 4 32 37<br />
BI-2713 6 0 0 4 7 11<br />
AÑO 2003<br />
Carretera<br />
Acci<strong>de</strong>ntes<br />
con Víctimas<br />
Acci<strong>de</strong>ntes<br />
Mortales<br />
Muertos<br />
Heridos<br />
Leves<br />
Heridos<br />
Graves<br />
Total<br />
Víctimas<br />
Gipuzkoa<br />
GI-2120 9 0 0 0 12 12<br />
GI-2130 5 0 0 0 5 5<br />
GI-2132 39 2 2 11 47 60<br />
GI-2135 4 0 0 3 2 5<br />
GI-2620 7 0 0 2 7 9<br />
GI-2630 41 0 0 7 55 62<br />
GI-2633 13 1 1 1 14 16<br />
GI-2634 16 2 3 4 18 25<br />
GI-2636 2 0 0 0 4 4<br />
Fuente: E<strong>la</strong>boración propia a partir <strong>de</strong> datos <strong>de</strong> <strong>la</strong> Dirección General <strong>de</strong> Tráfico.<br />
89<br />
Revisión <strong>de</strong>l Segundo P<strong>la</strong>n General <strong>de</strong> Carreteras <strong>de</strong>l País Vasco
Carretera<br />
Acci<strong>de</strong>ntes<br />
con Víctimas<br />
Acci<strong>de</strong>ntes<br />
Mortales<br />
Muertos<br />
Heridos<br />
Leves<br />
ACCIDENTALIDAD Y LESIVIDAD EN LAS CARRETERAS DE LA RED FUNCIONAL<br />
Heridos<br />
Graves<br />
Total<br />
Víctimas<br />
Red <strong>de</strong> Interés Preferente<br />
Á<strong>la</strong>va<br />
AP-1 4 0 1 5 6<br />
AP-68 91 7 13 34 131 178<br />
N-I 108 7 8 25 164 197<br />
N-102 12 0 0 2 15 17<br />
N-104 15 0 0 2 18 20<br />
N-124 19 3 14 17 34<br />
N-240 29 3 3 8 33 44<br />
N-622 37 0 0 15 56 71<br />
N-624<br />
Bizkaia<br />
0 0 0 0 0 0<br />
AP-68 41 3 3 5 60 68<br />
A-8 390 4 5 29 597 631<br />
N-240 47 4 4 7 61 72<br />
N-629 2 0 0 0 2 2<br />
N-633 13 0 0 5 16 21<br />
N-634 258 8 11 50 359 420<br />
N-636 28 0 0 5 40 45<br />
N-637 80 1 1 12 125 138<br />
N-639 11 0 0 8 11 19<br />
N-644<br />
Gipuzkoa<br />
6 0 0 1 6 7<br />
A-8 209 6 6 28 256 290<br />
A-15 29 2 2 6 49 57<br />
N-I 367 19 24 66 461 551<br />
N-634 155 4 4 34 199 237<br />
N-636 59 1 1 10 75 86<br />
N-638 26 0 0 3 34 37<br />
AÑO 2002<br />
Carretera<br />
Acci<strong>de</strong>ntes<br />
con Víctimas<br />
Acci<strong>de</strong>ntes<br />
Mortales<br />
Muertos<br />
Heridos<br />
Leves<br />
Heridos<br />
Graves<br />
Total<br />
Víctimas<br />
Red básica<br />
Á<strong>la</strong>va<br />
A-124 15 1 1 3 19 23<br />
A-126 2 0 0 2 3 5<br />
A-132 24 1 2 8 25 35<br />
A-623 5 0 0 2 5 7<br />
A-624 20 3 3 6 22 31<br />
A-625 26 2 2 12 24 38<br />
A-627<br />
Bizkaia<br />
12 0 0 9 18 27<br />
BI-604 2 0 0 0 4 4<br />
BI-623 20 2 3 4 26 33<br />
BI-625 40 3 3 10 55 68<br />
BI-630 5 0 0 2 5 5<br />
BI-631 90 5 5 19 126 150<br />
BI-633 45 4 5 8 67 80<br />
BI-634 302 10 13 60 407 480<br />
BI-635 40 0 0 8 63 71<br />
BI-636 67 9 10 32 90 132<br />
BI-637 85 2 2 6 127 135<br />
BI-638<br />
Gipuzkoa<br />
1 0 0 1 0 1<br />
GI-131 37 2 2 5 46 53<br />
GI-627 63 6 6 17 85 108<br />
GI-631 43 1 1 17 47 65<br />
GI-638 15 0 0 4 22 26<br />
90<br />
Revisión <strong>de</strong>l Segundo P<strong>la</strong>n General <strong>de</strong> Carreteras <strong>de</strong>l País Vasco
Carretera<br />
Acci<strong>de</strong>ntes<br />
con Víctimas<br />
Acci<strong>de</strong>ntes<br />
Mortales<br />
Muertos<br />
Heridos<br />
Leves<br />
ACCIDENTALIDAD Y LESIVIDAD EN LAS CARRETERAS DE LA RED FUNCIONAL<br />
Heridos<br />
Graves<br />
Total<br />
Víctimas<br />
Red comarcal<br />
Á<strong>la</strong>va<br />
A-2122 6 1 1 3 16 20<br />
A-2124 11 0 0 0 15 15<br />
A-2126 6 0 0 0 8 8<br />
A-2128 3 0 0 1 3 4<br />
A-2130 1 0 0 0 4 4<br />
A-2134 4 0 0 2 7 9<br />
A-2521 1 0 0 0 1 1<br />
A-2522 4 0 0 2 4 6<br />
A-2620 4 0 0 0 4 4<br />
A-2622 11 0 0 9 8 17<br />
A-2625<br />
Bizkaia<br />
4 0 0 1 4 5<br />
BI-2121 16 1 1 5 16 22<br />
BI-2122 9 0 0 3 9 12<br />
BI-2224 5 1 1 2 3 6<br />
BI-2235 26 1 1 13 34 48<br />
BI-2238 3 0 0 1 2 3<br />
BI-2301 3 0 0 0 3 3<br />
BI-2405 7 0 0 5 7 12<br />
BI-2522 4 0 0 2 4 6<br />
BI-2543 5 0 0 0 6 6<br />
BI-2604 9 0 0 2 11 13<br />
BI-2617 1 0 0 0 1 1<br />
BI-2636 1 0 0 0 1 1<br />
BI-2701 20 0 0 11 26 37<br />
BI-2704 33 0 0 0 58 58<br />
BI-2713 5 0 0 0 8 8<br />
AÑO 2002<br />
Carretera<br />
Acci<strong>de</strong>ntes<br />
con Víctimas<br />
Acci<strong>de</strong>ntes<br />
Mortales<br />
Muertos<br />
Heridos<br />
Leves<br />
Heridos<br />
Graves<br />
Total<br />
Víctimas<br />
Gipuzkoa<br />
GI-2120 7 1 1 1 6 8<br />
GI-2130 6 1 2 3 9 14<br />
GI-2132 36 1 1 7 45 53<br />
GI-2135 4 0 0 1 6 7<br />
GI-2620 9 1 1 0 12 13<br />
GI-2630 27 0 0 5 34 39<br />
GI-2633 10 0 0 3 11 14<br />
GI-2634 19 0 0 10 22 32<br />
Fuente: E<strong>la</strong>boración propia a partir <strong>de</strong> datos <strong>de</strong> <strong>la</strong> Dirección General <strong>de</strong> Tráfico.<br />
91<br />
Revisión <strong>de</strong>l Segundo P<strong>la</strong>n General <strong>de</strong> Carreteras <strong>de</strong>l País Vasco
Carretera<br />
Acci<strong>de</strong>ntes<br />
con Víctimas<br />
Acci<strong>de</strong>ntes<br />
Mortales<br />
Muertos<br />
Heridos<br />
Leves<br />
ACCIDENTALIDAD Y LESIVIDAD EN LAS CARRETERAS DE LA RED FUNCIONAL<br />
Heridos<br />
Graves<br />
Total<br />
Víctimas<br />
Red <strong>de</strong> Interés Preferente<br />
Á<strong>la</strong>va<br />
AP-1 3 1 2 1 7 10<br />
AP-68 60 10 12 38 61 111<br />
N-I 81 5 5 38 96 139<br />
N-102 9 0 0 4 10 14<br />
N-104 11 0 0 6 15 21<br />
N-124 24 5 7 16 35 58<br />
N-240 28 1 2 7 53 62<br />
N-622 38 7 8 17 41 66<br />
N-624<br />
Bizkaia<br />
2 0 0 1 2 3<br />
AP-68 34 1 1 6 49 56<br />
A-8 385 8 9 49 611 669<br />
N-240 67 2 2 18 75 95<br />
N-629 1 0 0 1 1 2<br />
N-633 17 0 0 6 16 22<br />
N-634 259 10 10 44 355 409<br />
N-636 29 0 0 6 37 43<br />
N-637 87 3 3 10 118 131<br />
N-639 12 1 1 5 18 24<br />
N-644<br />
Gipuzkoa<br />
3 0 0 0 3 3<br />
A-8 218 5 5 37 303 345<br />
A-15 35 1 1 20 54 75<br />
N-I 421 18 19 87 546 652<br />
N-634 163 4 4 31 193 228<br />
N-636 54 1 1 6 76 83<br />
N-638 21 0 0 0 27 27<br />
AÑO 2001<br />
Carretera<br />
Acci<strong>de</strong>ntes<br />
con Víctimas<br />
Acci<strong>de</strong>ntes<br />
Mortales<br />
Muertos<br />
Heridos<br />
Leves<br />
Heridos<br />
Graves<br />
Total<br />
Víctimas<br />
Red Básica<br />
Á<strong>la</strong>va<br />
A-124 16 0 0 8 20 28<br />
A-126 1 0 0 0 1 1<br />
A-132 14 1 2 4 19 25<br />
A-623 7 0 0 2 13 15<br />
A-624 13 3 4 8 21 33<br />
A-625 28 2 3 17 37 57<br />
A-627<br />
Bizkaia<br />
6 0 0 4 3 7<br />
BI-623 37 0 0 4 46 50<br />
BI-625 40 0 0 8 51 59<br />
BI-630 8 0 0 2 12 14<br />
BI-631 46 1 1 13 61 75<br />
BI-633 44 1 1 23 54 78<br />
BI-634 48 1 1 11 58 70<br />
BI-635 52 3 3 15 70 88<br />
BI-636 76 4 5 15 10 130<br />
BI-637 96 0 0 5 144 149<br />
BI-638<br />
Gipuzkoa<br />
1 0 0 0 2 2<br />
GI-131 61 0 0 10 73 83<br />
GI-627 62 3 3 18 86 107<br />
GI-631 67 4 4 32 70 106<br />
GI-638 5 0 0 0 8 8<br />
92<br />
Revisión <strong>de</strong>l Segundo P<strong>la</strong>n General <strong>de</strong> Carreteras <strong>de</strong>l País Vasco
Carretera<br />
Acci<strong>de</strong>ntes<br />
con Víctimas<br />
Acci<strong>de</strong>ntes<br />
Mortales<br />
Muertos<br />
Heridos<br />
Leves<br />
ACCIDENTALIDAD Y LESIVIDAD EN LAS CARRETERAS DE LA RED FUNCIONAL<br />
Heridos<br />
Graves<br />
Total<br />
Víctimas<br />
Red Comarcal<br />
Á<strong>la</strong>va<br />
A-2122 4 1 1 1 4 6<br />
A-2124 4 0 0 1 6 7<br />
A-2126 3 0 0 0 4 4<br />
A-2128 3 1 1 1 5 7<br />
A-2134 6 0 0 3 6 9<br />
A-2521 2 0 0 1 4 5<br />
A-2522 6 1 1 2 5 8<br />
A-2604 3 1 1 0 5 6<br />
A-2620 2 0 0 0 7 7<br />
A-2622 14 1 1 10 13 24<br />
A-2625<br />
Bizkaia<br />
5 0 0 1 8 9<br />
BI-2121 16 0 0 1 19 20<br />
BI-2122 19 1 1 3 30 34<br />
BI-2224 4 0 0 0 4 4<br />
BI-2235 26 2 3 6 32 41<br />
BI-2238 9 1 1 4 14 19<br />
BI-2301 2 1 1 0 1 2<br />
BI-2405 4 1 1 0 6 7<br />
BI-2521 1 0 0 0 2 2<br />
BI-2522 4 1 1 2 1 4<br />
BI-2543 4 0 0 0 5 5<br />
BI-2604 4 0 0 0 6 6<br />
BI-2625 1 0 0 0 1 1<br />
BI-2636 4 0 0 4 2 6<br />
BI-2701 16 1 1 1 24 26<br />
BI-2704 29 0 0 10 36 46<br />
BI-2713 1 1 1 0 0 1<br />
AÑO 2001<br />
Carretera<br />
Acci<strong>de</strong>ntes<br />
con Víctimas<br />
Acci<strong>de</strong>ntes<br />
Mortales<br />
Muertos<br />
Heridos<br />
Leves<br />
Heridos<br />
Graves<br />
Total<br />
Víctimas<br />
Gipuzkoa<br />
GI-2120 14 0 0 6 13 19<br />
GI-2130 9 0 0 2 11 13<br />
GI-2132 35 2 2 6 37 45<br />
GI-2135 6 0 0 3 8 11<br />
GI-2620 5 1 1 2 4 7<br />
GI-2630 25 2 2 6 30 38<br />
GI-2633 15 0 0 4 20 24<br />
GI-2634 16 1 1 2 17 20<br />
GI-2636 2 0 0 0 3 3<br />
Fuente: E<strong>la</strong>boración propia a partir <strong>de</strong> datos <strong>de</strong> <strong>la</strong> Dirección General <strong>de</strong> Tráfico.<br />
93<br />
Revisión <strong>de</strong>l Segundo P<strong>la</strong>n General <strong>de</strong> Carreteras <strong>de</strong>l País Vasco
Carretera<br />
Acci<strong>de</strong>ntes<br />
con Víctimas<br />
Acci<strong>de</strong>ntes<br />
Mortales<br />
Muertos<br />
Heridos<br />
Leves<br />
ACCIDENTALIDAD Y LESIVIDAD EN LAS CARRETERAS DE LA RED FUNCIONAL<br />
Heridos<br />
Graves<br />
Total<br />
Víctimas<br />
Red <strong>de</strong> Interés Preferente<br />
Á<strong>la</strong>va<br />
AP-1 1 0 0 1 0 1<br />
AP-68 37 3 3 34 37 74<br />
N-I 73 11 18 49 67 134<br />
N-102 19 0 0 9 24 33<br />
N-104 17 2 2 8 19 29<br />
N-124 20 1 1 6 26 33<br />
N-240 33 2 2 21 33 56<br />
N-622 34 2 2 17 32 51<br />
N-624<br />
Bizkaia<br />
1 0 0 0 0 1<br />
AP-68 33 2 4 6 45 55<br />
A-8 328 7 9 52 506 567<br />
N-240 63 5 5 17 88 110<br />
N-633 8 0 0 0 12 12<br />
N-634 273 9 11 65 390 466<br />
N-636 17 0 0 4 29 33<br />
N-637 69 1 1 8 94 103<br />
N-639 8 0 0 0 9 9<br />
N-644<br />
Gipuzkoa<br />
7 0 0 3 11 14<br />
A-8 71 7 9 42 77 128<br />
A-15 9 1 1 5 11 17<br />
N-I 142 14 16 73 190 279<br />
N-634 82 7 7 48 86 141<br />
N-636 13 3 4 11 11 26<br />
N-638 7 0 0 0 18 18<br />
AÑO 2000<br />
Carretera<br />
Acci<strong>de</strong>ntes<br />
con Víctimas<br />
Acci<strong>de</strong>ntes<br />
Mortales<br />
Muertos<br />
Heridos<br />
Leves<br />
Heridos<br />
Graves<br />
Total<br />
Víctimas<br />
Red Básica<br />
Á<strong>la</strong>va<br />
A-124 18 2 2 6 15 23<br />
A-126 1 0 0 0 1 1<br />
A-132 10 0 0 6 17 23<br />
A-624 12 1 1 2 16 19<br />
A-625 18 1 2 12 24 38<br />
A-627<br />
Bizkaia<br />
11 0 0 8 10 18<br />
BI-623<br />
BI-624<br />
14 0 0 4 20 24<br />
BI-625 44 1 1 19 52 72<br />
BI-630 8 1 1 3 4 8<br />
BI-631 46 0 0 11 65 76<br />
BI-633 31 2 2 12 34 48<br />
BI-634 46 1 1 14 46 61<br />
BI-635 63 2 2 18 92 112<br />
BI-636 63 3 4 14 104 122<br />
BI-637 74 0 0 6 105 111<br />
BI-638<br />
Gipuzkoa<br />
9 0 0 1 20 21<br />
GI-131 24 0 0 4 39 43<br />
GI-627 35 3 3 16 45 64<br />
GI-631 32 2 2 12 33 47<br />
GI-638 7 1 1 4 7 12<br />
94<br />
Revisión <strong>de</strong>l Segundo P<strong>la</strong>n General <strong>de</strong> Carreteras <strong>de</strong>l País Vasco
Carretera<br />
Acci<strong>de</strong>ntes<br />
con Víctimas<br />
Acci<strong>de</strong>ntes<br />
Mortales<br />
Muertos<br />
Heridos<br />
Leves<br />
ACCIDENTALIDAD Y LESIVIDAD EN LAS CARRETERAS DE LA RED FUNCIONAL<br />
Heridos<br />
Graves<br />
Total<br />
Víctimas<br />
Red Comarcal<br />
Á<strong>la</strong>va<br />
A-2122 11 0 0 9 12 21<br />
A-2124 5 0 0 4 6 10<br />
A-2126 2 0 0 0 3 3<br />
A-2128 3 0 0 0 6 6<br />
A-2130 4 0 0 4 3 7<br />
A-2134 1 0 0 0 1 1<br />
A-2521 1 0 0 1 0 1<br />
A-2522 2 0 0 1 3 4<br />
A-2604 2 0 0 0 3 3<br />
A-2620 1 1 1 0 0 1<br />
A-2622 8 2 2 5 8 15<br />
A-2625<br />
Bizkaia<br />
3 0 0 1 2 3<br />
BI-2121 14 1 1 2 11 14<br />
BI-2122 7 1 1 3 6 10<br />
BI-2224 1 0 0 0 1 1<br />
BI-2235 21 2 2 4 24 30<br />
BI-2238 6 1 1 1 7 9<br />
BI-2405 9 1 1 2 14 17<br />
BI-2522 3 0 0 1 3 4<br />
BI-2543 1 0 0 0 1 1<br />
BI-2604 4 1 1 1 6 8<br />
BI-2625 1 0 0 1 0 1<br />
BI-2636 4 0 0 3 2 5<br />
BI-2701 17 0 0 2 25 27<br />
BI-2704 21 0 0 2 32 34<br />
BI-2713 1 0 0 0 1 1<br />
AÑO 2000<br />
Carretera<br />
Acci<strong>de</strong>ntes<br />
con Víctimas<br />
Acci<strong>de</strong>ntes<br />
Mortales<br />
Muertos<br />
Heridos<br />
Leves<br />
Heridos<br />
Graves<br />
Total<br />
Víctimas<br />
Gipuzkoa<br />
GI-2120 8 1 1 6 7 14<br />
GI-2130 3 0 0 1 3 4<br />
GI-2132 10 0 0 8 11 19<br />
GI-2135 1 0 0 0 2 2<br />
GI-2620 9 1 1 5 7 13<br />
GI-2630 14 1 1 9 17 27<br />
GI-2633 4 0 0 2 5 7<br />
GI-2634 11 1 2 7 12 21<br />
Fuente: E<strong>la</strong>boración propia a partir <strong>de</strong> datos <strong>de</strong> <strong>la</strong> Dirección General <strong>de</strong> Tráfico.<br />
95<br />
Revisión <strong>de</strong>l Segundo P<strong>la</strong>n General <strong>de</strong> Carreteras <strong>de</strong>l País Vasco
Carretera<br />
Acci<strong>de</strong>ntes<br />
con Víctimas<br />
Acci<strong>de</strong>ntes<br />
Mortales<br />
Muertos<br />
Heridos<br />
Leves<br />
ACCIDENTALIDAD Y LESIVIDAD EN LAS CARRETERAS DE LA RED FUNCIONAL<br />
Heridos<br />
Graves<br />
Total<br />
Víctimas<br />
Red <strong>de</strong> Interés Preferente<br />
Á<strong>la</strong>va<br />
AP-1 3 0 0 0 3 3<br />
AP-68 32 2 3 22 41 66<br />
N-I 65 7 10 45 77 129<br />
N-102 14 2 2 8 11 21<br />
N-104 14 2 2 3 15 20<br />
N-124 20 3 4 19 18 41<br />
N-240 32 6 7 28 31 66<br />
N-622 25 4 5 13 25 43<br />
N-624<br />
Bizkaia<br />
1 0 0 0 1 1<br />
AP-68 34 4 4 3 41 48<br />
A-8 229 7 8 39 374 421<br />
N-240 59 6 7 22 68 97<br />
N-629 1 1 1 1 0 2<br />
N-633 3 0 0 0 4 4<br />
N-634 189 3 3 54 250 307<br />
N-636 22 2 2 8 26 36<br />
N-637 59 0 0 9 78 87<br />
N-639 11 0 0 4 10 14<br />
N-644<br />
Gipuzkoa<br />
5 0 0 2 4 6<br />
A-8 56 11 13 33 58 104<br />
A-15 10 1 1 4 8 13<br />
N-I 143 15 16 80 160 256<br />
N-634 71 4 4 26 93 123<br />
N-636 23 3 3 8 26 37<br />
N-638 4 0 0 1 4 5<br />
AÑO 1999<br />
Carretera<br />
Acci<strong>de</strong>ntes<br />
con Víctimas<br />
Acci<strong>de</strong>ntes<br />
Mortales<br />
Muertos<br />
Heridos<br />
Leves<br />
Heridos<br />
Graves<br />
Total<br />
Víctimas<br />
Red Básica<br />
Á<strong>la</strong>va<br />
A-124 10 1 1 2 10 13<br />
A-126 1 0 0 0 1 1<br />
A-132 18 1 2 8 16 26<br />
A-623 1 0 0 0 2 2<br />
A-624 13 2 2 6 11 19<br />
A-625 18 4 5 11 23 39<br />
A-627<br />
Bizkaia<br />
10 3 3 11 10 24<br />
BI-623 25 2 2 9 24 35<br />
BI-625 54 2 2 26 52 80<br />
BI-630 5 0 0 2 4 6<br />
BI-631 47 1 1 16 69 86<br />
BI-633 28 3 4 14 53 71<br />
BI-634 36 0 0 17 33 50<br />
BI-635 64 3 3 18 91 112<br />
BI-636 61 5 5 27 96 128<br />
BI-637 39 0 0 3 67 70<br />
BI-638<br />
Gipuzkoa<br />
16 2 2 3 29 34<br />
GI-131 31 0 0 6 40 46<br />
GI-627 39 3 3 18 55 76<br />
GI-631 40 1 1 13 48 62<br />
GI-638 3 1 1 2 3 6<br />
96<br />
Revisión <strong>de</strong>l Segundo P<strong>la</strong>n General <strong>de</strong> Carreteras <strong>de</strong>l País Vasco
Carretera<br />
Acci<strong>de</strong>ntes<br />
con Víctimas<br />
Acci<strong>de</strong>ntes<br />
Mortales<br />
Muertos<br />
Heridos<br />
Leves<br />
ACCIDENTALIDAD Y LESIVIDAD EN LAS CARRETERAS DE LA RED FUNCIONAL<br />
Heridos<br />
Graves<br />
Total<br />
Víctimas<br />
Red Comarcal<br />
Á<strong>la</strong>va<br />
A-2122 9 0 0 4 6 10<br />
A-2124 5 0 0 2 4 6<br />
A-2126 2 0 0 0 3 3<br />
A-2128 1 0 0 1 0 1<br />
A-2134 2 0 0 0 3 3<br />
A-2521 1 1 1 0 0 1<br />
A-2522 1 0 0 1 0 1<br />
A-2604 3 0 0 3 2 5<br />
A-2620 2 0 0 1 2 3<br />
A-2622 11 0 0 7 15 22<br />
A-2625<br />
Bizkaia<br />
6 0 0 6 1 7<br />
BI-2121 15 1 1 2 18 21<br />
BI-2224 1 1 1 1 0 2<br />
BI-2522 4 0 0 0 8 8<br />
BI-2604 3 0 0 0 6 6<br />
BI-2617 2 0 0 1 1 2<br />
BI-2636 1 0 0 1 0 1<br />
BI-2701<br />
Gipuzkoa<br />
19 0 0 9 27 36<br />
GI-2120 1 0 0 1 2 3<br />
GI-2130 6 0 0 6 4 10<br />
GI-2132 23 3 3 5 33 41<br />
GI-2135 1 0 0 1 0 1<br />
GI-2620 4 0 0 0 5 5<br />
GI-2630 23 2 2 7 36 45<br />
GI-2633 6 0 0 4 6 10<br />
GI-2634 9 3 3 5 7 15<br />
GI-2636 1 0 0 1 0 1<br />
Fuente: E<strong>la</strong>boración propia a partir <strong>de</strong> datos <strong>de</strong> <strong>la</strong> Dirección General <strong>de</strong> Tráfico.<br />
AÑO 1999<br />
En los gráficos siguientes se resume <strong>la</strong> evolución <strong>de</strong> los acci<strong>de</strong>ntes con víctimas en <strong>la</strong>s carreteras <strong>de</strong> <strong>la</strong> Red<br />
<strong>de</strong> Interés Preferente y <strong>la</strong> Red Básica.<br />
EVOLUCIÓN DEL NÚMERO DE ACCIDENTES CON VÍCTIMAS EN LAS CARRETERAS DE LA RED DE<br />
INTERÉS PREFERENTE. PERÍODO 1999 - 2003<br />
% Crecimiento acumu<strong>la</strong>do<br />
40,0<br />
35,0<br />
30,0<br />
25,0<br />
20,0<br />
15,0<br />
10,0<br />
5,0<br />
0,0<br />
-5,0<br />
-10,0<br />
-15,0<br />
TERRITORIO HISTÓRICO DE ÁLAVA<br />
AP-68 N-624 N-I N-622 N-104 N-240 N-102 N-124 A-1<br />
Fuente: E<strong>la</strong>boración propia a partir <strong>de</strong> datos <strong>de</strong> <strong>la</strong> Dirección General <strong>de</strong> Tráfico.<br />
La AP-68 es <strong>la</strong> carretera que ha registrado mayor crecimiento en cuanto al número <strong>de</strong> acci<strong>de</strong>ntes con<br />
víctimas <strong>de</strong>s<strong>de</strong> 1999, seguida por <strong>la</strong> N-624 y <strong>la</strong> N-I. Por otro <strong>la</strong>do, varias vías han <strong>red</strong>ucido el número <strong>de</strong><br />
acci<strong>de</strong>ntes en dicho período, <strong>de</strong>stacando <strong>la</strong> AP-1, <strong>la</strong> N-124, <strong>la</strong> N-102 y <strong>la</strong> N-240. La N-104 mantiene en 2003<br />
el mismo número <strong>de</strong> acci<strong>de</strong>ntes con víctimas que en 1999.<br />
97<br />
Revisión <strong>de</strong>l Segundo P<strong>la</strong>n General <strong>de</strong> Carreteras <strong>de</strong>l País Vasco
EVOLUCIÓN DEL NÚMERO DE ACCIDENTES CON VÍCTIMAS EN LAS CARRETERAS DE LA RED DE<br />
INTERÉS PREFERENTE. PERÍODO 1999 - 2003<br />
% Crecimiento acumu<strong>la</strong>do<br />
35,0<br />
30,0<br />
25,0<br />
20,0<br />
15,0<br />
10,0<br />
5,0<br />
0,0<br />
-5,0<br />
-10,0<br />
TERRITORIO HISTÓRICO DE BIZKAIA<br />
N-633 A-8 N-637 N-644 N-634 AP-68 N-629 N-639 N-240 N-636<br />
Fuente: E<strong>la</strong>boración propia a partir <strong>de</strong> datos <strong>de</strong> <strong>la</strong> Dirección General <strong>de</strong> Tráfico.<br />
En Bizkaia <strong>de</strong>stacan los crecimientos registrados por <strong>la</strong> N-633, <strong>la</strong> A-8, N-637 y N-644, todos ellos por encima<br />
<strong>de</strong>l 15%. Por el <strong>la</strong>do contrario registraron <strong>de</strong>scensos en el número <strong>de</strong> acci<strong>de</strong>ntes con víctimas <strong>la</strong> N-636, <strong>la</strong> N-<br />
240, carretera que también baja el número <strong>de</strong> acci<strong>de</strong>ntes en el tramo a<strong>la</strong>vés, y <strong>la</strong> N-639, manteniéndose<br />
constante <strong>la</strong> N-629. También pue<strong>de</strong> comentarse que el aumento <strong>de</strong> acci<strong>de</strong>ntes con víctimas registrado por <strong>la</strong><br />
AP-68 es menos importante, en términos re<strong>la</strong>tivos, en Bizkaia que el registrado en Á<strong>la</strong>va, siendo también<br />
superior el número <strong>de</strong> acci<strong>de</strong>ntes con víctimas <strong>de</strong> esta carretera en Á<strong>la</strong>va que en Bizkaia.<br />
EVOLUCIÓN DEL NÚMERO DE ACCIDENTES CON VÍCTIMASEN LAS CARRETERAS DE LA RED DE<br />
INTERÉS PREFERENTE. PERÍODO 1999 - 2003<br />
% Crecimiento acumu<strong>la</strong>do<br />
50,0<br />
45,0<br />
40,0<br />
35,0<br />
30,0<br />
25,0<br />
20,0<br />
15,0<br />
10,0<br />
5,0<br />
0,0<br />
TERRITORIO HISTÓRICO DE GIPUZKOA<br />
N-638 A-8 N-I N-636 N-634 A-15<br />
Fuente: E<strong>la</strong>boración propia a partir <strong>de</strong> datos <strong>de</strong> <strong>la</strong> Dirección General <strong>de</strong> Tráfico.<br />
En el caso <strong>de</strong> Gipuzkoa, todas <strong>la</strong>s carreteras <strong>de</strong> <strong>la</strong> Red <strong>de</strong> Interés Preferente experimentaron crecimientos en<br />
el número <strong>de</strong> acci<strong>de</strong>ntes con víctimas en el período consi<strong>de</strong>rado, <strong>de</strong>stacando <strong>la</strong> N-638, <strong>la</strong> A-8 y <strong>la</strong> N-I. Esta<br />
<strong>situación</strong>, sin embargo, y tal como ha sido comentado, se invierte a partir <strong>de</strong> 2004, año en que se produce<br />
un fuerte <strong>de</strong>scenso en el número <strong>de</strong> acci<strong>de</strong>ntes con víctimas en <strong>la</strong> mayoría <strong>de</strong> <strong>la</strong>s carreteras guipuzcoanas.<br />
98<br />
Revisión <strong>de</strong>l Segundo P<strong>la</strong>n General <strong>de</strong> Carreteras <strong>de</strong>l País Vasco
EVOLUCIÓN DEL NÚMERO DE ACCIDENTES CON VÍCTIMAS EN LAS CARRETERAS DE LA RED<br />
BÁSICA<br />
% Crecimiento acumu<strong>la</strong>do<br />
60,0<br />
50,0<br />
40,0<br />
30,0<br />
20,0<br />
10,0<br />
0,0<br />
-10,0<br />
-20,0<br />
PERÍODO 1999 - 2003<br />
TERRITORIO HISTÓRICO DE ÁLAVA<br />
A-623 A-126 A-624 A-124 A-625 A-132 A-627<br />
Fuente: E<strong>la</strong>boración propia a partir <strong>de</strong> datos <strong>de</strong> <strong>la</strong> Dirección General <strong>de</strong> Tráfico.<br />
Con respecto a <strong>la</strong> Red Básica, en Á<strong>la</strong>va todas <strong>la</strong>s carreteras que <strong>la</strong> integran con excepción <strong>de</strong> <strong>la</strong> A-627<br />
aumentaron el número <strong>de</strong> acci<strong>de</strong>ntes con víctimas, siendo especialmente <strong>de</strong>stacable el caso <strong>de</strong> <strong>la</strong> A-623,<br />
que aumentó un 56% en el período consi<strong>de</strong>rado.<br />
EVOLUCIÓN DEL NÚMERO DE ACCIDENTES CON VÍCTIMAS EN LAS CARRETERAS DE LA RED<br />
BÁSICA<br />
% Crecimiento acumu<strong>la</strong>do<br />
35,0<br />
30,0<br />
25,0<br />
20,0<br />
15,0<br />
10,0<br />
5,0<br />
0,0<br />
-5,0<br />
-10,0<br />
PERÍODO 1999 - 2003<br />
TERRITORIO HISTÓRICO DE BIZKAIA<br />
BI-637 BI-630 BI-631 BI-636 BI-634 BI-623 BI-633 BI-625 BI-635<br />
Fuente: E<strong>la</strong>boración propia a partir <strong>de</strong> datos <strong>de</strong> <strong>la</strong> Dirección General <strong>de</strong> Tráfico.<br />
En Bizkaia <strong>de</strong>staca el crecimiento en el número <strong>de</strong> acci<strong>de</strong>ntes con víctimas registrado por <strong>la</strong> BI-637. Por su<br />
parte, tan sólo dos carreteras, <strong>la</strong> BI-625 y <strong>la</strong> BI-635, disminuyeron el número <strong>de</strong> acci<strong>de</strong>ntes en el período.<br />
99<br />
Revisión <strong>de</strong>l Segundo P<strong>la</strong>n General <strong>de</strong> Carreteras <strong>de</strong>l País Vasco
EVOLUCIÓN DEL NÚMERO DE ACCIDENTES CON VÍCTIMAS EN LAS CARRETERAS DE LA RED<br />
BÁSICA<br />
% Crecimiento acumu<strong>la</strong>do<br />
45,0<br />
40,0<br />
35,0<br />
30,0<br />
25,0<br />
20,0<br />
15,0<br />
10,0<br />
5,0<br />
0,0<br />
-5,0<br />
PERÍODO 1999 - 2003<br />
TERRITORIO HISTÓRICO DE GIPUZKOA<br />
GI-638 GI-627 GI-131 GI-631<br />
Fuente: E<strong>la</strong>boración propia a partir <strong>de</strong> datos <strong>de</strong> <strong>la</strong> Dirección General <strong>de</strong> Tráfico.<br />
En Gipuzkoa todas <strong>la</strong>s carreteras <strong>de</strong> su Red Básica aumentaron el número <strong>de</strong> acci<strong>de</strong>ntes con víctimas,<br />
<strong>de</strong>stacando <strong>la</strong> GI-638, con un crecimiento por encima <strong>de</strong>l 40%. Sin embargo, es alguna <strong>de</strong> estas carreteras,<br />
como <strong>la</strong> propia GI-638, <strong>la</strong> GI-627 y <strong>la</strong> GI-631, don<strong>de</strong> repercute fundamentalmente el fuerte <strong>de</strong>scenso<br />
producido en 2004.<br />
Como síntesis <strong>de</strong> <strong>la</strong> acci<strong>de</strong>ntalidad en <strong>la</strong>s carreteras <strong>de</strong> <strong>la</strong> Red Funcional, pue<strong>de</strong>n <strong>de</strong>stacarse los<br />
siguientes aspectos.<br />
√ Las carreteras <strong>de</strong> <strong>la</strong> Red <strong>de</strong> Interés Preferente don<strong>de</strong> más ha crecido <strong>la</strong> acci<strong>de</strong>ntalidad son <strong>la</strong> N-638 y<br />
<strong>la</strong> A-8 en el tramo guipuzcoano, con tasas <strong>de</strong> crecimiento medio anual acumu<strong>la</strong>do que superan el 40%<br />
(estas dos carreteras se localizan en el Territorio Histórico <strong>de</strong> Gipuzkoa). Le sigue con una tasa <strong>de</strong>l<br />
33,3%, <strong>la</strong> acci<strong>de</strong>ntalidad ocurrida en el tramo a<strong>la</strong>vés <strong>de</strong> <strong>la</strong> Autopista <strong>de</strong> Peaje AP-68, y con un 31,6% <strong>la</strong><br />
carretera N-633 <strong>de</strong> Bizkaia.<br />
Respecto al crecimiento <strong>de</strong>l número <strong>de</strong> víctimas, <strong>de</strong>staca sobre el resto el importante aumento que se<br />
ha producido en <strong>la</strong> carretera N-633, don<strong>de</strong> <strong>la</strong> tasa <strong>de</strong> crecimiento medio anual acumu<strong>la</strong>do es <strong>de</strong>l 58%.<br />
En el Territorio Histórico <strong>de</strong> Gipuzkoa, <strong>la</strong>s carreteras don<strong>de</strong> más ha crecido el número <strong>de</strong> acci<strong>de</strong>ntes<br />
con víctimas (N-638 y A-8), son también don<strong>de</strong> más ha aumentado el número <strong>de</strong> víctimas.<br />
Finalmente, en <strong>la</strong> carretera A<strong>la</strong>vesa N-624 el crecimiento <strong>de</strong>l número <strong>de</strong> víctimas supera el 40%.<br />
√ En <strong>la</strong>s carreteras <strong>de</strong> <strong>la</strong> Red Básica, <strong>la</strong> carretera a<strong>la</strong>vesa A-623 es aquel<strong>la</strong> en <strong>la</strong> que el crecimiento <strong>de</strong>l<br />
número <strong>de</strong> acci<strong>de</strong>ntes con víctimas en el período <strong>de</strong> <strong>análisis</strong> es el más importante, ya que <strong>la</strong> tasa <strong>de</strong><br />
crecimiento medio anual acumu<strong>la</strong>do supera el 55%. Destacan también <strong>la</strong> GI-638, con una tasa superior<br />
al 40%, y <strong>la</strong> BI-637, don<strong>de</strong> <strong>la</strong> tasa <strong>de</strong> crecimiento medio anual acumu<strong>la</strong>do es <strong>de</strong>l or<strong>de</strong>n <strong>de</strong>l 30%.<br />
Los mayores crecimientos respecto al número <strong>de</strong> víctimas, se han producido en <strong>la</strong>s mismas carreteras<br />
don<strong>de</strong> el crecimiento <strong>de</strong> <strong>la</strong> acci<strong>de</strong>ntalidad también ha sido mayor.<br />
√ Finalmente, <strong>la</strong>s carreteras <strong>de</strong> <strong>la</strong> Red Comarcal don<strong>de</strong> más se ha incrementado el número <strong>de</strong><br />
acci<strong>de</strong>ntes con víctimas, son <strong>la</strong> BI-2224 (49,5%) y <strong>la</strong> A-2124 (36,8%). Y don<strong>de</strong> el crecimiento <strong>de</strong>l número<br />
<strong>de</strong> víctimas ha sido más importante, es en <strong>la</strong>s carreteras <strong>de</strong>l Territorio Histórico <strong>de</strong> Á<strong>la</strong>va A-2128 y A-<br />
2521 (con tasas <strong>de</strong> crecimiento medio anual acumu<strong>la</strong>do <strong>de</strong> más <strong>de</strong>l 56,5%).<br />
En el año 2003, el mayor número <strong>de</strong> acci<strong>de</strong>ntes con víctimas, y el mayor número <strong>de</strong> víctimas, que han<br />
tenido lugar en <strong>la</strong>s carreteras <strong>de</strong> <strong>la</strong> Red Funcional <strong>de</strong>l País Vasco se han producido en carreteras <strong>de</strong> <strong>la</strong> Red<br />
<strong>de</strong> Interés Preferente <strong>de</strong> los Territorios Históricos <strong>de</strong> Bizkaia y Gipuzkoa. Son <strong>la</strong>s carreteras que figuran en <strong>la</strong><br />
tab<strong>la</strong> adjunta, don<strong>de</strong> <strong>de</strong>stacan sobre el resto el tramo vizcaíno <strong>de</strong> <strong>la</strong> A-8 (con 468 acci<strong>de</strong>ntes y 785 víctimas)<br />
y el guipuzcoano <strong>de</strong> <strong>la</strong> N-I (con 420 acci<strong>de</strong>ntes y 605 víctimas).<br />
CARRETERAS DE LA RED FUNCIONAL DE MAYOR ACCIDENTALIDAD Y LESIVIDAD<br />
Carretera Territorio Histórico<br />
Acci<strong>de</strong>ntes<br />
con Víctimas<br />
AÑO 2003<br />
Acci<strong>de</strong>ntes Mortales<br />
Víctimas (muertos,<br />
heridos graves y leves)<br />
A-8 Bizkaia 468 6 785<br />
A-8 Gipuzkoa 225 4 344<br />
N-I Gipuzkoa 420 16 605<br />
N-634 Bizkaia 254 10 422<br />
N-634 Gipuzkoa 155 5 254<br />
Fuente: E<strong>la</strong>boración propia a partir <strong>de</strong> datos <strong>de</strong> <strong>la</strong> Dirección General <strong>de</strong> Tráfico.<br />
La información <strong>de</strong> acci<strong>de</strong>ntalidad se localiza geográficamente mediante el Sistema <strong>de</strong> Información<br />
Geográfica ArcMap. Se muestra a continuación un ejemplo <strong>de</strong> un acci<strong>de</strong>nte i<strong>de</strong>ntificado en <strong>la</strong> carretera <strong>de</strong> <strong>la</strong><br />
BI-604 <strong>de</strong> <strong>la</strong> Red Básica en el Territorio Histórico <strong>de</strong> Bizkaia y en el P.K 4+500. La información re<strong>la</strong>tiva a<br />
acci<strong>de</strong>ntes con víctimas hace referencia entre otros aspectos a número <strong>de</strong> vehículos implicados, heridos<br />
leves, graves o número <strong>de</strong> muertos.<br />
100<br />
Revisión <strong>de</strong>l Segundo P<strong>la</strong>n General <strong>de</strong> Carreteras <strong>de</strong>l País Vasco
<strong>2.</strong>1.6.8. Acci<strong>de</strong>ntes por kilómetro<br />
Fuente: E<strong>la</strong>boración propia a partir <strong>de</strong> datos <strong>de</strong> <strong>la</strong> Dirección General <strong>de</strong> Tráfico.<br />
A partir <strong>de</strong> los acci<strong>de</strong>ntes con víctimas que se producen en cada una <strong>de</strong> <strong>la</strong>s carreteras <strong>de</strong> <strong>la</strong> Red Funcional y,<br />
en función <strong>de</strong> <strong>la</strong>s longitu<strong>de</strong>s <strong>de</strong> éstas, se calcu<strong>la</strong> a continuación el número <strong>de</strong> acci<strong>de</strong>ntes con víctimas por<br />
kilómetro <strong>de</strong> <strong>la</strong>s carreteras <strong>de</strong> Á<strong>la</strong>va, Gipuzkoa y Bizkaia.<br />
A<strong>de</strong>más <strong>de</strong> <strong>la</strong>s tab<strong>la</strong>s con los datos anteriormente mencionados, se presentan unos gráficos don<strong>de</strong> figura <strong>la</strong><br />
media <strong>de</strong> los acci<strong>de</strong>ntes con víctimas por kilómetro <strong>de</strong> <strong>la</strong> <strong>red</strong> que se trate, y los acci<strong>de</strong>ntes con víctimas por<br />
kilómetro <strong>de</strong> <strong>la</strong>s carreteras que conforman dicha <strong>red</strong>.<br />
ACCIDENTES CON VÍCTIMAS POR KILÓMETRO EN LAS CARRETERAS DE LA RED FUNCIONAL DE<br />
ÁLAVA. AÑO 2003<br />
Carretera<br />
Acci<strong>de</strong>ntes con<br />
Víctimas<br />
Kilómetros<br />
Acci<strong>de</strong>ntes con<br />
víctimas / km<br />
Red <strong>de</strong> Interés Preferente<br />
AP-1 2 6,00 0,3<br />
AP-68 101 55,50 1,8<br />
N-I 116 63,29 1,8<br />
N-102 13 5,39 2,4<br />
N-104 14 9,47 1,5<br />
N-124 15 14,38 1,0<br />
N-240 30 18,51 1,6<br />
N-622 29 19,35 1,5<br />
N-624 0 3,12 0,0<br />
Red Básica<br />
A-124 17 27,93 0,6<br />
A-126 2 10,09 0,2<br />
A-132 19 39,07 0,5<br />
A-623 6 6,04 1,0<br />
A-624 24 38,39 0,6<br />
A-625 27 21,03 1,3<br />
A-627 7 5,36 1,3<br />
Red Comarcal<br />
A-2122 6 18,72 0,3<br />
A-2124 7 19,26 0,4<br />
A-2126 6 14,75 0,4<br />
A-2128 2 31,06 0,1<br />
A-2130 3 3,26 0,9<br />
A-2134 7 3,61 1,9<br />
A-2521 2 11,38 0,2<br />
A-2522 3 8,90 0,3<br />
A-2604 0 2,92 0,0<br />
A-2620 1 17,35 0,1<br />
A-2622 12 41,84 0,3<br />
A-2625 4 17,98 0,2<br />
Fuente: E<strong>la</strong>boración propia a partir <strong>de</strong> datos <strong>de</strong> <strong>la</strong> Dirección General <strong>de</strong> Tráfico.<br />
Media <strong>de</strong> <strong>la</strong> <strong>red</strong><br />
Acci<strong>de</strong>ntes con<br />
víctimas / km<br />
1,6<br />
0,8<br />
0,3<br />
101<br />
Revisión <strong>de</strong>l Segundo P<strong>la</strong>n General <strong>de</strong> Carreteras <strong>de</strong>l País Vasco
ACCIDENTES CON VÍCTIMAS POR KILÓMETRO EN LA RED DE INTERÉS PREFERENTE DE ÁLAVA<br />
3,0<br />
2,5<br />
2,0<br />
1,5<br />
1,0<br />
0,5<br />
0,0<br />
0,3<br />
1,8 1,8<br />
AÑO 2003<br />
2,4<br />
AP-1 AP-68 N-I N-102 N-104 N-124 N-240 N-622 N-624<br />
1,5<br />
Acci<strong>de</strong>ntes con victimas / km Media <strong>de</strong> <strong>la</strong> Red<br />
Fuente: E<strong>la</strong>boración propia a partir <strong>de</strong> datos <strong>de</strong> <strong>la</strong> Dirección General <strong>de</strong> Tráfico.<br />
En Á<strong>la</strong>va, <strong>la</strong> media <strong>de</strong> los acci<strong>de</strong>ntes con víctimas por kilómetro, en <strong>la</strong> Red <strong>de</strong> Interés Preferente, es <strong>de</strong> 1,6.<br />
Tres <strong>de</strong> <strong>la</strong>s carreteras incluidas en esta jerarquización presenta un ratio superior a <strong>la</strong> media, siendo <strong>la</strong><br />
carretera N-102 (<strong>de</strong>s<strong>de</strong> Ariñez, en <strong>la</strong> N-I, hasta Vitoria-Gasteiz, en Armentia) <strong>la</strong> que mayor número <strong>de</strong><br />
acci<strong>de</strong>ntes con víctimas por kilómetro registra en el año 2003, seguida por <strong>la</strong> N-I y <strong>la</strong> AP-68. En el extremo<br />
opuesto está <strong>la</strong> carretera que da acceso al Aeropuerto <strong>de</strong> Foronda, <strong>la</strong> N-624, ya que en el<strong>la</strong> no se ha<br />
producido ningún acci<strong>de</strong>nte con víctimas en ese año.<br />
ACCIDENTES CON VÍCTIMAS POR KILÓMETRO EN LA RED BÁSICA DE ÁLAVA<br />
AÑO 2003<br />
1,4<br />
1,2<br />
1,0<br />
0,8<br />
0,6<br />
0,4<br />
0,2<br />
0,0<br />
0,6<br />
0,2<br />
0,5<br />
A-124 A-126 A-132 A-623 A-624 A-625 A-627<br />
1,0<br />
Acci<strong>de</strong>ntes con victimas / km Media <strong>de</strong> <strong>la</strong> Red<br />
Fuente: E<strong>la</strong>boración propia a partir <strong>de</strong> datos <strong>de</strong> <strong>la</strong> Dirección General <strong>de</strong> Tráfico.<br />
1,0<br />
0,6<br />
1,6<br />
1,3<br />
1,5<br />
1,6<br />
0<br />
1,3<br />
0,8<br />
En <strong>la</strong> Red Básica <strong>de</strong> Á<strong>la</strong>va, el valor medio <strong>de</strong> los acci<strong>de</strong>ntes con víctimas en el año 2003 ascien<strong>de</strong> a 0,8<br />
acci<strong>de</strong>ntes con víctimas / km, siendo inferior a <strong>la</strong> media <strong>de</strong> <strong>la</strong> Red <strong>de</strong> Interés Preferente. Las carreteras <strong>de</strong><br />
esta <strong>red</strong> que tienen un mayor valor <strong>de</strong> ratio, son a A-625 y <strong>la</strong> A-627, con 1,3 acci<strong>de</strong>ntes con víctimas por<br />
kilómetro, seguidas por <strong>la</strong> A-623, con 1,0 acci<strong>de</strong>nte con víctima por kilómetro.<br />
ACCIDENTES CON VÍCTIMAS POR KILÓMETRO EN LA RED COMARCAL DE ÁLAVA<br />
2,5<br />
2,0<br />
1,5<br />
1,0<br />
0,5<br />
0,0<br />
A-2122<br />
0,3 0,4 0,4<br />
A-2124<br />
A-2126<br />
A-2128<br />
0,1<br />
A-2130<br />
AÑO 2003<br />
0,9<br />
A-2134<br />
1,9<br />
A-2521<br />
0,2<br />
A-2522<br />
0,3<br />
A-2604<br />
0<br />
A-2620<br />
Acci<strong>de</strong>ntes con victimas / km Media <strong>de</strong> <strong>la</strong> Red<br />
Fuente: E<strong>la</strong>boración propia a partir <strong>de</strong> datos <strong>de</strong> <strong>la</strong> Dirección General <strong>de</strong> Tráfico.<br />
Finalmente, en <strong>la</strong> Red Comarcal <strong>la</strong> media <strong>de</strong>l número <strong>de</strong> acci<strong>de</strong>ntes con víctimas en el año 2003 es menor<br />
que en los dos casos anteriores (0,3 acci<strong>de</strong>ntes con víctimas / km). Destacan respecto al resto, <strong>la</strong>s<br />
carreteras A-2134, sita en Vitoria-Gasteiz, con 1,9 acci<strong>de</strong>ntes con víctimas por kilómetro; y <strong>la</strong> carretera A-<br />
2604, don<strong>de</strong> no se ha producido ningún acci<strong>de</strong>nte con víctimas en el año 2003.<br />
0,1<br />
A-2622<br />
102<br />
Revisión <strong>de</strong>l Segundo P<strong>la</strong>n General <strong>de</strong> Carreteras <strong>de</strong>l País Vasco<br />
0,3<br />
A-2625<br />
0,3<br />
0,2
Carretera<br />
Acci<strong>de</strong>ntes con<br />
Víctimas<br />
ACCIDENTES CON VÍCTIMAS POR KILÓMETRO EN LAS CARRETERAS DE LA RED FUNCIONAL DE BIZKAIA. AÑO 2003<br />
Kilómetros<br />
Acci<strong>de</strong>ntes con<br />
víctimas / km<br />
Red <strong>de</strong> Interés Preferente<br />
AP-68 38 22,35 1,7<br />
A-8 468 63,98 7,3<br />
N-240 47 32,21 1,5<br />
N-629 1 3,87 0,3<br />
N-633 9 4,54 2,0<br />
N-634 254 66,50 3,8<br />
N-636 16 15,95 1,0<br />
N-637 119 19,97 6,0<br />
N-639 9 8,45 1,1<br />
N-644 9 2,66 3,4<br />
Red Básica<br />
Red Comarcal<br />
BI-604 26 4,75 5,5<br />
BI-623 27 20,86 1,3<br />
BI-624 0 2,58 0,0<br />
BI-625 47 17,69 2,7<br />
BI-630 8 23,92 0,3<br />
BI-631 73 31,45 2,3<br />
BI-633 29 27,77 1,0<br />
BI-634 44 12,89 3,4<br />
BI-635 55 17,33 3,2<br />
BI-636 91 30,34 3,0<br />
BI-637 109 10,28 10,6<br />
BI-638 0 1.240 0,0<br />
BI-639 - - -<br />
BI-2121 14 17.600 0,8<br />
BI-2122 12 4.600 2,6<br />
BI-2224 5 20.400 0,2<br />
BI-2235 24 13.900 1,7<br />
Media <strong>de</strong> <strong>la</strong> <strong>red</strong><br />
Acci<strong>de</strong>ntes con<br />
víctimas / km<br />
4,0<br />
2,5<br />
0,8<br />
Carretera<br />
Acci<strong>de</strong>ntes con<br />
Víctimas<br />
Kilómetros<br />
Acci<strong>de</strong>ntes con<br />
víctimas / km<br />
BI-2238 12 19.000 0,6<br />
BI-2405 13 9.800 1,3<br />
BI-2521 1 15.100 0,1<br />
BI-2522 0 11.000 0,0<br />
BI-2543 2 18.900 0,1<br />
BI-2604 4 10.000 0,4<br />
BI-2617 0 <strong>2.</strong>200 0,0<br />
BI-2625 0 1.900 0,0<br />
BI-2636 1 6.800 0,1<br />
BI-2701 19 15.400 1,2<br />
BI-2704 23 15.100 1,5<br />
BI-2713 6 10.300 0,6<br />
Fuente: E<strong>la</strong>boración propia a partir <strong>de</strong> datos <strong>de</strong> <strong>la</strong> Dirección General <strong>de</strong> Tráfico.<br />
Media <strong>de</strong> <strong>la</strong> <strong>red</strong><br />
Acci<strong>de</strong>ntes con<br />
víctimas / km<br />
103<br />
Revisión <strong>de</strong>l Segundo P<strong>la</strong>n General <strong>de</strong> Carreteras <strong>de</strong>l País Vasco
ACCIDENTES CON VÍCTIMAS POR KILÓMETRO EN LA RED DE INTERÉS PREFERENTE DE<br />
BIZKAIA<br />
8,0<br />
7,0<br />
6,0<br />
5,0<br />
4,0<br />
3,0<br />
2,0<br />
1,0<br />
0,0<br />
1,7<br />
7,3<br />
1,5<br />
AÑO 2003<br />
0,3<br />
2,0<br />
AP-68 A-8 N-240 N-629 N-633 N-634 N-636 N-637 N-639 N-644<br />
Acci<strong>de</strong>ntes con victimas / km Media <strong>de</strong> <strong>la</strong> Red<br />
Fuente: E<strong>la</strong>boración propia a partir <strong>de</strong> datos <strong>de</strong> <strong>la</strong> Dirección General <strong>de</strong> Tráfico.<br />
De <strong>la</strong>s carreteras <strong>de</strong> <strong>la</strong> Red <strong>de</strong> Interés Preferente <strong>de</strong>l País Vasco, es en el Territorio Histórico <strong>de</strong> Bizkaia<br />
don<strong>de</strong> <strong>la</strong> media <strong>de</strong>l número <strong>de</strong> acci<strong>de</strong>ntes con víctimas / km es <strong>la</strong> mayor <strong>de</strong> todas, siendo su valor <strong>de</strong> 4,0.<br />
Tan sólo dos <strong>de</strong> <strong>la</strong>s diez carreteras incluidas en esta jerarquización tiene un ratio superior a dicho valor. Son<br />
<strong>la</strong> Autopista A-8 con 7,3 acci<strong>de</strong>ntes con víctimas por kilómetro y <strong>la</strong> N-637 con 6,0 acci<strong>de</strong>ntes con víctimas<br />
por kilómetro.<br />
En el extremo opuesto, se sitúa <strong>la</strong> carretera N-629 (en el Término Municipal <strong>de</strong> Lanestosa) con 0,3<br />
acci<strong>de</strong>ntes con víctimas por kilómetro en el año 2003.<br />
3,8<br />
1,0<br />
6,0<br />
1,1<br />
4,0<br />
3,4<br />
ACCIDENTES CON VÍCTIMAS POR KILÓMETRO EN LA RED BÁSICA DE BIZKAIA<br />
12,0<br />
10,0<br />
8,0<br />
6,0<br />
4,0<br />
2,0<br />
0,0<br />
5,5<br />
1,3<br />
0,0<br />
2,7<br />
AÑO 2003<br />
0,3<br />
2,3<br />
1,0<br />
3,4<br />
3,2 3,0<br />
BI-604 BI-623 BI-624 BI-625 BI-630 BI-631 BI-633 BI-634 BI-635 BI-636 BI-637 BI-638<br />
Acci<strong>de</strong>ntes con victimas / km Media <strong>de</strong> <strong>la</strong> Red<br />
Fuente: E<strong>la</strong>boración propia a partir <strong>de</strong> datos <strong>de</strong> <strong>la</strong> Dirección General <strong>de</strong> Tráfico.<br />
En el caso <strong>de</strong> <strong>la</strong>s carreteras <strong>de</strong> <strong>la</strong> Red Básica, cinco <strong>de</strong> <strong>la</strong>s doce incluidas en este grupo tienen, en el año<br />
2003, una acci<strong>de</strong>ntalidad por kilómetro superior a <strong>la</strong> media (que es <strong>de</strong> 2,5 acci<strong>de</strong>ntes con víctimas / km).<br />
Son <strong>la</strong> BI-604 (<strong>de</strong> Bilbao a Asua, por Enekuri), <strong>la</strong> BI-625 (Orduña - Bilbao), <strong>la</strong> BI-634 (Berango - Mungia), <strong>la</strong><br />
BI-635 (Lemoa – Gernika-Lumo), <strong>la</strong> BI-636 (<strong>de</strong> Bilbao a Reinosa), y <strong>la</strong> carretera BI-637 (Erandio - Berango),<br />
<strong>de</strong>stacando esta última por registrar un valor muy superior a <strong>la</strong> media, 10,6 acci<strong>de</strong>ntes con víctimas por<br />
kilómetro.<br />
En el extremo opuesto se encuentran <strong>la</strong>s carreteras BI-604 y BI-638, con ningún acci<strong>de</strong>nte con víctimas en<br />
el año 2003. De <strong>la</strong> carretera BI-639 no existen datos disponibles.<br />
104<br />
Revisión <strong>de</strong>l Segundo P<strong>la</strong>n General <strong>de</strong> Carreteras <strong>de</strong>l País Vasco<br />
10 ,6<br />
2,5<br />
0,0
ACCIDENTES CON VÍCTIMAS POR KILÓMETRO EN LA RED COMARCAL DE BIZKAIA<br />
2,5<br />
2,0<br />
1,5<br />
1,0<br />
0,5<br />
0,0<br />
0,8<br />
2,0<br />
0,2<br />
1,8<br />
0,5<br />
AÑO 2003<br />
1,2<br />
0,2<br />
0,0<br />
0,1<br />
0,0 0,0<br />
Acci<strong>de</strong>ntes con victimas / km Media <strong>de</strong> <strong>la</strong> Red<br />
Fuente: E<strong>la</strong>boración propia a partir <strong>de</strong> datos <strong>de</strong> <strong>la</strong> Dirección General <strong>de</strong> Tráfico.<br />
Finalmente, en <strong>la</strong>s carreteras <strong>de</strong> <strong>la</strong> Red Comarcal <strong>de</strong>l Territorio Histórico <strong>de</strong> Bizkaia, <strong>la</strong> media <strong>de</strong> los<br />
acci<strong>de</strong>ntes con víctimas por kilómetro es <strong>de</strong> 0,8, registrando cinco <strong>de</strong> el<strong>la</strong>s (BI-2122, <strong>de</strong> Sope<strong>la</strong>na a Plentzia;<br />
BI-2235, <strong>de</strong> Gernika-Lumo a Bermeo; BI-2405, <strong>de</strong> P<strong>la</strong>zako<strong>la</strong> a Lekeito; BI-2701, <strong>de</strong> Muskiz a Ma<strong>la</strong>brigo por<br />
Sopuerta; y BI-2704, <strong>de</strong> Asua a Plentzia) una acci<strong>de</strong>ntalidad por kilómetro superior a <strong>la</strong> media. La carretera<br />
don<strong>de</strong> el número <strong>de</strong> acci<strong>de</strong>ntes con víctimas por kilómetro es el máximo es <strong>la</strong> BI-2122, con un ratio <strong>de</strong> 2,6.<br />
Por el contrario, en tres <strong>de</strong> <strong>la</strong>s carreteras <strong>de</strong> <strong>la</strong> Red Comarcal, el número <strong>de</strong> acci<strong>de</strong>ntes con víctimas es cero.<br />
Son <strong>la</strong>s carreteras BI-2522, <strong>de</strong> Llodio al límite con Á<strong>la</strong>va; BI-2617, <strong>de</strong> Vil<strong>la</strong>ver<strong>de</strong> <strong>de</strong> Trucios a Agüera; y <strong>la</strong> BI-<br />
2625, <strong>de</strong> Pancorbo a Orduña.<br />
0,2<br />
1,2<br />
1,5<br />
0,8<br />
0,5<br />
ACCIDENTES CON VÍCTIMAS POR KILÓMETRO EN LAS CARRETERAS DE LA RED FUNCIONAL DE<br />
GIPUZKOA<br />
Carretera<br />
Acci<strong>de</strong>ntes con<br />
Víctimas<br />
AÑO 2003<br />
Kilómetros<br />
Acci<strong>de</strong>ntes con<br />
víctimas / km<br />
Red <strong>de</strong> Interés Preferente<br />
A-8 225 75,00 3,0<br />
A-15 18 17,32 1,0<br />
N-I 420 79,50 5,3<br />
N-121-A 0 7,20 0<br />
N-634 155 66,33 2,3<br />
N-636 57 35,35 1,6<br />
N-638 18 2,50 7,2<br />
Red Básica<br />
GI-131 37 14,70 2,5<br />
GI-627 55 38,29 1,4<br />
GI-631 38 34,50 1,1<br />
GI-638 12 7,90 1,5<br />
Red Comarcal<br />
GI-2120 9 19,00 0,5<br />
GI-2130 5 16,09 0,3<br />
GI-2132 39 15,53 4,9<br />
GI-2135 4 11,00 0,4<br />
GI-2620 7 6,10 1,3<br />
GI-2630 41 23,48 2,0<br />
GI-2633 13 12,95 1,1<br />
GI-2634 16 38,76 0,8<br />
GI-2636 2 6,42 0,4<br />
Fuente: E<strong>la</strong>boración propia a partir <strong>de</strong> datos <strong>de</strong> <strong>la</strong> Dirección General <strong>de</strong> Tráfico.<br />
Media <strong>de</strong> <strong>la</strong> <strong>red</strong><br />
Acci<strong>de</strong>ntes con<br />
víctimas / km<br />
3,4<br />
1,5<br />
0,9<br />
105<br />
Revisión <strong>de</strong>l Segundo P<strong>la</strong>n General <strong>de</strong> Carreteras <strong>de</strong>l País Vasco
ACCIDENTES CON VÍCTIMAS POR KILÓMETRO EN LA RED DE INTERÉS PREFERENTE DE<br />
GIPUZKOA<br />
8,0<br />
7,0<br />
6,0<br />
5,0<br />
4,0<br />
3,0<br />
2,0<br />
1,0<br />
0,0<br />
3,0<br />
1,0<br />
5,3<br />
AÑO 2003<br />
A-8 A-15 N-I N-121-A N-634 N-636 N-638<br />
0<br />
Acci<strong>de</strong>ntes con victimas / km Media <strong>de</strong> <strong>la</strong> Red<br />
Fuente: E<strong>la</strong>boración propia a partir <strong>de</strong> datos <strong>de</strong> <strong>la</strong> Dirección General <strong>de</strong> Tráfico.<br />
La media <strong>de</strong> los acci<strong>de</strong>ntes con víctimas por kilómetro en <strong>la</strong>s carreteras <strong>de</strong> <strong>la</strong> Red <strong>de</strong> Interés Preferente <strong>de</strong><br />
Gipuzkoa es <strong>de</strong> 3,4. En <strong>la</strong> carretera N-638 <strong>de</strong> acceso al Aeropuerto <strong>de</strong> Hondarribia, este valor se dispara<br />
hasta los 7,2 acci<strong>de</strong>ntes con víctimas por kilómetro, superándose también en <strong>la</strong> N-I, don<strong>de</strong> se alcanzan los<br />
5,3 acci<strong>de</strong>ntes con víctimas por kilómetro.<br />
2,3<br />
1,6<br />
7,2<br />
3,4<br />
ACCIDENTES CON VÍCTIMAS POR KILÓMETRO EN LA RED BÁSICA DE GIPUZKOA<br />
3,0<br />
2,5<br />
2,0<br />
1,5<br />
1,0<br />
0,5<br />
0,0<br />
2,5<br />
AÑO 2003<br />
1,4<br />
GI-131 GI-627 GI-631 GI-638<br />
Acci<strong>de</strong>ntes con victimas / km Media <strong>de</strong> <strong>la</strong> Red<br />
Fuente: E<strong>la</strong>boración propia a partir <strong>de</strong> datos <strong>de</strong> <strong>la</strong> Dirección General <strong>de</strong> Tráfico.<br />
En <strong>la</strong>s carreteras <strong>de</strong> <strong>la</strong> Red Básica que forman parte <strong>de</strong> <strong>la</strong> Red Funcional <strong>de</strong> Gipuzkoa, <strong>la</strong> media <strong>de</strong> los<br />
acci<strong>de</strong>ntes con víctimas por kilómetro es <strong>de</strong> 1,5. Con una acci<strong>de</strong>ntalidad por kilómetro superior a este valor,<br />
se encuentra <strong>la</strong> carretera GI-131 (<strong>de</strong> Andoain a Donostia-San Sebastián por Hernani), igualándose en el caso<br />
<strong>de</strong> <strong>la</strong> GI-638 (Deba - Ondarroa) con unos ratios, respectivamente, <strong>de</strong> 2,5 y 1,5 acci<strong>de</strong>ntes con víctimas por<br />
kilómetro.<br />
1,1<br />
1,5<br />
1,5<br />
106<br />
Revisión <strong>de</strong>l Segundo P<strong>la</strong>n General <strong>de</strong> Carreteras <strong>de</strong>l País Vasco
ACCIDENTES POR KILÓMETRO EN LA RED COMARCAL DE GIPUZKOA<br />
3,0<br />
2,5<br />
2,0<br />
1,5<br />
1,0<br />
0,5<br />
0,0<br />
0,5<br />
0,3<br />
2,5<br />
AÑO 2003<br />
0,4<br />
GI-2120 GI-2130 GI-2132 GI-2135 GI-2620 GI-2630 GI-2633 GI-2634 GI-2636<br />
1,1<br />
Acci<strong>de</strong>ntes con victimas / km Media <strong>de</strong> <strong>la</strong> Red<br />
Fuente: E<strong>la</strong>boración propia a partir <strong>de</strong> datos <strong>de</strong> <strong>la</strong> Dirección General <strong>de</strong> Tráfico.<br />
Finalmente, en <strong>la</strong>s carreteras <strong>de</strong> <strong>la</strong> Red Comarcal, tres carreteras presentan una acci<strong>de</strong>ntalidad superior a <strong>la</strong><br />
media (que es <strong>de</strong> 0,9 acci<strong>de</strong>ntes con víctimas por kilómetro). Son <strong>la</strong> GI-2132 (Astigarraga - Errenteria), <strong>la</strong><br />
GI-2620 (Arrasate / Mondragón – Límite <strong>de</strong>l Territorio Histórico <strong>de</strong> Á<strong>la</strong>va), GI-2630 (Zumarraga - Arrasate /<br />
Mondragón) y <strong>la</strong> GI 2633 (Arroa - Zarautz) con 4,9, 1,3, 2,0 y 1,1 acci<strong>de</strong>ntes con víctimas respectivamente.<br />
En el siguiente gráfico se presentan los valores medios por categoría <strong>de</strong> <strong>red</strong> <strong>de</strong>l número <strong>de</strong> acci<strong>de</strong>ntes con<br />
víctimas por kilómetro <strong>de</strong> los tres Territorios Históricos.<br />
1,7<br />
1,0<br />
0,4<br />
0,3<br />
0,9<br />
MEDIA DEL NÚMERO DE ACCIDENTES CON VÍCTIMAS POR KILÓMETRO. AÑO 2003<br />
4,5<br />
4,0<br />
3,5<br />
3,0<br />
2,5<br />
2,0<br />
1,5<br />
1,0<br />
0,5<br />
0,0<br />
1,6<br />
4,0<br />
Red <strong>de</strong> Interés<br />
Preferente<br />
3,4<br />
2,5<br />
0,8<br />
1,5<br />
0,3<br />
0,8<br />
Red Básica Red Comarcal<br />
Á<strong>la</strong>va Bizkaia Gipuzkoa<br />
Fuente: E<strong>la</strong>boración propia a partir <strong>de</strong> datos <strong>de</strong> <strong>la</strong> Dirección General <strong>de</strong> Tráfico.<br />
En los Tres Territorios Históricos el valor <strong>de</strong>l número <strong>de</strong> acci<strong>de</strong>ntes con víctimas por kilómetro es mayor en<br />
<strong>la</strong>s carreteras <strong>de</strong> <strong>la</strong> Red <strong>de</strong> Interés Preferente, <strong>de</strong>stacando Bizkaia por ser don<strong>de</strong> este ratio es el mayor <strong>de</strong><br />
todos (4,0 acci<strong>de</strong>ntes con víctimas por kilómetro).<br />
En el caso <strong>de</strong> <strong>la</strong> Red Básica, también es Bizkaia don<strong>de</strong> el número <strong>de</strong> acci<strong>de</strong>ntes con víctimas por kilómetro<br />
es mayor que en los otros dos Territorios Históricos (2,5). A<strong>de</strong>más, en los tres Territorios, los ratios en <strong>de</strong><br />
acci<strong>de</strong>ntes con víctimas correspondientes a <strong>la</strong> <strong>red</strong> básica son superioes que los re<strong>la</strong>tivos a <strong>la</strong> Red Comarcal.<br />
Respecto a esta última, Bizkaia y Gipuzkoa presentan ratios <strong>de</strong> acci<strong>de</strong>ntes con vístimas por kilómetro muy<br />
simi<strong>la</strong>res (0,8 y 0,9, respectivamente).<br />
<strong>2.</strong>1.6.9. Tramos <strong>de</strong> Concentración <strong>de</strong> Acci<strong>de</strong>ntes<br />
Posibles TCA<br />
A partir <strong>de</strong> los partes <strong>de</strong> acci<strong>de</strong>ntes <strong>de</strong>l periodo comprendido entre los años 1999 y 2003, se han i<strong>de</strong>ntificado<br />
los tramos <strong>de</strong> carreteras susceptibles <strong>de</strong> ser Tramos <strong>de</strong> Concentración <strong>de</strong> Acci<strong>de</strong>ntes (TCA), <strong>de</strong>bido al<br />
elevado número <strong>de</strong> acci<strong>de</strong>ntes con víctimas que se producen en los mismos y <strong>de</strong>bido al índice <strong>de</strong><br />
peligrosidad en ese período, entendiendo como índice <strong>de</strong> peligrosidad (IP) <strong>la</strong> re<strong>la</strong>ción entre el número <strong>de</strong><br />
acci<strong>de</strong>ntes con víctimas y los vehículos por kilómetro.<br />
Se han <strong>de</strong>terminado 351 posibles tramos repartidos <strong>de</strong> <strong>la</strong> siguiente forma según <strong>la</strong> <strong>red</strong> a que pertenecen y <strong>la</strong><br />
tipología <strong>de</strong> calzada:<br />
0,9<br />
107<br />
Revisión <strong>de</strong>l Segundo P<strong>la</strong>n General <strong>de</strong> Carreteras <strong>de</strong>l País Vasco
DISTRIBUCIÓN DE POSIBLES TCA EN LA RED FUNCIONAL<br />
Tipo <strong>de</strong> vía<br />
Red <strong>de</strong> Interés<br />
Preferente<br />
Red Básica Red Comarcal<br />
Autopistas 75 9 -<br />
Autovías y Vías <strong>de</strong> Doble Calzada 61 8 -<br />
Calzada Única 48 116 33<br />
Total 184 133 33<br />
Definición y requisitos <strong>de</strong> un TCA<br />
Fuente: E<strong>la</strong>boración propia a partir <strong>de</strong> datos <strong>de</strong> <strong>la</strong> Dirección General <strong>de</strong> Tráfico.<br />
Los Tramos <strong>de</strong> Concentración <strong>de</strong> Acci<strong>de</strong>ntes (TCA) son tramos <strong>de</strong> <strong>la</strong> <strong>red</strong> <strong>de</strong> carreteras con elevada<br />
siniestralidad, registrando en su longitud un elevado número <strong>de</strong> acci<strong>de</strong>ntes con victimas y <strong>de</strong>pendientes <strong>de</strong><br />
<strong>la</strong> IMD <strong>de</strong>l tramo <strong>de</strong> carretera consi<strong>de</strong>rado.<br />
Todos los tramos i<strong>de</strong>ntificados como posibles TCA <strong>de</strong>ben ser <strong>de</strong> 1 kilómetro <strong>de</strong> longitud. Sin embargo, en<br />
caso <strong>de</strong> i<strong>de</strong>ntificarse varios posibles TCAs so<strong>la</strong>pados, su estudio se realiza <strong>de</strong> forma conjunta, lo que da lugar<br />
al estudio <strong>de</strong> un tramo <strong>de</strong> longitud superior a un kilómetro.<br />
La i<strong>de</strong>ntificación <strong>de</strong> estos TCA, unida al <strong>análisis</strong> <strong>de</strong> <strong>la</strong> tipología <strong>de</strong> acci<strong>de</strong>ntes que se producen en ellos,<br />
permite <strong>de</strong>terminar <strong>la</strong>s medidas correctoras encaminadas a eliminar estos puntos <strong>de</strong> elevada siniestralidad<br />
<strong>de</strong> <strong>la</strong> <strong>red</strong> <strong>de</strong> carreteras, realizando si se consi<strong>de</strong>ra oportuno los perceptivos estudios específicos <strong>de</strong> los TCA y<br />
en su caso, para llevar a cabo los proyectos <strong>de</strong> Seguridad Vial.<br />
Siguiendo <strong>la</strong>s indicaciones <strong>de</strong> <strong>la</strong> Dirección <strong>de</strong>l Estudio, se consi<strong>de</strong>ran como TCA aquellos tramos que cumplen<br />
con los siguientes condicionantes:<br />
√ Se cump<strong>la</strong> estrictamente <strong>la</strong>s siguientes condiciones:<br />
siendo:<br />
IPM 5 ≥ P y ΣACV 5 ≥ N<br />
IPM5, el Índice <strong>de</strong> Peligrosidad medio en los últimos cinco años (ACV x 10 8 / veh x km). Cuando a lo <strong>la</strong>rgo<br />
<strong>de</strong>l período <strong>de</strong> cinco años se hayan producido modificaciones sensibles en <strong>la</strong>s características físicas o <strong>de</strong><br />
tráfico el tramo, se consi<strong>de</strong>rará el índice <strong>de</strong> peligrosidad medio y los acci<strong>de</strong>ntes <strong>de</strong>l período en el que el<br />
tramo haya permanecido en su configuración <strong>actual</strong>.<br />
Σ ACV5, <strong>la</strong> suma <strong>de</strong> los acci<strong>de</strong>ntes <strong>de</strong> los últimos cinco años.<br />
√ Cump<strong>la</strong> algunos <strong>de</strong> los siguientes criterios:<br />
siendo:<br />
Criterio I: IP2002 P/2 y IP2003 P/2<br />
Criterio II: IPM2 2P/3<br />
Criterio III: ΣACV2002 N/5 y ΣACV2003 N/5<br />
Criterio IV: ΣACV2 N/2<br />
IP2002 e IP2003 los Índices <strong>de</strong> peligrosidad en ese tramo <strong>de</strong> los años 2002 y 2003 respectivamente.<br />
ΣACV2002 y ΣACV2003 los acci<strong>de</strong>ntes con víctimas producidos en ese tramo durante los años 2002 y 2003<br />
respectivamente.<br />
IPM2, el Índice <strong>de</strong> Peligrosidad medio <strong>de</strong> los dos últimos años.<br />
ΣACV2, <strong>la</strong> suma <strong>de</strong> acci<strong>de</strong>ntes <strong>de</strong> los dos últimos años.<br />
El hecho <strong>de</strong> cumplir <strong>la</strong>s dos condiciones obligatorias y uno <strong>de</strong> los criterios anteriores, <strong>de</strong>terminará que ese<br />
punto es un TCA.<br />
Cálculo <strong>de</strong> P y N<br />
La <strong>de</strong>terminación <strong>de</strong> los valores <strong>de</strong> <strong>la</strong>s constantes P y N es <strong>de</strong>pendiente <strong>de</strong> tres factores:<br />
√ Tipo <strong>de</strong> vía: Se distingue entre vías <strong>de</strong> gran capacidad (autopistas, autovías y carreteras <strong>de</strong>sdob<strong>la</strong>das)<br />
y carreteras convencionales.<br />
√ Tipo <strong>de</strong> Red: Se separan los tramos pertenecientes a <strong>la</strong> Red <strong>de</strong> Interés Preferente <strong>de</strong> los <strong>de</strong> <strong>la</strong> Red<br />
Básica y <strong>de</strong> los <strong>de</strong> <strong>la</strong> Red Comarcal.<br />
√ IMD existente: Para vías <strong>de</strong> gran capacidad y carreteras convencionales, se distribuyen <strong>la</strong>s carreteras<br />
en siete tramos <strong>de</strong> IMD diferentes en cada caso.<br />
El cálculo <strong>de</strong> P se realiza con los Índices <strong>de</strong> Peligrosidad <strong>de</strong> todos los tramos con características semejantes,<br />
siendo <strong>la</strong> suma <strong>de</strong> <strong>la</strong> media <strong>de</strong> <strong>la</strong> serie y su <strong>de</strong>sviación típica.<br />
El cálculo <strong>de</strong> N se obtiene con el número <strong>de</strong> acci<strong>de</strong>ntes con victimas por kilómetro <strong>de</strong> todos los tramos <strong>de</strong><br />
características semejantes, siendo <strong>la</strong> suma <strong>de</strong> <strong>la</strong> media <strong>de</strong> cada serie con su <strong>de</strong>sviación típica.<br />
Las diferentes medias, <strong>de</strong>sviaciones típicas y valores <strong>de</strong> P y N registrados en <strong>la</strong>s carreteras <strong>de</strong> <strong>la</strong> Red<br />
Funcional <strong>de</strong>l P<strong>la</strong>n, se muestran a continuación:<br />
108<br />
Revisión <strong>de</strong>l Segundo P<strong>la</strong>n General <strong>de</strong> Carreteras <strong>de</strong>l País Vasco
AUTOPISTAS, AUTOVÍAS Y CARRETERAS DESDOBLADAS: VALORES MEDIOS DE P Y N<br />
IMD<br />
IMD<br />
Red <strong>de</strong> Interés Preferente Red Básica<br />
P media N media P media N media<br />
0 – 5.000 96,28 0,43 - -<br />
5.001 - 10.000 43,67 1,06 53,96 1,77<br />
10.001 - 15.000 53,11 2,44 4,98 0,26<br />
15.001 - 20.000 45,15 2,81 35,42 2,13<br />
20.001 - 30.000 42,39 3,96 28,31 2,32<br />
30.001 - 40.000 19,75 2,55 56,21 4,90<br />
> 40.000 35,52 9,99 39,75 12,63<br />
Fuente: E<strong>la</strong>boración propia.<br />
CARRETERAS CONVENCIONALES: VALORES MEDIOS DE P Y N<br />
Red <strong>de</strong> Interés Preferente Red Básica Red Comarcal<br />
P media N media P media N media P media N media<br />
0 - 1.000 - - - - 53,33 0,14<br />
1.001 - 3.000 74,05 0,60 76,08 0,61 34,84 0,26<br />
3.001 - 6.000 93,01 1,43 40,75 0,65 52,20 0,79<br />
6.001 - 8.000 49,54 1,22 64,73 1,68 57,81 1,51<br />
8.001 - 10.000 83,54 2,80 47,07 1,61 51,62 1,65<br />
10.001 - 1<strong>2.</strong>000 50,65 1,94 29,14 1,19 46,91 1,86<br />
1<strong>2.</strong>001 - 15.000 68,01 3,42 48,74 2,38 64,85 3,25<br />
> 15.000 31,72 2,89 48,51 3,46 36,11 3,26<br />
Fuente: E<strong>la</strong>boración propia.<br />
AUTOPISTAS, AUTOVÍAS Y CARRETERAS DESDOBLADAS: DESVIACIONES TÍPICAS DE P Y N<br />
IMD<br />
IMD<br />
Red <strong>de</strong> Interés Preferente Red Básica<br />
D. Típica P D. Típica N D. Típica P D. Típica N<br />
0 - 5.000 196,34 0,74 - -<br />
5.001 - 10.000 13,41 0,08 76,31 2,51<br />
10.001 - 15.000 49,05 2,16 7,04 0,37<br />
15.001 - 20.000 43,13 2,66 15,92 0,80<br />
20.001 - 30.000 109,38 10,14 16,42 0,96<br />
30.001 - 40.000 16,33 2,22 43,09 4,34<br />
> 40.000 22,55 8,08 24,36 7,63<br />
Fuente: E<strong>la</strong>boración propia.<br />
CARRETERAS CONVENCIONALES: DESVIACIONES TÍPICAS DE P Y N<br />
Red <strong>de</strong> Interés Preferente Red Básica Red Comarcal<br />
D. Típica P D. Típica N D. Típica P D. Típica N D. Típica P D. Típica N<br />
0 – 1.000 - - - - 59,52 0,18<br />
1.001 - 3.000 67,79 0,68 153,10 1,27 41,76 0,33<br />
3.001 - 6.000 94,72 1,44 40,47 0,67 32,20 0,46<br />
6.001 - 8.000 50,75 1,29 59,85 1,50 50,67 1,38<br />
8.001 - 10.000 81,54 2,57 33,34 1,12 21,91 0,72<br />
10.001 - 1<strong>2.</strong>000 38,90 1,43 18,18 0,75 13,10 0,59<br />
1<strong>2.</strong>001 - 15.000 98,13 5,03 28,99 1,48 12,73 0,35<br />
> 15.000 42,46 3,95 45,49 2,85 2,13 0,57<br />
Fuente: E<strong>la</strong>boración propia.<br />
109<br />
Revisión <strong>de</strong>l Segundo P<strong>la</strong>n General <strong>de</strong> Carreteras <strong>de</strong>l País Vasco
IMD<br />
AUTOPISTAS, AUTOVÍAS Y CARRETERAS DESDOBLADAS: VALORES DE P Y N<br />
IMD<br />
Red <strong>de</strong> Interés Preferente Red Básica<br />
P N P N<br />
0 – 5.000 292,62 1,18 - -<br />
5.001 – 10.000 57,08 1,13 130,27 4,28<br />
10.001 - 15.000 102,16 4,60 12,01 0,64<br />
15.001 - 20.000 88,28 5,47 51,35 2,94<br />
20.001 - 30.000 151,77 14,10 44,73 3,28<br />
30.001 - 40.000 36,08 4,78 99,30 9,24<br />
> 40.000 58,07 18,07 64,10 20,26<br />
Fuente: E<strong>la</strong>boración propia.<br />
CARRETERAS CONVENCIONALES: VALORES DE P Y N<br />
Red <strong>de</strong> Interés Preferente Red Básica Red Comarcal<br />
P N P N P P<br />
0 - 1.000 - - - - 112,85 0,31<br />
1.001 - 3.000 141,84 1,28 229,19 1,88 76,60 0,59<br />
3001 - 6.000 187,74 2,87 81,23 1,32 84,40 1,25<br />
6.001 - 8.000 100,30 2,51 124,58 3,18 108,48 2,89<br />
8.001 - 10.000 165,08 5,37 80,41 2,73 73,53 2,37<br />
10.001 - 1<strong>2.</strong>000 89,55 3,37 47,32 1,94 60,01 2,45<br />
1<strong>2.</strong>001 - 15.000 166,14 8,46 77,72 3,86 77,58 3,60<br />
> 15.000 74,18 6,85 94,01 6,31 38,25 3,83<br />
Fuente: E<strong>la</strong>boración propia.<br />
I<strong>de</strong>ntificación <strong>de</strong> TCA<br />
La aplicación <strong>de</strong> los criterios que se acaban <strong>de</strong> citar a los 350 posibles Tramos <strong>de</strong> Concentración <strong>de</strong><br />
Acci<strong>de</strong>ntes da como resultado que sean 89 los tramos que cumplen los requisitos establecidos y pasen a<br />
tener <strong>la</strong> <strong>de</strong>nominación <strong>de</strong> TCA. Estos 89 tramos, se reparten por <strong>la</strong>s carreteras <strong>de</strong> <strong>la</strong> Red Funcional <strong>de</strong> <strong>la</strong><br />
siguiente manera:<br />
Tipo <strong>de</strong> vía<br />
DISTRIBUCIÓN DE LOS TCA EN LA RED FUNCIONAL<br />
Red <strong>de</strong> Interés<br />
Preferente<br />
Red Básica Red Comarcal<br />
Autopistas 6 0 -<br />
Autovías y Vías <strong>de</strong> Doble Calzada 10 2 -<br />
Calzada Única 11 33 26<br />
Total 28 35 26<br />
Fuente: E<strong>la</strong>boración propia.<br />
Los TCA, no se distribuyen homogéneamente por los diferentes rangos <strong>de</strong> IMD, tal y como se observa en <strong>la</strong><br />
tab<strong>la</strong> y gráficos adjuntos:<br />
DISTRIBUCIÓN DE TCA POR RANGOS DE IMD EN AUTOPISTAS, AUTOVÍAS Y VÍAS DE DOBLE<br />
CALZADA<br />
IMD<br />
Autopistas Autovías y Vías <strong>de</strong> Doble Calzada<br />
Red Preferente Red Básica Red Preferente Red Básica<br />
0 - 5.000 1 0 0 0<br />
5.001 - 10.000 0 0 0 1<br />
10.001 - 15.000 0 0 1 1<br />
15.001 - 20.000 0 0 0 0<br />
20.001 - 30.000 0 0 0 0<br />
30.001 - 40.000 1 0 6 0<br />
> 40.000 4 0 3 0<br />
Fuente: E<strong>la</strong>boración propia.<br />
110<br />
Revisión <strong>de</strong>l Segundo P<strong>la</strong>n General <strong>de</strong> Carreteras <strong>de</strong>l País Vasco
DISTRIBUCIÓN DE TCA POR RANGOS DE IMD EN CARRETERAS CONVENCIONALES<br />
IMD Red Preferente Red Básica Red Comarcal<br />
0 - 3.000 2 0 3<br />
3.001 - 6.000 2 16 13<br />
6.001 - 8.000 0 2 4<br />
8.001 - 10.000 0 4 2<br />
10.001 - 1<strong>2.</strong>000 3 4 1<br />
1<strong>2.</strong>001 - 15.000 1 7 1<br />
> 15.000 3 0 2<br />
Fuente: E<strong>la</strong>boración propia.<br />
El <strong>análisis</strong> <strong>de</strong> estos datos atendiendo únicamente a <strong>la</strong> tipología <strong>de</strong> calzada, permite extraer <strong>la</strong>s siguientes<br />
conclusiones:<br />
√ Los TCA en vías <strong>de</strong> gran capacidad (autopistas, autovías y vías <strong>de</strong> doble calzada) <strong>de</strong> <strong>la</strong> Red Funcional,<br />
se concentran en los tramos <strong>de</strong> IMD inferiores y superiores, no existiendo TCA en los tramos <strong>de</strong> IMD<br />
intermedia (entre 10.000 vehículos / día y 30.000 vehículos / día). Son <strong>la</strong>s dos horquil<strong>la</strong>s superiores, <strong>la</strong><br />
que representan valores <strong>de</strong> IMD mayor a 30.000 vehículos / día, aquel<strong>la</strong>s don<strong>de</strong> se concentran el 84% <strong>de</strong><br />
los TCA <strong>de</strong> vías <strong>de</strong> gran capacidad.<br />
√ La distribución <strong>de</strong> los TCA <strong>de</strong> <strong>la</strong> Red Funcional en carreteras convencionales es más dispersa, si bien<br />
casi el 50% <strong>de</strong> ellos se encuentran en <strong>la</strong>s dos bandas inferiores <strong>de</strong> IMD (hasta 6.000 vehículos / día.),<br />
agrupándose el 38,5% <strong>de</strong> <strong>la</strong> totalidad en <strong>la</strong> banda <strong>de</strong> IMD entre 3.001 y 6.000 vehículos / día.<br />
Finalmente, se presenta a continuación un listado <strong>de</strong> los TCA obtenidos en <strong>la</strong>s carreteras <strong>de</strong> <strong>la</strong> Red<br />
Funcional, indicando entre que P.K.s se ubican y sus índices <strong>de</strong> peligrosidad.<br />
111<br />
Revisión <strong>de</strong>l Segundo P<strong>la</strong>n General <strong>de</strong> Carreteras <strong>de</strong>l País Vasco
Carretera P.K. inicio P.K. final IP 1999 IP 2000 IP 2001 IP 2002 IP 2003<br />
Red <strong>de</strong> Interés Preferente<br />
A-8 16,9 18,0 6,8 6,3 97,6 53,0 33,6<br />
A-8 20,5 21,9 30,1 39,2 130,4 77,3 45,3<br />
A-8 113,4 115,1 41,5 52,2 66,9 85,1 71<br />
A-8 121,4 123,1 40,7 54,8 80,4 108,2 133,2<br />
A-8 135,2 137,0 48,6 74,1 57,5 61,9 95,2<br />
N-I 327,0 328,0 28,7 34,2 0 65,6 57,1<br />
N-I 328,1 329,1 35,9 47,8 32,5 183,5 126,9<br />
N-I 431,0 432,1 5,9 17,1 58,9 85,4 117<br />
N-I 463,6 464,5 30,7 55,5 109,4 89,6 63,4<br />
N-124 28,3 29,4 41,9 190,2 100,7 209 79,6<br />
N-124 32,7 33,8 143,8 105,7 120,9 289,1 59,3<br />
N-240 14,6 15,6 140,2 58,6 99,5 80,8 171,7<br />
N-240 16,6 17,6 160,2 78,1 116 80,8 133,5<br />
N-240 20,5 21,5 306,8 259,1 161 99,6 196<br />
N-634 128,0 129,0 207,6 187,1 199,5 205,2 187,8<br />
N-634 131,8 133,0 343,1 206,5 250 99 158,6<br />
N-634 84,0 85,1 69,9 51,4 70,9 96,6 99,7<br />
N-634 94,9 95,9 67,2 81 107,6 81,9 57,2<br />
N-634 98,5 99,5 21,6 38 63,7 47,2 27<br />
N-634 99,7 101,0 54 114,1 153,9 62,9 75,6<br />
N-634 101,7 103,1 42 78,6 68,9 49,4 117,8<br />
N-634 103,6 104,6 82,3 130,7 67,3 115,3 75,5<br />
N-634 104,9 106,0 77,8 91,6 81,2 73,7 81,3<br />
N-638 1,0 2,0 18,6 48,8 119,7 160,9 141,3<br />
N-639 16,0 17,0 80,5 149,6 263,2 241,2 152,7<br />
N-639 20,0 21,1 321,9 149,6 351 241,2 76,3<br />
TCA EN LAS CARRETERAS DE LA RED FUNCIONAL<br />
Carretera<br />
Red Básica<br />
P.K. inicio P.K. final IP 1999 IP 2000 IP 2001 IP 2002 IP 2003<br />
A-124 62,8 63,8 0 83,2 86,7 336,1 116<br />
A-124 73,5 74,6 130,4 61,6 245,6 243,6 57,3<br />
A-132 7,8 8,9 79,7 102,3 44,2 627,4 95,5<br />
A-132 22,9 23,9 65,3 0 63,3 373,3 0<br />
A-623 18,6 19,7 0 0 94,7 492,6 0<br />
A-624 24,3 25,3 108,6 57,4 138,8 277,1 189,6<br />
A-624 30,1 31,2 0 51,9 0 312,8 48,9<br />
A-624 33,0 34,0 0 0 0 417,1 48,9<br />
A-624 38,8 40,0 0 0 82 453,4 67,1<br />
A-625 360,8 361,9 49,3 119,5 154,3 83,2 41,1<br />
A-625 371,1 372,3 19 0 91,9 33 29,1<br />
A-625 354,2 355,4 54,1 104 53,3 350 87,8<br />
A-625 356,1 357,2 162,4 104 106,5 559,6 219,6<br />
A-627 15,1 16,1 72,2 73,4 46,9 286,3 45,2<br />
A-627 17,1 18,1 100,9 122,3 23,5 147,4 90,5<br />
BI-623 27,8 29,2 333,1 73,6 196,5 117 234<br />
BI-623 39,6 40,7 130,2 59,4 283,6 226,9 229,3<br />
BI-625 374,9 375,9 36 58,6 19,7 96,2 37<br />
BI-625 377,3 378,3 100,9 53,7 89,2 52,3 101,4<br />
BI-631 28,5 29,9 57,7 0 97,4 93,7 316,6<br />
BI-633 32,0 33,0 51,5 45,5 77,2 77,2 56,6<br />
BI-633 42,8 43,8 210,9 206,5 154,2 89,9 29,4<br />
BI-633 51,0 52,0 75,5 113,3 75,5 75,5 144,8<br />
BI-634 19,8 20,5 0,00 47,39 409,83 104,75 103,21<br />
BI-634 20,9 21,7 93,80 100,40 90,67 44,37 0,00<br />
BI-635 23,4 24,4 65,7 83,5 64,9 112,7 132<br />
BI-635 24,5 25,5 65,7 150,2 210,9 128,8 66<br />
BI-635 25,9 27,0 180,7 133,5 0 80,5 158,5<br />
BI-635 27,5 28,5 53,5 120,6 66,5 16,3 63,4<br />
BI-636 32,0 33,0 36,5 108,9 179,7 126 184,2<br />
GI-131 0,3 1,3 192,8 87,8 33,6 127,8 113,8<br />
GI-627 18,1 19,1 0 69,4 95,6 192,4 124,3<br />
GI-627 28,8 30,0 153,6 67,7 127,6 65,5 161,7<br />
GI-631 3,8 4,8 20,8 61,9 79,6 100,1 38,5<br />
GI-638 0,1 1,1 83,8 0 92,1 211,8 40,3<br />
112<br />
Revisión <strong>de</strong>l Segundo P<strong>la</strong>n General <strong>de</strong> Carreteras <strong>de</strong>l País Vasco
TCA EN LAS CARRETERAS DE LA RED FUNCIONAL<br />
Carretera P.K. inicio P.K. final IP 1999 IP 2000 IP 2001 IP 2002 IP 2003<br />
Red Comarcal<br />
A-2122 38,8 39,9 38,96 20,06 37,48 83,87 68,40<br />
A-2124 4,1 4,7 44,32 97,55 39,76 23,20 82,74<br />
A-2134 0,6 1,0 131,34 116,06 157,98 150,59 157,43<br />
A-2622 10,0 10,9 105,01 0,00 268,86 196,26 251,93<br />
A-2622 13,8 15,1 185,12 0,00 0,00 458,81 163,03<br />
A-2622 35,4 36,6 185,12 79,64 334,32 65,54 244,55<br />
BI-2122 21,1 22,1 0,00 0,00 160,36 51,34 134,56<br />
BI-2235 37,5 38,2 226,42 50,59 0,00 145,34 146,85<br />
BI-2235 38,6 39,5 0,00 78,98 225,96 79,85 120,99<br />
BI-2235 42,9 44,0 0,00 129,48 99,51 134,70 132,03<br />
BI-2235 44,5 45,4 0,00 135,90 235,89 66,86 131,55<br />
BI-2238 52,3 52,5 0,00 112,12 74,14 220,65 253,24<br />
BI-2604 21,1 22,0 0,00 0,00 257,49 0,00 253,68<br />
BI-2701 21,0 21,8 106,31 96,30 95,10 290,02 187,40<br />
BI-2701 29,0 29,9 52,76 42,29 161,73 91,31 60,96<br />
BI-2701 31,0 31,8 137,10 129,68 45,71 88,36 127,49<br />
BI-2701 34,0 34,7 295,02 308,64 401,28 289,82 87,95<br />
BI-2704 8,7 9,5 203,77 99,23 93,89 180,01 269,13<br />
BI-2704 14,0 14,7 0,00 93,55 139,50 157,99 105,61<br />
BI-2704 20,4 21,4 115,47 436,19 131,85 416,50 255,19<br />
BI-2704 22,0 23,0 0,00 226,95 143,39 358,07 138,21<br />
GI-2132 0,0 1,2 95,93 107,27 83,56 80,12 175,79<br />
GI-2132 13,8 15,0 175,87 61,29 111,41 146,90 54,09<br />
GI-2630 19,0 19,9 0,00 137,23 156,26 64,43 215,79<br />
GI-2633 3,4 4,4 44,91 80,05 212,69 112,75 94,41<br />
GI-2634 37,0 38,0 94,91 23,11 93,92 100,77 118,63<br />
Fuente: E<strong>la</strong>boración propia.<br />
La herramienta GIS (Sistema <strong>de</strong> Información Geográfica ArcMap) <strong>de</strong>sarrol<strong>la</strong>da permite <strong>la</strong> visualización <strong>de</strong> los<br />
TCAs. A continuación se muestra un ejemplo <strong>de</strong> TCA en <strong>la</strong> carretera <strong>de</strong> <strong>la</strong> Red Básica <strong>de</strong> Bizkaia, <strong>la</strong> BI-631.<br />
La información re<strong>la</strong>cionada con el TCA es su ubicación (P.K. <strong>de</strong> inicio y P.K. <strong>de</strong> fin), el número <strong>de</strong> acci<strong>de</strong>ntes<br />
con víctimas, <strong>la</strong> IMD y por último el Índice <strong>de</strong> Peligrosidad, todo ello para el período 1999 - 2003<br />
Fuente: E<strong>la</strong>boración propia.<br />
113<br />
Revisión <strong>de</strong>l Segundo P<strong>la</strong>n General <strong>de</strong> Carreteras <strong>de</strong>l País Vasco
<strong>2.</strong>1.7 Intersecciones y en<strong>la</strong>ces. Continuidad <strong>de</strong>l tráfico<br />
<strong>2.</strong>1.7.1. Red Objeto <strong>de</strong>l P<strong>la</strong>n<br />
A fin <strong>de</strong> concretar <strong>la</strong> continuidad <strong>de</strong> tráfico así como <strong>la</strong> conflictividad <strong>de</strong>ntro <strong>de</strong> <strong>la</strong> Red Objeto se ha<br />
establecido una c<strong>la</strong>sificación <strong>de</strong> <strong>la</strong>s intersecciones y en<strong>la</strong>ces basada en <strong>la</strong>s diferentes posibilida<strong>de</strong>s que<br />
limitan o facilitan el flujo circu<strong>la</strong>torio <strong>de</strong>ntro <strong>de</strong> <strong>la</strong> Red. Esta c<strong>la</strong>sificación seña<strong>la</strong> en primer lugar el sentido en<br />
el que se encuentra <strong>la</strong> intersección, divi<strong>de</strong> <strong>la</strong>s intersecciones en grupos y subgrupos que reflejan <strong>la</strong> flui<strong>de</strong>z y<br />
conflictividad <strong>de</strong> <strong>la</strong>s salidas e incorporaciones a <strong>la</strong> vía y distingue aparte <strong>la</strong>s glorietas y los cambios <strong>de</strong><br />
sentido a fin <strong>de</strong> reflejar un mo<strong>de</strong>lo orgánico que contemple todos los movimientos posibles.<br />
A continuación se <strong>de</strong>tal<strong>la</strong>n <strong>la</strong>s tipologías <strong>de</strong> intersecciones y en<strong>la</strong>ces, correspondiendo a cada una <strong>de</strong> el<strong>la</strong>s un<br />
código in<strong>de</strong>pendiente:<br />
√ Con respecto al giro a <strong>la</strong> <strong>de</strong>recha se pue<strong>de</strong> distinguir entre intersecciones sin canalizar e<br />
intersecciones canalizadas. Dentro <strong>de</strong> ambas categorías, y en referencia al posible giro a <strong>la</strong> izquierda, se<br />
distinguen, a<strong>de</strong>más, <strong>la</strong>s siguientes posibilida<strong>de</strong>s:<br />
• Intersección sin posibilidad <strong>de</strong> giro a <strong>la</strong> izquierda.<br />
• Intersección con posibilidad <strong>de</strong> giro a <strong>la</strong> izquierda sin carril <strong>de</strong> espera en tronco o raqueta exterior.<br />
• Intersección con carril <strong>de</strong> espera en <strong>la</strong> vía principal.<br />
• Intersección con carril <strong>de</strong> espera y carril <strong>de</strong> incorporación en <strong>la</strong> vía principal.<br />
• Intersección con raqueta exterior.<br />
√ Cruces: <strong>la</strong> tipología <strong>de</strong>l cruce se obtiene analizando <strong>la</strong> intersección en sentido ascen<strong>de</strong>nte y<br />
<strong>de</strong>scen<strong>de</strong>nte por separado. Dentro <strong>de</strong> esta codificación un cruce se compone <strong>de</strong> dos intersecciones.<br />
√ Glorietas.<br />
√ Glorietas partidas.<br />
√ Cambios <strong>de</strong> sentido.<br />
√ Ramal <strong>de</strong> entrada sin carril <strong>de</strong> aceleración.<br />
√ Ramal <strong>de</strong> salida sin carril <strong>de</strong> <strong>de</strong>celeración.<br />
√ Ramal <strong>de</strong> entrada con carril <strong>de</strong> aceleración.<br />
√ Ramal <strong>de</strong> salida con carril <strong>de</strong> <strong>de</strong>celeración.<br />
√ Carril <strong>de</strong> trenzado.<br />
Con objeto <strong>de</strong> facilitar <strong>la</strong> c<strong>la</strong>sificación <strong>de</strong> <strong>la</strong>s intersecciones según su tipología y por tanto mejorar su<br />
interpretación, se han distinguido dos casos según sea su permisividad <strong>de</strong> giro a <strong>la</strong> izquierda:<br />
√ En el primero <strong>de</strong> ellos se han incluido aquel<strong>la</strong>s intersecciones en <strong>la</strong>s que cuando el vehículo gira a <strong>la</strong><br />
izquierda interrumpe <strong>la</strong> fluida circu<strong>la</strong>ción <strong>de</strong> <strong>la</strong> carretera (intersección sin posibilidad <strong>de</strong> giro a <strong>la</strong><br />
izquierda, intersección con posibilidad <strong>de</strong> giro a <strong>la</strong> izquierda sin carril <strong>de</strong> espera en tronco o raqueta<br />
exterior).<br />
√ Y en el segundo grupo, aquel<strong>la</strong>s intersecciones en <strong>la</strong>s que el giro a <strong>la</strong> izquierda por parte <strong>de</strong> los<br />
vehículos que circu<strong>la</strong>n por <strong>la</strong> vía principal no supone ninguna interrupción al tráfico (intersección con<br />
carril <strong>de</strong> espera en <strong>la</strong> vía principal, intersección con carril <strong>de</strong> espera y carril <strong>de</strong> incorporación en <strong>la</strong> vía<br />
principal, intersección con raqueta exterior, glorietas y glorietas partidas). Las intersecciones incluidas en<br />
este grupo permiten una mayor flui<strong>de</strong>z <strong>de</strong>l tráfico y canalizan en todos los casos los cruces entre flujos.<br />
Para <strong>la</strong> siguiente representación, a <strong>la</strong>s intersecciones que forman parte <strong>de</strong>l primer grupo se <strong>la</strong>s ha<br />
<strong>de</strong>nominado “A” y <strong>la</strong>s incluidas en el segundo <strong>de</strong> ellos “B”.<br />
Se presenta a continuación el número <strong>de</strong> intersecciones existentes, y por tipología, en <strong>la</strong>s carreteras <strong>de</strong> <strong>la</strong><br />
Red Objeto que tienen intersecciones a nivel:<br />
115<br />
Revisión <strong>de</strong>l Segundo P<strong>la</strong>n General <strong>de</strong> Carreteras <strong>de</strong>l País Vasco
INTERSECCIONES SEGÚN TIPOLOGÍA EN LAS CARRETERAS DE LA RED OBJETO<br />
Carretera (2) Nº Intersecciones tipo “A” Nº Intersecciones tipo “B”<br />
Red <strong>de</strong> Interés Preferente<br />
N-I 6 6<br />
N-102 0 2<br />
N-104 4 3<br />
N-121-A 1 0<br />
Red Básica<br />
N-124 4 2<br />
N-240 18 13<br />
N-624 0 1<br />
N-629 5 0<br />
N-634 55 40<br />
N-636 17 12<br />
N-638 6 2<br />
N-639 5 6<br />
A-124 22 3<br />
A-132 13 10<br />
A-623 2 0<br />
A-624 19 6<br />
A-625 7 1<br />
A-627 8 2<br />
BI-604 0 2<br />
BI-623 6 6<br />
BI-624 1 0<br />
BI-625 10 8<br />
BI-630 18 0<br />
BI-631 22 5<br />
BI-633 43 19<br />
BI-635 30 2<br />
BI-636 5 7<br />
BI-637 0 3<br />
GI-131 9 10<br />
GI-627 6 12<br />
GI-631 26 12<br />
GI-638 8 3<br />
Total 376 198<br />
Fuente: E<strong>la</strong>boración propia<br />
2<br />
Las carreteras N-622, N-633, N-637, N-644 y BI-638 no figuran en <strong>la</strong> presente re<strong>la</strong>ción ya que no presentan intersecciones a nivel.<br />
Por otra parte, no existen datos <strong>de</strong> <strong>la</strong> carretera BI-639.<br />
Se observa que p<strong>red</strong>ominan <strong>la</strong>s intersecciones en <strong>la</strong>s que no está canalizado el giro a <strong>la</strong> izquierda; es <strong>de</strong>cir,<br />
el vehículo en caso <strong>de</strong> querer hacer esta maniobra interrumpe <strong>la</strong> circu<strong>la</strong>ción en <strong>la</strong> vía principal. Respecto al<br />
total <strong>de</strong> intersecciones a nivel (574), <strong>la</strong>s incluidas en este grupo suponen el 65,5%.<br />
Por el contrario, <strong>la</strong>s intersecciones que permiten una mayor flui<strong>de</strong>z <strong>de</strong>l tráfico, ya que o bien disponen <strong>de</strong><br />
carril <strong>de</strong> espera en el tronco o raquetas <strong>de</strong> giro o bien se resuelven mediante glorietas, son menos<br />
numerosas que <strong>la</strong>s anteriores y representan el 34,5% <strong>de</strong>l total <strong>de</strong> intersecciones existentes en <strong>la</strong> ROP.<br />
Se adjuntan seguidamente gráficos expresivos <strong>de</strong> <strong>la</strong> tipología <strong>de</strong> <strong>la</strong>s intersecciones existentes en <strong>la</strong> Red<br />
Objeto según <strong>la</strong> c<strong>la</strong>sificación <strong>de</strong> <strong>la</strong> <strong>red</strong>.<br />
INTERSECCIONES SEGÚN TIPOLOGÍA EN LA RED DE INTERÉS PREFERENTE<br />
60<br />
50<br />
40<br />
30<br />
20<br />
10<br />
0<br />
Intersecciones tipo A Intersecciones tipo B<br />
Fuente: E<strong>la</strong>boración propia<br />
INTERSECCIONES SEGÚN TIPOLOGÍA EN LA RED BÁSICA<br />
45<br />
40<br />
35<br />
30<br />
25<br />
20<br />
15<br />
10<br />
5<br />
0<br />
Intersecciones tipo A Intersecciones tipo B<br />
Fuente: E<strong>la</strong>boración propia<br />
116<br />
Revisión <strong>de</strong>l Segundo P<strong>la</strong>n General <strong>de</strong> Carreteras <strong>de</strong>l País Vasco
Un diagnóstico interesante en re<strong>la</strong>ción con <strong>la</strong>s intersecciones es el que hace referencia a <strong>la</strong> continuidad <strong>de</strong>l<br />
tráfico, que es un indicador útil <strong>de</strong> <strong>la</strong> comodidad <strong>de</strong> <strong>la</strong> conducción y que, a<strong>de</strong>más, se tiene en cuenta a <strong>la</strong><br />
hora <strong>de</strong>l cálculo <strong>de</strong> los niveles <strong>de</strong> servicio, ya que tiene influencia directa en el cálculo <strong>de</strong> <strong>la</strong> velocidad libre<br />
<strong>de</strong> cualquier tipo <strong>de</strong> vía, según el Manual <strong>de</strong> Capacidad <strong>de</strong> versión <strong>de</strong>l año 2000 (Highway Capacity Manual<br />
2000).<br />
Los gráficos siguientes muestran el porcentaje <strong>de</strong> tramos según su continuidad <strong>de</strong> tráfico y tipo <strong>de</strong> <strong>red</strong>,<br />
establecidos a partir <strong>de</strong> un baremo función <strong>de</strong> los tramos libres entre intersecciones existentes y según <strong>la</strong><br />
tipología <strong>de</strong> éstas.<br />
CONTINUIDAD DE TRÁFICO EN LA RED DE INTERÉS PREFERENTE<br />
2,2%<br />
14,2%<br />
Tramos con continuidad <strong>de</strong> tráfico<br />
83,6%<br />
Discontinuidad <strong>de</strong> tráfico en tramos con duplicación <strong>de</strong> calzadas<br />
Discontinuidad <strong>de</strong> tráfico en tramos sin duplicación <strong>de</strong> calzadas<br />
Fuente: E<strong>la</strong>boración propia<br />
47,0%<br />
CONTINUIDAD DE TRÁFICO EN LA RED BÁSICA<br />
2,0%<br />
Tramos con continuidad <strong>de</strong> tráfico<br />
Discontinuidad <strong>de</strong> tráfico en tramos con duplicación <strong>de</strong> calzadas<br />
Discontinuidad <strong>de</strong> tráfico en tramos sin duplicación <strong>de</strong> calzadas<br />
Fuente: E<strong>la</strong>boración propia<br />
Los tramos <strong>de</strong> <strong>la</strong> Red Objeto en régimen <strong>de</strong> flujo libre <strong>de</strong> circu<strong>la</strong>ción se encuentran re<strong>la</strong>cionados con<br />
aquellos que tienen duplicación <strong>de</strong> calzada.<br />
En <strong>la</strong> Red <strong>de</strong> Interés Preferente, <strong>la</strong> mayor parte <strong>de</strong> los tramos <strong>de</strong> autopista y vías <strong>de</strong> alta capacidad<br />
presentan continuidad <strong>de</strong> tráfico, a excepción <strong>de</strong> <strong>la</strong> N-I en el entorno <strong>de</strong> Donostia-San Sebastián y <strong>de</strong> <strong>la</strong> N-<br />
634 a su paso por el Bilbao Metropolitano. Respecto al resto <strong>de</strong> <strong>la</strong> RIP no duplicada, existe discontinuidad <strong>de</strong><br />
tráfico en un 67,5% <strong>de</strong> su longitud.<br />
Se adjunta a continuación p<strong>la</strong>no expresivo <strong>de</strong> los tramos <strong>de</strong> <strong>la</strong> Red Objeto que presentan discontinuidad <strong>de</strong><br />
tráfico.<br />
51,0%<br />
117<br />
Revisión <strong>de</strong>l Segundo P<strong>la</strong>n General <strong>de</strong> Carreteras <strong>de</strong>l País Vasco
<strong>2.</strong>1.7.<strong>2.</strong> Red Funcional<br />
A<strong>de</strong>más <strong>de</strong>l <strong>análisis</strong> realizado según tipología <strong>de</strong> intersección en <strong>la</strong>s carreteras <strong>de</strong> <strong>la</strong> Red Objeto, se han<br />
inventariado <strong>la</strong>s intersecciones por kilómetro <strong>de</strong> toda <strong>la</strong> Red Funcional:<br />
INTERSECCIONES POR KILÓMETRO EN LA RED FUNCIONAL<br />
Carretera (3) Nº Intersecciones / km<br />
Red <strong>de</strong> Interés Preferente<br />
Red Básica<br />
N-I 0,2<br />
N-102 0,4<br />
N-104 0,7<br />
N-121-A 0,1<br />
N-124 0,4<br />
N-240 0,7<br />
N-624 0,3<br />
N-629 1,3<br />
N-634 0,7<br />
N-636 0,6<br />
N-638 3,2<br />
N-639 1,3<br />
A-124 0,9<br />
A-126 1,4<br />
A-132 0,6<br />
A-623 0,3<br />
A-624 0,7<br />
A-625 0,4<br />
A-627 1,9<br />
BI-604 0,4<br />
BI-623 0,6<br />
BI-624 0,4<br />
BI-625 1,0<br />
BI-630 0,8<br />
BI-631 0,9<br />
BI-633 2,2<br />
BI-634 0,9<br />
BI-635 1,8<br />
BI-636 0,4<br />
BI-637 0,3<br />
3 Las carreteras GI-2620 y GI-2636 no presentan ninguna intersección.<br />
Red Comarcal<br />
Carretera (3) Nº Intersecciones / km<br />
GI-131 1,3<br />
GI-627 0,5<br />
GI-631 1,1<br />
GI-638 1,4<br />
A-2122 0,4<br />
A-2124 0,3<br />
A-2126 0,1<br />
A-2128 0,4<br />
A-2130 1,5<br />
A-2134 1,4<br />
A-2521 0,4<br />
A-2522 0,7<br />
A-2604 0,7<br />
A-2620 0,4<br />
A-2622 0,5<br />
A-2625 0,7<br />
BI-2121 0,5<br />
BI-2122 0,7<br />
BI-2224 0,4<br />
BI-2235 0,4<br />
BI-2238 0,5<br />
BI-2405 0,4<br />
BI-2521 0,7<br />
BI-2522 0,8<br />
BI-2543 0,2<br />
BI-2617 0,3<br />
BI-2625 2,9<br />
BI-2636 0,5<br />
BI-2701 0,8<br />
BI-2704 0,8<br />
BI-2713 0,4<br />
GI-2120 0,2<br />
GI-2130 0,3<br />
GI-2132 1,0<br />
GI-2135 0,2<br />
GI-2630 0,6<br />
GI-2633 0,2<br />
GI-2634 0,2<br />
Fuente: E<strong>la</strong>boración propia<br />
119<br />
Revisión <strong>de</strong>l Segundo P<strong>la</strong>n General <strong>de</strong> Carreteras <strong>de</strong>l País Vasco
Atendiendo al número <strong>de</strong> intersecciones por kilómetro, cabe indicar:<br />
√ P<strong>red</strong>ominan aquel<strong>la</strong>s carreteras en <strong>la</strong>s que dicha re<strong>la</strong>ción es inferior a uno; en concreto, consi<strong>de</strong>rando<br />
<strong>la</strong>s carreteras que presentan intersecciones a nivel, suponen el 66,8% <strong>de</strong> <strong>la</strong>s carreteras <strong>de</strong> <strong>la</strong> Red Objeto<br />
y el 77,9% <strong>de</strong> <strong>la</strong>s carreteras <strong>de</strong> <strong>la</strong> Red Funcional.<br />
√ Aquel<strong>la</strong>s carreteras que tienen entre una y dos intersecciones por kilómetro suponen, respecto a <strong>la</strong><br />
misma variable que en el caso anterior, el 25,0% en <strong>la</strong> Red Objeto y el 17,6% en <strong>la</strong> Red Funcional.<br />
√ Únicamente existen tres carreteras en <strong>la</strong> Red Funcional con más <strong>de</strong> dos intersecciones por kilómetro:<br />
<strong>la</strong> carretera N-638 (Red <strong>de</strong> Interés Preferente) que da acceso al Aeropuerto <strong>de</strong> Hondarribia, y que a lo<br />
<strong>la</strong>rgo <strong>de</strong> sus 2,5 kilómetros tiene un total <strong>de</strong> 8 intersecciones a nivel; <strong>la</strong> carretera BI-633 (Red Básica)<br />
con una longitud próxima a los 28 km y 62 intersecciones a nivel; y <strong>la</strong> carretera BI-2625 (Red Comarcal)<br />
con 2 intersecciones en 700 m <strong>de</strong> longitud.<br />
Se adjuntan a continuación gráficos expresivos <strong>de</strong> <strong>la</strong>s intersecciones por kilómetro existentes en <strong>la</strong> Red<br />
Funcional según tipo <strong>de</strong> <strong>red</strong>.<br />
INTERSECCIONES POR KILÓMETRO EN LA RED DE INTERÉS PREFERENTE<br />
3,5<br />
3,0<br />
2,5<br />
2,0<br />
1,5<br />
1,0<br />
0,5<br />
0,0<br />
Fuente: E<strong>la</strong>boración propia<br />
2,5<br />
2,0<br />
1,5<br />
1,0<br />
0,5<br />
0,0<br />
INTERSECCIONES POR KILÓMETRO EN LA RED BÁSICA<br />
Fuente: E<strong>la</strong>boración propia<br />
INTERSECCIONES POR KILÓMETRO EN LA RED COMARCAL DE ÁLAVA<br />
1,6<br />
1,4<br />
1,2<br />
1,0<br />
0,8<br />
0,6<br />
0,4<br />
0,2<br />
0,0<br />
Fuente: E<strong>la</strong>boración propia<br />
120<br />
Revisión <strong>de</strong>l Segundo P<strong>la</strong>n General <strong>de</strong> Carreteras <strong>de</strong>l País Vasco
INTERSECCIONES POR KILÓMETRO EN LA RED COMARCAL DE BIZKAIA<br />
3,0<br />
2,5<br />
2,0<br />
1,5<br />
1,0<br />
0,5<br />
0,0<br />
Fuente: E<strong>la</strong>boración propia<br />
INTERSECCIONES POR KILÓMETRO EN LA RED COMARCAL DE GIPUZKOA<br />
1,0<br />
0,9<br />
0,8<br />
0,7<br />
0,6<br />
0,5<br />
0,4<br />
0,3<br />
0,2<br />
0,1<br />
0,0<br />
Fuente: E<strong>la</strong>boración propia<br />
En los gráficos siguientes se muestran los porcentajes <strong>de</strong> continuidad <strong>de</strong> <strong>la</strong>s carreteras <strong>de</strong> <strong>la</strong> Red Funcional:<br />
CONTINUIDAD DE TRÁFICO EN LA RED DE INTERÉS PREFERENTE<br />
2,2%<br />
14,2%<br />
Tramos con continuidad <strong>de</strong> tráfico<br />
83,6%<br />
Discontinuidad <strong>de</strong> tráfico en tramos con duplicación <strong>de</strong> calzadas<br />
Discontinuidad <strong>de</strong> tráfico en tramos sin duplicación <strong>de</strong> calzadas<br />
Fuente: E<strong>la</strong>boración propia<br />
CONTINUIDAD DE TRÁFICO EN LA RED BÁSICA DE LA RED FUNCIONAL<br />
48,0%<br />
1,9%<br />
Tramos con continuidad <strong>de</strong> tráfico<br />
Discontinuidad <strong>de</strong> tráfico en tramos con duplicación <strong>de</strong> calzadas<br />
Discontinuidad <strong>de</strong> tráfico en tramos sin duplicación <strong>de</strong> calzadas<br />
Fuente: E<strong>la</strong>boración propia<br />
En <strong>la</strong> Red <strong>de</strong> Interés Preferente, <strong>la</strong> mayor parte <strong>de</strong> los tramos <strong>de</strong> autopista y vías <strong>de</strong> alta capacidad<br />
presentan continuidad <strong>de</strong> tráfico, a excepción <strong>de</strong> <strong>la</strong> N-I en el entorno <strong>de</strong> Donostia-San Sebastián y <strong>de</strong> <strong>la</strong> N-<br />
634 a su paso por el Bilbao Metropolitano. Respecto al resto <strong>de</strong> <strong>la</strong> RIP no duplicada, existe discontinuidad <strong>de</strong><br />
tráfico en un 67,5% <strong>de</strong> su longitud.<br />
50,1%<br />
121<br />
Revisión <strong>de</strong>l Segundo P<strong>la</strong>n General <strong>de</strong> Carreteras <strong>de</strong>l País Vasco
Por su parte, <strong>la</strong>s carreteras <strong>de</strong> <strong>la</strong> Red Básica presentan todas el<strong>la</strong>s discontinuidad en gran parte <strong>de</strong> su<br />
recorrido.<br />
Por su parte, <strong>la</strong>s carreteras <strong>de</strong> <strong>la</strong> Red Comarcal presentan discontinuidad <strong>de</strong> tráfico en todo su recorrido; no<br />
obstante en <strong>la</strong>s carreteras GI-2620 y GI-2636 no existe ninguna intersección a nivel.<br />
<strong>2.</strong>1.8 Travesías Urbanas<br />
De acuerdo con <strong>la</strong> Instrucción <strong>de</strong> Carreteras. Norma 3.1-IC. Trazado (Diciembre 1996) se <strong>de</strong>finen como<br />
tramo urbano y travesía:<br />
√ Tramos urbanos: son los que discurren en su totalidad por suelo c<strong>la</strong>sificado <strong>de</strong> urbano por el<br />
correspondiente instrumento <strong>de</strong> p<strong>la</strong>neamiento urbanístico.<br />
√ Travesía: parte <strong>de</strong>l tramo urbano en <strong>la</strong> que existan edificaciones consolidadas al menos en <strong>la</strong>s dos<br />
terceras partes <strong>de</strong> su longitud y un entramado <strong>de</strong> calles al menos en uno <strong>de</strong> los márgenes.<br />
La presente Revisión <strong>de</strong>l 2º P<strong>la</strong>n General <strong>de</strong> Carreteras <strong>de</strong>l País Vasco se circunscribe al <strong>análisis</strong> y<br />
diagnóstico <strong>de</strong> <strong>la</strong>s travesías existentes en <strong>la</strong>s carreteras que conforman <strong>la</strong> Red Objeto <strong>de</strong>l P<strong>la</strong>n. La<br />
<strong>de</strong>terminación <strong>de</strong> <strong>la</strong> conflictividad <strong>de</strong> <strong>la</strong>s mismas se ha realizado atendiendo a dos aspectos principales:<br />
√ Por un <strong>la</strong>do, su integración con el tejido urbano que atraviesan, en términos <strong>de</strong> <strong>análisis</strong> <strong>de</strong> aparición<br />
<strong>de</strong> conflictos con los usos comunes <strong>de</strong> <strong>la</strong> pob<strong>la</strong>ción resi<strong>de</strong>nte en cada una <strong>de</strong> <strong>la</strong>s localida<strong>de</strong>s.<br />
√ Por otro, su peligrosidad en lo que se refiere a <strong>la</strong> seguridad vial propiamente dicha, aspecto en el que<br />
primará <strong>la</strong> existencia <strong>de</strong> Tramos <strong>de</strong> Concentración <strong>de</strong> Acci<strong>de</strong>ntes en el interior <strong>de</strong> <strong>la</strong>s travesías en los que<br />
<strong>la</strong>s características <strong>de</strong> estos tramos (existencia <strong>de</strong> numerosos cruces e intersecciones, trenzados, posible<br />
congestión, semaforización, etc.) sean <strong>de</strong> c<strong>la</strong>ra influencia.<br />
Des<strong>de</strong> el punto <strong>de</strong> vista <strong>de</strong> su integración urbana, los aspectos a <strong>de</strong>stacar son los siguientes:<br />
√ La interacción <strong>de</strong>l tráfico <strong>de</strong> paso con el tráfico <strong>de</strong> agitación <strong>de</strong>rivado <strong>de</strong> <strong>la</strong> actividad intrínseca <strong>de</strong> <strong>la</strong><br />
travesía. En este punto, los datos fundamentales a analizar son el número <strong>de</strong> cruces e intersecciones con<br />
vías urbanas e interurbanas en el interior <strong>de</strong> <strong>la</strong> travesía, y <strong>la</strong>s características y número <strong>de</strong> <strong>la</strong> señalización<br />
vertical (fundamentalmente semaforización). En consonancia con lo anterior, dato importante es <strong>la</strong><br />
longitud <strong>de</strong> <strong>la</strong> travesía, ya que ésta es un c<strong>la</strong>ro indicador <strong>de</strong>l espacio <strong>de</strong> potencial conflicto entre los dos<br />
tipos <strong>de</strong> tráfico.<br />
√ La conflictividad con el tránsito peatonal y los usos urbanos. En este sentido, se toma también en<br />
consi<strong>de</strong>ración <strong>la</strong> existencia y número <strong>de</strong> intersecciones peatonales, como son <strong>la</strong> existencia <strong>de</strong> pasos <strong>de</strong><br />
cebra y semáforos, así como <strong>la</strong> existencia <strong>de</strong> elementos <strong>de</strong> protección y refugio <strong>de</strong> <strong>la</strong> circu<strong>la</strong>ción<br />
peatonal, como aceras, barandil<strong>la</strong>s, etc. Del mismo modo, un elemento importante es <strong>la</strong> cuantificación <strong>de</strong><br />
<strong>la</strong> pob<strong>la</strong>ción resi<strong>de</strong>nte en el núcleo atravesado, como indicador genérico <strong>de</strong>l volumen <strong>de</strong> actividad en los<br />
márgenes <strong>de</strong> <strong>la</strong> vía.<br />
Siguiendo estas premisas, los aspectos que <strong>de</strong>terminarán <strong>la</strong> conflictividad <strong>de</strong> <strong>la</strong> travesía serán los siguientes:<br />
√ Dificultad <strong>de</strong>l trafico rodado para recorrer <strong>la</strong> travesía:<br />
Carácter o importancia <strong>de</strong> <strong>la</strong> vía y existencia <strong>de</strong> alternativa, trazado, longitud, sección transversal y<br />
estrangu<strong>la</strong>mientos, control y regu<strong>la</strong>ción <strong>de</strong>l tráfico, intersecciones, aparcamientos, interferencia<br />
peatones (semáforos y pasos).<br />
√ Trafico. Intensidad y composición <strong>de</strong>l tráfico pesado.<br />
√ Calidad ambiental.<br />
Alteración <strong>de</strong> <strong>la</strong> vida urbana, efecto barrera, ruido (intensidad y composición <strong>de</strong>l trafico), activida<strong>de</strong>s<br />
en <strong>la</strong>s márgenes, acci<strong>de</strong>ntalidad.<br />
√ Calidad peatonal y peligrosidad.<br />
Longitud, pob<strong>la</strong>ción, activida<strong>de</strong>s en <strong>la</strong>s márgenes, aceras protecciones, semáforos, pasos, iluminación,<br />
centralidad, acci<strong>de</strong>ntalidad<br />
Para <strong>la</strong> <strong>de</strong>terminación <strong>de</strong> <strong>la</strong> conflictividad <strong>de</strong> <strong>la</strong>s travesías, a<strong>de</strong>más <strong>de</strong> aspectos puramente cuantitativos<br />
como los citados, es necesario consi<strong>de</strong>rar aspectos que <strong>de</strong>n lugar a una valoración cualitativa, aunque<br />
resulte menos objetiva; es <strong>de</strong>cir, <strong>la</strong> travesía no se ha consi<strong>de</strong>rar como un paso rápido para los vehículos <strong>de</strong><br />
tránsito, sino que ha <strong>de</strong> aten<strong>de</strong>r correctamente a <strong>la</strong> función social <strong>de</strong> <strong>la</strong> infraestructura <strong>de</strong> comunicación<br />
inserta en el medio urbano. Debe tenerse en cuenta, asimismo, <strong>la</strong> particu<strong>la</strong>ridad <strong>de</strong>l sistema <strong>de</strong><br />
asentamientos y or<strong>de</strong>nación territorial <strong>de</strong> cada una <strong>de</strong> <strong>la</strong>s provincias.<br />
Se ha realizado el <strong>análisis</strong> <strong>de</strong> todas <strong>la</strong>s travesías <strong>de</strong> <strong>la</strong> <strong>red</strong> objeto <strong>de</strong>l P<strong>la</strong>n <strong>de</strong> Carreteras <strong>de</strong> <strong>la</strong> Comunidad<br />
Autónoma <strong>de</strong>l País Vasco, consi<strong>de</strong>rando los aspectos concretos que se citan a continuación, con objeto <strong>de</strong><br />
po<strong>de</strong>r <strong>de</strong>terminar el nivel <strong>de</strong> conflictividad <strong>de</strong> cada una <strong>de</strong> <strong>la</strong>s travesías y, consecuentemente, <strong>la</strong> necesidad<br />
<strong>de</strong> ejecutar variantes en aquellos casos que así lo requieran.<br />
√ Límite <strong>de</strong> velocidad (km / h).<br />
√ Existencia o no <strong>de</strong> iluminación.<br />
√ Existencia o no <strong>de</strong> barandil<strong>la</strong>s para peatones.<br />
√ Existencia a o no <strong>de</strong> aceras para peatones.<br />
√ Medidas <strong>de</strong> calmado <strong>de</strong> tráfico: bandas sonoras transversales y semáforos <strong>de</strong> control <strong>de</strong> velocidad.<br />
122<br />
Revisión <strong>de</strong>l Segundo P<strong>la</strong>n General <strong>de</strong> Carreteras <strong>de</strong>l País Vasco
√ Número <strong>de</strong> semáforos.<br />
√ Número <strong>de</strong> intersecciones.<br />
√ Número <strong>de</strong> pasos <strong>de</strong> peatones.<br />
√ Número <strong>de</strong> glorietas.<br />
√ Número <strong>de</strong> pasos a distinto nivel.<br />
√ Número máximo <strong>de</strong> carriles.<br />
√ Número mínimo <strong>de</strong> carriles.<br />
√ Existencia o no <strong>de</strong> aparcamiento para vehículos.<br />
√ Coinci<strong>de</strong>ncia con un TCA.<br />
√ Paso por centros <strong>de</strong> vida social.<br />
√ Interferencia con activida<strong>de</strong>s comerciales y terciarias.<br />
√ Tráfico peatonal frecuente.<br />
√ Existencia o no <strong>de</strong> edificios arquitectónicos singu<strong>la</strong>res.<br />
√ IMD <strong>de</strong> <strong>la</strong> travesía.<br />
√ Porcentaje <strong>de</strong> vehículos pesados.<br />
√ Calidad ambiental.<br />
Finalmente, se han consi<strong>de</strong>rado travesías muy conflictivas, teniendo en cuenta <strong>la</strong> particu<strong>la</strong>ridad <strong>de</strong> cada<br />
territorio, aquel<strong>la</strong>s que cuentan con importantes interferencias para <strong>la</strong> circu<strong>la</strong>ción <strong>de</strong> vehículos, es <strong>de</strong>cir, un<br />
elevado número <strong>de</strong> intersecciones, pasos a nivel, y semáforos, que afectan a <strong>la</strong> continuidad <strong>de</strong>l tráfico<br />
interurbano <strong>de</strong>l itinerario al que pertenecen; <strong>la</strong>s que presentan activida<strong>de</strong>s en <strong>la</strong>s márgenes que generan un<br />
importante tráfico <strong>de</strong> peatones; <strong>la</strong>s que cuenten con una elevada intensidad <strong>de</strong> tráfico, y que su elevado<br />
volumen <strong>de</strong> tráfico repercuta en <strong>la</strong> calidad ambiental y, por tanto, <strong>la</strong> calidad <strong>de</strong> vida <strong>de</strong> <strong>la</strong>s pob<strong>la</strong>ciones; y <strong>la</strong>s<br />
que tengan una longitud excesiva o características muy limitadas <strong>de</strong> trazado o sección transversal<br />
insuficiente.<br />
Las travesías <strong>de</strong> conflictividad baja, son aquel<strong>la</strong>s en <strong>la</strong>s que el tráfico <strong>de</strong> peatones es muy escaso, disponen<br />
<strong>de</strong> medidas <strong>de</strong> calmado <strong>de</strong> tráfico, <strong>la</strong> IMD y el porcentaje <strong>de</strong> pesados es bajo y no tienen activida<strong>de</strong>s en los<br />
márgenes que hagan peligrar <strong>la</strong> integridad <strong>de</strong>l peatón.<br />
Según este <strong>análisis</strong>, en <strong>la</strong> siguiente tab<strong>la</strong> se presentan <strong>la</strong>s travesías <strong>de</strong> <strong>la</strong> Red Funcional <strong>de</strong>l P<strong>la</strong>n y <strong>la</strong><br />
conflictividad <strong>de</strong> <strong>la</strong>s mismas, así como travesías localizadas en el resto <strong>de</strong> carreteras que conforman <strong>la</strong> Red<br />
Funcional.<br />
A<strong>de</strong>más en el Apéndice 2 se presenta una ficha con <strong>la</strong>s características <strong>de</strong> cada travesía <strong>de</strong> <strong>la</strong> Red Funcional,<br />
a excepción <strong>de</strong> aquel<strong>la</strong>s que siendo <strong>de</strong> <strong>la</strong> Red Funcional no son <strong>de</strong> <strong>la</strong> Red Objeto <strong>de</strong> los Territorios Históricos<br />
<strong>de</strong> Á<strong>la</strong>va y Bizkaia <strong>de</strong> <strong>la</strong>s que no se dispone información.<br />
No se han consi<strong>de</strong>rado en el <strong>análisis</strong> los tramos objeto <strong>de</strong> cesión.<br />
A continuación se presentan tab<strong>la</strong>s que especifican <strong>la</strong>s travesías por Territorio Histórico y nivel <strong>de</strong><br />
conflictividad:<br />
123<br />
Revisión <strong>de</strong>l Segundo P<strong>la</strong>n General <strong>de</strong> Carreteras <strong>de</strong>l País Vasco
TRAVESÍAS DE CONFLICTIVIDAD ALTA EN EL TERRITORIO HISTÓRICO DE ÁLAVA<br />
Carretera Travesía Municipio<br />
Red <strong>de</strong> Interés Preferente<br />
Nº habitantes<br />
(1/1/2003)<br />
N-104 I<strong>la</strong>rratza Vitoria-Gasteiz 61 19.083<br />
N-104 Matauco Vitoria-Gasteiz 32 6.617<br />
Red Básica<br />
A-124 Labastida Labastida 1.302 <strong>2.</strong>080<br />
A-124 Laguardia Laguardia 1.463 3.633<br />
A-624 Amurrio Amurrio 9.555 3.731<br />
A-625 Saratxo Amurrio 101 4.798<br />
Red Comarcal<br />
A-2122 Fontecha Lantarón 130 1.952<br />
A-2126 Oyon / Oión Oyon / Oión <strong>2.</strong>564 -<br />
A-2522 Baranbio Amurrio 169 -<br />
A-2622 Salinas <strong>de</strong> Añana Añana 175 -<br />
A-2622 Pobes Ribera Alta 88 -<br />
Fuente: E<strong>la</strong>boración propia<br />
TRAVESÍAS DE CONFLICTIVIDAD MEDIA EN EL TERRITORIO HISTÓRICO DE ÁLAVA<br />
Carretera Travesía Municipio<br />
Red Básica<br />
Nº habitantes<br />
(1/1/2003)<br />
A-132 Atauri Arraia / Maestu 42 <strong>2.</strong>493<br />
A-624 Artziniega Artziniega 1.381 463<br />
A-624 Respaldiza Aya<strong>la</strong> 374 3.166<br />
Red Comarcal<br />
A-2124 Peñacerrada Peñacerrada 257 -<br />
A-2521 Gujuli Urcabustaiz 47 -<br />
A-2620 Legutiano Legutiano 1.442 944<br />
Fuente: E<strong>la</strong>boración propia<br />
IMD<br />
IMD<br />
TRAVESÍAS DE CONFLICTIVIDAD BAJA EN EL TERRITORIO HISTÓRICO DE ÁLAVA<br />
Carretera Travesía Municipio<br />
Red Básica<br />
Nº habitantes<br />
(1/1/2003)<br />
A-126 Bernedo Bernedo 566 -<br />
A-126 Angostina Bernedo 26 -<br />
A-132 Azatzeta Arraia / Maestu 38 3.946<br />
A-132 Arraia / Maestu Arraia / Maestu 738 3.477<br />
Red Comarcal<br />
A-2126 Yécora / Iecora Yécora / Iecora 255 -<br />
A-2128 Salvatierra / Agurain Salvatierra / Agurain 4.044 -<br />
A-2128 Opacua Salvatierra / Agurain 43 -<br />
A-2128 Contrasta<br />
A-2128<br />
Ullibarri / Arana – Uribarri /<br />
Harana<br />
A-2128 San Vicente <strong>de</strong> Arana<br />
Valle <strong>de</strong> Arana /<br />
Harana<br />
Valle <strong>de</strong> Arana /<br />
Harana<br />
Valle <strong>de</strong> Arana /<br />
Harana<br />
IMD<br />
67 -<br />
81 -<br />
A-2622 Vil<strong>la</strong>nañe Val<strong>de</strong>govia 71 -<br />
A-2622 Vil<strong>la</strong>nueva <strong>de</strong> Val<strong>de</strong>govia Val<strong>de</strong>govia 165 -<br />
A-2622 Guren<strong>de</strong>s Val<strong>de</strong>govia 41 -<br />
A-2622 Boveda Val<strong>de</strong>govia 81 -<br />
A-2625 Puente<strong>la</strong>rrá / Larrazubi Lantarón 136 -<br />
A-2625 Bergonda / Bergüenda Lantarón 72 -<br />
A-2625 Espejo Val<strong>de</strong>gobia 199 -<br />
A-2625 Osma Val<strong>de</strong>gobia 45 -<br />
Fuente: E<strong>la</strong>boración propia<br />
La mayoría <strong>de</strong> <strong>la</strong>s travesías <strong>de</strong>l Territorio Histórico <strong>de</strong> Á<strong>la</strong>va son <strong>de</strong> conflictividad baja, perteneciendo<br />
fundamentalmente a este tipo <strong>la</strong>s carreteras <strong>de</strong> <strong>la</strong>s re<strong>de</strong>s Básica y Comarcal. Las travesías que presentan<br />
conflictividad alta o media en este Territorio Histórico se encuentran en <strong>la</strong> carretera N-104, <strong>de</strong> <strong>la</strong> Red <strong>de</strong><br />
Interés Preferente; en <strong>la</strong> A-124, A-132, A-624, y A-625 <strong>de</strong> <strong>la</strong> Red Básica; y en <strong>la</strong>s carreteras <strong>de</strong> <strong>la</strong> Red<br />
Comarcal A-2122, A-2124, A-2126, A-2521, A-2522, A-2620 y A-262<strong>2.</strong><br />
Á<strong>la</strong>va cuenta con un total <strong>de</strong> 35 travesías en su Red Funcional. De el<strong>la</strong>s 2 correspon<strong>de</strong>n a <strong>la</strong> Red <strong>de</strong> Interés<br />
Preferente, 11 a <strong>la</strong> Red Básica y 22 a <strong>la</strong> Red Comarcal. En cuanto al nivel <strong>de</strong> conflictividad, 11 tienen<br />
conflictividad alta, 6 conflictividad media y 18 conflictividad baja.<br />
126<br />
124<br />
Revisión <strong>de</strong>l Segundo P<strong>la</strong>n General <strong>de</strong> Carreteras <strong>de</strong>l País Vasco
TRAVESÍAS DE CONFLICTIVIDAD ALTA EN EL TERRITORIO HISTÓRICO DE BIZKAIA<br />
Carretera Travesía Municipio<br />
Red <strong>de</strong> Interés Preferente<br />
Nº habitantes<br />
(1/1/2003)<br />
N-240 Bedia Bedia 985 16.835<br />
N-240 Lemoa Lemoa <strong>2.</strong>767 15.270<br />
N-240 Igorre Igorre 3.995 11.419<br />
N-634 Barakaldo Barakaldo 94.727 26.320<br />
N-634 Polígono El Casal<br />
Abanto y Ciervana - Abanto<br />
Zierbana<br />
IMD<br />
677 13.907<br />
N-634 San Juan <strong>de</strong> Muskiz Muskiz 5.619 13.886<br />
N-634 Ermua Ermua 16.735 7.754<br />
N-636 Abadiño Abadiño 6.996 13.320<br />
Red Básica<br />
BI-631 Larrauri Mungia 299 6.957<br />
BI-636 Alonsotegi Alonsotegi <strong>2.</strong>658 23.575<br />
Fuente: E<strong>la</strong>boración propia.<br />
TRAVESÍAS DE CONFLICTIVIDAD MEDIA EN EL TERRITORIO HISTÓRICO DE BIZKAIA<br />
Carretera Travesía Municipio<br />
Red <strong>de</strong> Interés Preferente<br />
Nº habitantes<br />
(1/1/2003)<br />
N-240 Usansolo Galdakao 3.743 24.130<br />
N-634 Bilbao Bilbao 353.567 19.661<br />
N-634 Las Carreras<br />
Abanto y Ciervana - Abanto<br />
Zierbana<br />
IMD<br />
1.572 14.238<br />
N-634 Nocedal Ortuel<strong>la</strong> 196 11.230<br />
N-634 Ortuel<strong>la</strong> Ortuel<strong>la</strong> 8.763 9.320<br />
N-634 Retuerto<br />
N-634<br />
Valle <strong>de</strong> Trápaga /<br />
Trapagarán<br />
Valle <strong>de</strong> Trápaga /<br />
Trapagarán<br />
Valle <strong>de</strong> Trápaga /<br />
Trapagarán<br />
- -<br />
1<strong>2.</strong>686 10.115<br />
N-634 Iurreta Iurreta 4.146 27.364<br />
N-634 Basauri Basauri 44.935 38.723<br />
N-634 Zorrotza Zorrotza - 28.493<br />
N-634 Bilbao Bilbao 353.567 29.389<br />
N-634 Berriz Berriz 4.445 1<strong>2.</strong>452<br />
N-634 Ugarte<br />
N-639 Abanto - Zierbena<br />
Red Básica<br />
Valle <strong>de</strong> Trápaga /<br />
Trapagarán<br />
Abanto y Ciervana - Abanto<br />
Zierbena<br />
725 17.883<br />
9.190 <strong>2.</strong>761<br />
BI-604 Asua Erandio 385 16.594<br />
BI-625 Ugao - Miraballes Ugao - Miraballes 4.099 1<strong>2.</strong>470<br />
BI-633 Berriatua Berriatua 1.023 8.127<br />
BI-633 Ondarroa Ondarroa 9.761 7.454<br />
BI-635 Aste<strong>la</strong>rra Aste<strong>la</strong>rra - 14.432<br />
BI-636 La Quadra Güeñes 265 18.356<br />
Red Comarcal<br />
BI-2224 Gernika-Lumo Gernika-Lumo 15.454 -<br />
BI-2238 Gernika-Lumo Gernika-Lumo 15.454 -<br />
BI-2713 Andra Mari Getxo 14.474 -<br />
Fuente: E<strong>la</strong>boración propia.<br />
125<br />
Revisión <strong>de</strong>l Segundo P<strong>la</strong>n General <strong>de</strong> Carreteras <strong>de</strong>l País Vasco
TRAVESÍAS DE CONFLICTIVIDAD BAJA EN EL TERRITORIO HISTÓRICO DE BIZKAIA<br />
Carretera Travesía Municipio<br />
Red <strong>de</strong> Interés Preferente<br />
Nº habitantes<br />
(1/1/2003)<br />
N-629 Lanestosa Lanestosa 286 1.252<br />
N-634 Euba Amorebieta / Etxano 540 25.374<br />
Red Básica<br />
BI-623 Izurtza Izurtza 263 8.543<br />
BI-623 Mañaria Mañaria 453 4.283<br />
BI-624 Balmaseda Balmaseda 7.043 671<br />
BI-625 Arrankudiaga Arrankudiaga 775 11.926<br />
BI-630 Balmaseda Balmaseda 7.043 <strong>2.</strong>262<br />
BI-630 Tras<strong>la</strong>viña Artzentales 277 1.966<br />
BI-630 El Callejo<br />
BI-630 Ambasaguas<br />
Valle <strong>de</strong> Carranza /<br />
Karrantza Harana<br />
Valle <strong>de</strong> Carranza /<br />
Karrantza Harana<br />
IMD<br />
93 <strong>2.</strong>045<br />
513 <strong>2.</strong>045<br />
BI-634 Sope<strong>la</strong>na Sope<strong>la</strong>na 10.894 -<br />
BI-634 Urduliz Urduliz 3.161 -<br />
BI-634 Ugarte Gatika 154 -<br />
BI-634 Mungia Mungia 14.285 -<br />
Red Comarcal<br />
BI -2121 Fruiz Fruiz 357 -<br />
BI -2121 O<strong>la</strong>barri Igorre 463 -<br />
BI -2121 Ugarte Muxika 443 -<br />
BI -2224 Uruzibieta Gernika-Lumo - -<br />
BI -2224<br />
Munitibar / Arbatzegi<br />
Gerrikaitz<br />
Munitibar / Arbatzegi<br />
Gerrikaitz 382<br />
BI -2224 Bolíbar Markina / Xemein 138 -<br />
BI -2238 Ze<strong>la</strong>ieta Gautegiz Arteaga 655 -<br />
BI -2238 Ereño Ereño 251 -<br />
BI -2238 Lekeito Lekeito 7.354 -<br />
BI -2617 Trucios Trucios 521 -<br />
BI -2636 Markina / Xemein Markina / Xemein 4.713 -<br />
BI-2713 Goikoletxea Larrabetzu - -<br />
BI-2713 Larrabetzu Larrabetzu 1.607 -<br />
Fuente: E<strong>la</strong>boración propia.<br />
-<br />
Las travesías <strong>de</strong>l Territorio Histórico <strong>de</strong> Bizkaia que presentan una alta conflictividad se concentran en <strong>la</strong>s<br />
carreteras N-240, N-634 y N-636, <strong>de</strong> <strong>la</strong> Red <strong>de</strong> Interés Preferente, junto con <strong>la</strong>s <strong>de</strong> Larrauri y Alonsotegi en<br />
<strong>la</strong>s carreteras BI-631 y BI-636, respectivamente, <strong>de</strong> <strong>la</strong> Red Básica.<br />
Por otro <strong>la</strong>do, ambas carreteras, <strong>la</strong> N-240 y <strong>la</strong> N-634, cuentan con travesías <strong>de</strong> conflictividad media, siendo<br />
<strong>de</strong> este tipo también <strong>la</strong> travesía <strong>de</strong> Abanto – Zierbana en <strong>la</strong> N-639, todas <strong>la</strong>s citadas pertenecientes a <strong>la</strong> Red<br />
<strong>de</strong> Interés Preferente. En <strong>la</strong> Red Básica son <strong>de</strong> conflictividad media algunas travesías <strong>de</strong> <strong>la</strong>s carreteras BI-<br />
604, BI-625, BI-633 y BI-636. También se califican como <strong>de</strong> conflictividad media <strong>la</strong>s travesías <strong>de</strong> <strong>la</strong> Red<br />
Comarcal <strong>de</strong> Gernika-Lumo en <strong>la</strong>s carreteras BI-2224 y BI-2238, y <strong>la</strong> <strong>de</strong> Andra Mari, en el municipio <strong>de</strong><br />
Getxo, en <strong>la</strong> BI-2713.<br />
Finalmente, cuentan con baja conflictividad el resto <strong>de</strong> travesías <strong>de</strong> <strong>la</strong> Red Comarcal, y otras travesías <strong>de</strong> <strong>la</strong>s<br />
otras dos re<strong>de</strong>s coinci<strong>de</strong>ntes con núcleos <strong>de</strong> pob<strong>la</strong>ción <strong>de</strong> escasa pob<strong>la</strong>ción o con bajas intensida<strong>de</strong>s <strong>de</strong><br />
tráfico.<br />
El Territorio Histórico <strong>de</strong> Bizkaia cuenta con un total <strong>de</strong> 60 travesías. De el<strong>la</strong>s, 24 se encuentran en <strong>la</strong> Red <strong>de</strong><br />
Interés Preferente, 20 en <strong>la</strong> Red Básica y 16 en <strong>la</strong> Red Comarcal. En cuanto a conflictividad, 10 son <strong>de</strong><br />
conflictividad alta, 23 <strong>de</strong> conflictividad media y 27 <strong>de</strong> conflictividad baja.<br />
126<br />
Revisión <strong>de</strong>l Segundo P<strong>la</strong>n General <strong>de</strong> Carreteras <strong>de</strong>l País Vasco
TRAVESÍAS DE CONFLICTIVIDAD ALTA EN EL TERRITORIO HISTÓRICO DE GIPUZKOA<br />
Carretera Travesía Municipio<br />
Red <strong>de</strong> Interés Preferente<br />
N-I<br />
N-I<br />
Donostia-San Sebastián<br />
(Añorga)<br />
Donostia-San Sebastián -<br />
Pasaia Antxo<br />
Nº habitantes<br />
(1/1/2003)<br />
IMD<br />
Donostia-San Sebastián 1.869 4 49.891<br />
Donostia-San Sebastián -<br />
Pasaia<br />
186.321 5 51.682<br />
N-I Irun Irun 57.933 24.250<br />
N-634 Eibar Eibar 28.182 17.789<br />
N-634 Orio Orio 4.605 9.909<br />
N-634 Zarautz Zarautz 21.680 9.136<br />
N-634 Zumaia Zumaia 8.656 11.416<br />
N-636 Zumarraga Zumarraga 10.173 19.621<br />
Red Básica<br />
GI-131 Andoain Andoain 13.886 1<strong>2.</strong>966<br />
GI-131 Urnieta Urnieta 5.824 1<strong>2.</strong>966<br />
GI-131 Martutene Donostia-San Sebastián 181.811 16.870<br />
Red Comarcal<br />
GI-2620 Arrasate (P.K. 16,6 – 17,3) Arrasate 2<strong>2.</strong>872 14.716<br />
GI-2620 Arrasate (P.K. 19,3 – 21,0) Arrasate 2<strong>2.</strong>872 14.716<br />
GI-2630 Oñati Oñati 9.191 3.467<br />
GI-2633 Zarautz Zarautz 21.906 4.350<br />
4 Dato correspondiente al núcleo <strong>de</strong> Añorga.<br />
5 Suma <strong>de</strong> <strong>la</strong>s pob<strong>la</strong>ciones <strong>de</strong> Pasaia y Donostia.<br />
Fuente: E<strong>la</strong>boración propia.<br />
TRAVESÍAS DE CONFLICTIVIDAD MEDIA EN EL TERRITORIO HISTÓRICO DE GIPUZKOA<br />
Carretera Travesía Municipio<br />
Red <strong>de</strong> Interés Preferente<br />
Nº habitantes<br />
(1/1/2003)<br />
N-634 Deba Deba 5.275 3.054<br />
N-634 Elgoibar Elgoibar 10.637 17.391<br />
N-634 Getaria Getaria <strong>2.</strong>494 10.502<br />
Red Básica<br />
GI-131 Astigarraga Astigarraga 3.267 16.384<br />
GI-631 Azkoitia Azkoitia 10.288 3.967<br />
GI-631 Azpeitia Azpeitia 13.858 15.365<br />
GI-631 Zestoa Zestoa 3.081 10.937<br />
GI-638 Mutriku Mutriku 4.769 6.038<br />
Red Comarcal<br />
GI-2130 Ibarra Ibarra 4.372 7.882<br />
GI-2130 Tolosa Tolosa 17.798 7.882<br />
GI-2634 Azpeitia Azpeitia 13.857 <strong>2.</strong>125<br />
Fuente: E<strong>la</strong>boración propia.<br />
TRAVESÍAS DE CONFLICTIVIDAD BAJA EN EL TERRITORIO HISTÓRICO DE GIPUZKOA<br />
Carretera Travesía Municipio<br />
Red <strong>de</strong> Interés Preferente<br />
Nº<br />
habitantes<br />
(1/1/2003)<br />
N-121-A Behobia Irun - -<br />
N-634 Aginaga Usurbil 500 9.909<br />
N-636 Antzuo<strong>la</strong> Antzuo<strong>la</strong> 1.911 10.459<br />
Red Básica<br />
GI-631 Aizpurutxo Azkoitia - 4.240<br />
Red Comarcal<br />
GI-2130 Berastegi Berastegi 995 1.886<br />
GI-2130 Berrobi Berrobi 571 <strong>2.</strong>015<br />
GI-2130 Elduain Elduain 216 <strong>2.</strong>015<br />
GI-2132 Hernani Hernani 18.792 2<strong>2.</strong>623<br />
GI-2630 Legazpi Legazpi 8.673 11.893<br />
GI-2634 Bi<strong>de</strong>goyan Bi<strong>de</strong>goyan 439 -<br />
GI-2634 Errezil Errezil 607 755<br />
GI-2636 Elgoibar Elgoibar 10.524 811<br />
Fuente: E<strong>la</strong>boración propia<br />
IMD<br />
IMD<br />
127<br />
Revisión <strong>de</strong>l Segundo P<strong>la</strong>n General <strong>de</strong> Carreteras <strong>de</strong>l País Vasco
Las travesías <strong>de</strong> Gipuzkoa que presentan una alta conflictividad se encuentran en <strong>la</strong>s carreteras N-I, N-634 y<br />
N-636 <strong>de</strong> <strong>la</strong> Red <strong>de</strong> Interés Preferente, coincidiendo con el paso por gran<strong>de</strong>s núcleos <strong>de</strong> pob<strong>la</strong>ción como los<br />
<strong>de</strong> Donostia-San Sebastián, Eibar o Irun, así como localida<strong>de</strong>s importantes <strong>de</strong> <strong>la</strong> franja costera, como<br />
Zarautz, Zumaia y Orio. Por su parte, también presentan conflictividad alta tres travesías <strong>de</strong> <strong>la</strong> Red Básica,<br />
concretamente situadas en <strong>la</strong> carretera GI-131, a su paso por los núcleos <strong>de</strong> Andoain, Urnieta y el municipio<br />
<strong>de</strong> Donostia-San Sebastián, en concreto, en el núcleo <strong>de</strong> Martutene. En <strong>la</strong> Red Comarcal cuentan con<br />
conflictividad alta <strong>la</strong>s travesías <strong>de</strong> <strong>la</strong> Azkoitia en <strong>la</strong> GI-2620, Zarautz en <strong>la</strong> GI-2633 y Oñati en <strong>la</strong> GI-2630.<br />
Presentan conflictividad media algunas travesías <strong>de</strong> <strong>la</strong> N-634, en <strong>la</strong> Red <strong>de</strong> Interés Preferente, a su paso por<br />
núcleos <strong>de</strong> tamaño intermedio como Deba, Elgoibar y Getaria, mientras que <strong>de</strong> <strong>la</strong> Red Básica <strong>de</strong>stacan <strong>la</strong>s<br />
travesías <strong>de</strong> conflictividad media <strong>de</strong> <strong>la</strong> GI-631 en Azpeitia, Azkoitia y Zestoa, junto con <strong>la</strong>s <strong>de</strong> Mutriku en <strong>la</strong><br />
GI-638 y Ergobia en <strong>la</strong> GI-131.<br />
El Territorio Histórico <strong>de</strong> Gipuzkoa cuenta con un total <strong>de</strong> 38 travesías, <strong>de</strong> <strong>la</strong>s que 14 correspon<strong>de</strong>n a <strong>la</strong> Red<br />
<strong>de</strong> Interés Preferente, 9 a <strong>la</strong> Red Básica y 15 a <strong>la</strong> Red Comarcal. En cuanto a conflictividad, 15 presentan<br />
conflictividad alta, 11 conflictividad media y 12 conflictividad baja.<br />
Territorio<br />
Histórico<br />
Á<strong>la</strong>va<br />
Bizkaia<br />
Gipuzkoa<br />
Total<br />
TRAVESÍAS TOTALES EN LA RED<br />
Conflictividad<br />
Red <strong>de</strong> Interés<br />
Preferente<br />
Red Básica Red Comarcal Total<br />
Alta 2 4 5 11<br />
Media 0 3 3 6<br />
Baja 0 4 14 18<br />
Total 2 11 22 35<br />
Alta 8 2 0 10<br />
Media 14 6 3 23<br />
Baja 2 12 13 27<br />
Total 24 20 16 60<br />
Alta 8 3 4 15<br />
Media 3 5 3 11<br />
Baja 3 1 8 12<br />
Total 14 9 15 38<br />
Alta 18 9 9 36<br />
Media 17 14 9 40<br />
Baja 5 17 35 57<br />
Total 40 40 53 133<br />
Fuente: E<strong>la</strong>boración propia<br />
En resumen, en <strong>la</strong> Red Objeto <strong>de</strong>l P<strong>la</strong>n existen un total <strong>de</strong> 133 travesías. De el<strong>la</strong>s, 40 se encuentran en <strong>la</strong><br />
Red <strong>de</strong> Interés Preferente, 40 en <strong>la</strong> Red Básica y 53 en <strong>la</strong> Red Comarcal. La mayoría son <strong>de</strong> baja<br />
conflictividad (57), mientras que <strong>la</strong>s <strong>de</strong> conflictividad media y alta están prácticamente equiparadas: 40 y 36<br />
respectivamente.<br />
Bizkaia es el Territorio con mayor número <strong>de</strong> travesías, con un total <strong>de</strong> 60, seguida <strong>de</strong> Gipuzkoa, que tiene<br />
38 y Á<strong>la</strong>va, que cuenta con 35. A pesar <strong>de</strong> ello, el mayor número <strong>de</strong> travesías <strong>de</strong> conflictividad alta se<br />
encuentran en el Territorio Histórico <strong>de</strong> Gipuzkoa, que tiene 15 travesías <strong>de</strong> este tipo, encontrándose Á<strong>la</strong>va y<br />
Bizkaia prácticamente en <strong>la</strong> misma <strong>situación</strong>, con 11 y 10 travesías altamente conflictivas respectivamente.<br />
En cuanto a <strong>la</strong> Red en que se encuadran, <strong>la</strong> mayoría <strong>de</strong> <strong>la</strong>s travesías <strong>de</strong> alta conflictividad pertenecen a <strong>la</strong><br />
Red <strong>de</strong> Interés Preferente (18 <strong>de</strong> <strong>la</strong>s 36). De el<strong>la</strong>s, 8 están en Bizkaia, 8 en Gipuzkoa y tan sólo 2 en Á<strong>la</strong>va.<br />
El número <strong>de</strong> travesías <strong>de</strong> conflictividad alta que se encuentran en <strong>la</strong> Red Básica es <strong>de</strong> 9, 4 en Á<strong>la</strong>va, 3 en<br />
Gipuzkoa y 2 en Bizkaia. Finalmente, <strong>la</strong>s travesías <strong>de</strong> conflictividad alta <strong>de</strong> <strong>la</strong> Red Comarcal se concentran en<br />
Á<strong>la</strong>va (5) y Gipuzkoa (4).<br />
Estas travesías correspon<strong>de</strong>n a <strong>la</strong>s carreteras N-I, N-104, N-240, N-634 y N-636 <strong>de</strong> <strong>la</strong> Red <strong>de</strong> Interés<br />
Preferente; A-124, A-624, A-625, BI-631, BI-636 y GI-131, <strong>de</strong> <strong>la</strong> Red Básica; y A-2122, A-2126, A-2522, A-<br />
2622, GI-2620, GI-2630 y GI-2633 <strong>de</strong> <strong>la</strong> Red Comarcal. En <strong>la</strong> mayoría <strong>de</strong> casos se encuentran <strong>de</strong>ntro <strong>de</strong><br />
algunas <strong>de</strong> <strong>la</strong>s vías fundamentales <strong>de</strong> <strong>la</strong> <strong>red</strong> <strong>de</strong> <strong>la</strong> Comunidad Autónoma, conformando itinerarios básicos<br />
para los <strong>de</strong>sp<strong>la</strong>zamientos, y don<strong>de</strong> suelen coincidir <strong>la</strong> existencia <strong>de</strong> altas intensida<strong>de</strong>s <strong>de</strong> vehículos y bajos<br />
niveles <strong>de</strong> servicio, con importantes volúmenes pob<strong>la</strong>cionales.<br />
La carretera que cuenta con el mayor volumen <strong>de</strong> travesías es <strong>la</strong> N-634, que tiene un total <strong>de</strong> 25, siendo <strong>de</strong><br />
alta conflictividad 8 <strong>de</strong> el<strong>la</strong>s, mientras que 15 son <strong>de</strong> conflictividad media y 2 <strong>de</strong> conflictividad baja. La<br />
siguiente carretera que <strong>de</strong>staca por su número <strong>de</strong> travesías es <strong>la</strong> N-240, en <strong>la</strong> que se localizan 4, 3 <strong>de</strong> <strong>la</strong>s<br />
cuales son <strong>de</strong> conflictividad alta y 1 <strong>de</strong> conflictividad media.<br />
El esquema anterior, si bien aporta una i<strong>de</strong>a bastante aproximada <strong>de</strong> <strong>la</strong> localización <strong>de</strong> los tramos urbanos<br />
en <strong>la</strong>s carreteras <strong>de</strong> <strong>la</strong> Red Funcional que han <strong>de</strong> recibir una atención especial, no explica por sí sólo <strong>la</strong><br />
necesidad <strong>de</strong> actuación <strong>de</strong> mejora en términos <strong>de</strong> tránsito y seguridad. Debido a ello, el <strong>análisis</strong> se completa<br />
con el estudio <strong>de</strong> otros elementos que mi<strong>de</strong>n <strong>la</strong> seguridad y <strong>la</strong> peligrosidad, como <strong>la</strong> existencia <strong>de</strong> Tramos <strong>de</strong><br />
Concentración <strong>de</strong> Acci<strong>de</strong>ntes en el interior <strong>de</strong> <strong>la</strong>s travesías, que pue<strong>de</strong>n hacer variar los parámetros <strong>de</strong><br />
c<strong>la</strong>sificación anteriores por <strong>la</strong> posible coinci<strong>de</strong>ncia <strong>de</strong> un TCA en una travesía que por pob<strong>la</strong>ción, IMD y<br />
número <strong>de</strong> cruces (que incluyen los pasos peatonales) aparecería como poco conflictiva.<br />
Se han <strong>de</strong>tectado un total <strong>de</strong> veinte (10) travesías que coinci<strong>de</strong>n con Tramos <strong>de</strong> Concentración <strong>de</strong><br />
Acci<strong>de</strong>ntes, <strong>de</strong> <strong>la</strong>s que 4 <strong>de</strong> el<strong>la</strong>s se encuentran en carreteras <strong>de</strong> <strong>la</strong> Red <strong>de</strong> Interés Preferente, 5 en<br />
carreteras <strong>de</strong> <strong>la</strong> Red Básica y tan solo 1 en carreteras <strong>de</strong> <strong>la</strong> Red Comarcal.<br />
128<br />
Revisión <strong>de</strong>l Segundo P<strong>la</strong>n General <strong>de</strong> Carreteras <strong>de</strong>l País Vasco
La distribución <strong>de</strong> TCAs en travesías por Territorio Histórico es <strong>de</strong> 2 TCAs coinci<strong>de</strong>ntes con travesías <strong>de</strong><br />
Á<strong>la</strong>va, 3 con travesías <strong>de</strong> Gipuzkoa y 5 con travesías <strong>de</strong> Bizkaia.<br />
Finalmente, si se consi<strong>de</strong>ran estos Tramos <strong>de</strong> Concentración <strong>de</strong> Acci<strong>de</strong>ntes en travesías según <strong>la</strong> pob<strong>la</strong>ción<br />
<strong>de</strong> <strong>la</strong>s mismas, se diferencian cinco grupos <strong>de</strong> menos <strong>de</strong> 1.000 habitantes con 2 travesías; entre 1.000 y<br />
5.000 habitantes con otras 3 travesías; entre 5.000 y 10.000 habitantes con 2 travesías; entre 10.000 y<br />
50.000 habitantes con otras 2 travesías, y por último, una única travesía (Donostia-San Sebastián) con más<br />
<strong>de</strong> 100.000 habitantes.<br />
TRAMOS DE CONCENTRACIÓN DE ACCIDENTES EN TRAVESÍAS<br />
Carretera Pob<strong>la</strong>ción Municipio<br />
Nº habitantes<br />
(1/1/2003)<br />
Territorio<br />
Histórico<br />
N-I Donostia-San Sebastián Donostia-San Sebastián 181.811 Gipuzkoa<br />
N-240 Legutiano Legutiano 1.442 Á<strong>la</strong>va<br />
N-634 Basauri Basauri 44.935 Bizkaia<br />
N-634 San Juan <strong>de</strong> Muskiz Muskiz 5.619 Bizkaia<br />
A-624 Amurrio Amurrio 9.555 Á<strong>la</strong>va<br />
BI-625 Ugao / Miraballes Ugao / Miraballes 4.099 Bizkaia<br />
BI-625 Arrankudiaga Arrankudiaga 775 Bizkaia<br />
GI-131 Andoain Andoain 13.886 Gipuzkoa<br />
GI-631 Zestoa Zestoa 3.081 Gipuzkoa<br />
BI-2121 Fruiz Fruiz 357 Bizkaia<br />
Fuente: E<strong>la</strong>boración propia<br />
129<br />
Revisión <strong>de</strong>l Segundo P<strong>la</strong>n General <strong>de</strong> Carreteras <strong>de</strong>l País Vasco
<strong>2.</strong><strong>2.</strong> ANÁLISIS FUNCIONAL<br />
<strong>2.</strong><strong>2.</strong>1 Motorización y parque <strong>de</strong> vehículos<br />
<strong>2.</strong><strong>2.</strong>1.1. Índice <strong>de</strong> motorización<br />
En <strong>la</strong> Comunidad Autónoma <strong>de</strong>l País Vasco, el parque móvil en el año 2003 es <strong>de</strong> 1.10<strong>2.</strong>418 vehículos, <strong>de</strong> los<br />
que el 77,3% son automóviles, el 14,5% camiones y furgonetas, el 4,9% motocicletas, el 2,4% otros<br />
vehículos a motor, y con un porcentaje inferior al 1% se encuentran los tractores (0,8%) y autobuses<br />
(0,2%).<br />
PARQUE DE VEHÍCULOS EN LOS TERRITORIOS HISTÓRICOS DEL PAÍS VASCO. AÑO 2003<br />
T.H.<br />
Total<br />
vehículos<br />
Automóviles<br />
Camiones y<br />
furgonetas<br />
Motocicletas Autobuses<br />
Tractores<br />
industriales<br />
Á<strong>la</strong>va 163.584 125.259 26.624 5.927 448 1.340 3.986<br />
Bizkaia 564.944 449.987 75.159 2<strong>2.</strong>465 1.434 3.670 1<strong>2.</strong>229<br />
Gipuzkoa 373.053 275.891 57.983 25.349 761 3.342 9.727<br />
CAPV 1.101.581 851.137 159.766 53.741 <strong>2.</strong>643 8.352 25.942<br />
Fuente: Instituto Vasco <strong>de</strong> Estadística. Servicios: Transportes y Comunicaciones (EUSTAT)<br />
DISTRIBUCIÓN DE VEHÍCULOS EN LA CAPV<br />
14,5<br />
4,9<br />
0,2 0,8<br />
2,4<br />
77,3<br />
Automóviles Camiones y furgonetas<br />
Motocicletas Autobuses<br />
Tractores Otros<br />
Fuente: E<strong>la</strong>boración propia a partir <strong>de</strong> los datos <strong>de</strong> EUSTAT.<br />
Otros<br />
Diferenciando por Territorio Histórico, algo más <strong>de</strong> <strong>la</strong> mitad <strong>de</strong> los vehículos se concentran en Bizkaia<br />
(51,3%), el 33,9% en Gipuzkoa y es Á<strong>la</strong>va don<strong>de</strong> el número <strong>de</strong> vehículos es el menor <strong>de</strong> todo el País Vasco,<br />
pues tan sólo el 14,8% <strong>de</strong> los mismos correspon<strong>de</strong>n a este Territorio Histórico.<br />
VEHÍCULOS POR TERRITORIO HISTÓRICO<br />
33,9%<br />
(%)<br />
14,8%<br />
51,3%<br />
Araba / A<strong>la</strong>va Bizkaia Gipuzkoa<br />
Fuente: E<strong>la</strong>boración propia a partir <strong>de</strong> los datos <strong>de</strong> EUSTAT.<br />
Si se consi<strong>de</strong>ran, exclusivamente, los vehículos a motor (automóviles, camiones y furgonetas, autobuses y<br />
otros vehículos), éstos representan el 99,2% <strong>de</strong>l total <strong>de</strong>l parque <strong>de</strong> vehículos <strong>de</strong> <strong>la</strong> CAPV. De éstos, el<br />
51,3% se concentra en Bizkaia seguido <strong>de</strong> Gipuzkoa (33,8%) y Á<strong>la</strong>va (14,9%).<br />
Respecto a <strong>la</strong> categoría <strong>de</strong> vehículos a motor, los automóviles representan un 77,9% <strong>de</strong>l total <strong>de</strong> <strong>la</strong> CAPV,<br />
seguido a gran distancia por los camiones y furgonetas con el 14,6% <strong>de</strong>l total <strong>de</strong> <strong>la</strong> CAPV y el 4,9% <strong>de</strong> <strong>la</strong>s<br />
motocicletas.<br />
PARQUE DE VEHÍCULOS A MOTOR EN LOS TERRITORIOS HISTÓRICOS DEL PAÍS VASCO<br />
T.H. Total a motor Automóviles<br />
(%)<br />
AÑO 2003<br />
Camiones y<br />
furgonetas<br />
(%)<br />
Motocicletas<br />
(%)<br />
Autobuses<br />
(%)<br />
Otros (%)<br />
Á<strong>la</strong>va 16<strong>2.</strong>244 77,2 16,4 3,7 0,3 2,5<br />
Bizkaia 561.274 80,2 13,4 4,0 0,3 2,2<br />
Gipuzkoa 369.711 74,6 15,7 6,9 0,2 2,6<br />
CAPV 1.093.229 77,8 14,6 4,9 0,2 2,4<br />
Fuente: E<strong>la</strong>boración propia a partir <strong>de</strong> los datos <strong>de</strong> EUSTAT.<br />
131<br />
Revisión <strong>de</strong>l Segundo P<strong>la</strong>n General <strong>de</strong> Carreteras <strong>de</strong>l País Vasco
A continuación se presenta <strong>la</strong> evolución <strong>de</strong>l parque móvil (excluidos tractores industriales) en cada Territorio<br />
Histórico y en <strong>la</strong> Comunidad Autónoma <strong>de</strong>l País Vasco, así como <strong>la</strong> tasa <strong>de</strong> crecimiento medio acumu<strong>la</strong>tivo<br />
anual en el período 2003 – 1997.<br />
Tipología<br />
vehículos<br />
CAPV<br />
EVOLUCIÓN DEL PARQUE MÓVIL EN EL PERÍODO 1997 – 2003<br />
1997 1998 1999 2000 2001 2002 2003<br />
Variación (%)<br />
1997 - 2003<br />
Turismos 737.811 769.317 801.137 820.618 843.544 861.225 851.137 15,36<br />
Camiones y<br />
Furgonetas<br />
13<strong>2.</strong>011 138.516 145.574 150.122 154.400 158.488 159.766 21,02<br />
Motocicletas 44.604 46.332 48.320 50.245 51.923 53.563 53.741 20,48<br />
Autobuses <strong>2.</strong>440 <strong>2.</strong>513 <strong>2.</strong>578 <strong>2.</strong>635 <strong>2.</strong>678 <strong>2.</strong>668 <strong>2.</strong>643 8,32<br />
Otros vehículos 15.265 16.670 18.261 20.152 2<strong>2.</strong>160 24.189 25.942 69,9%<br />
Total 93<strong>2.</strong>131 973.348 1.015.870 1.043.772 1.074.705 1.100.133 1.093.229 17,28<br />
Á<strong>la</strong>va<br />
Turismos 11<strong>2.</strong>004 117.890 123.477 127.351 131.537 135.345 125.259 11,83<br />
Camiones y<br />
Furgonetas<br />
2<strong>2.</strong>279 23.489 25.004 25.932 26.672 27.336 26.624 19,50<br />
Motocicletas 5.258 5.423 5.543 5.623 5.848 6.063 5.927 12,72<br />
Autobuses 429 428 456 474 467 465 448 4,43<br />
Otros vehículos <strong>2.</strong>256 <strong>2.</strong>467 <strong>2.</strong>691 <strong>2.</strong>970 3.338 3.663 3.986 76,68<br />
Total 14<strong>2.</strong>226 149.697 157.171 16<strong>2.</strong>350 167.862 17<strong>2.</strong>902 16<strong>2.</strong>244 14,07<br />
Bizkaia<br />
Turismos 389.196 404.361 420.002 429.334 440.568 449.026 449.987 15,62<br />
Camiones y<br />
Furgonetas<br />
6<strong>2.</strong>712 65.472 68.418 70.375 7<strong>2.</strong>345 74.333 75.159 19,85<br />
Motocicletas 18.883 19.329 20.028 20.926 21.571 2<strong>2.</strong>351 2<strong>2.</strong>465 18,97<br />
Autobuses 1.266 1.336 1.373 1.408 1.450 1.439 1.434 13,27<br />
Otros vehículos 7.675 8.202 8.874 9.781 10.582 11.441 1<strong>2.</strong>229 59,34<br />
Total 479.732 498.700 518.695 531.824 546.516 558.590 561.274 17,00<br />
Gipuzkoa<br />
Turismos 236.611 247.066 257.658 263.933 271.439 276.854 275.891 16,60<br />
Camiones y<br />
Furgonetas<br />
47.020 49.555 5<strong>2.</strong>152 53.815 55.383 56.789 57.983 23,32<br />
Motocicletas 20.463 21.580 2<strong>2.</strong>749 23.696 24.504 25.149 25.349 23,88<br />
Autobuses 745 749 749 753 761 764 761 2,15<br />
Otros vehículos 5.334 6.001 6.696 7.401 8.240 9.085 9.727 82,36<br />
Total 310.173 324.951 340.004 349.598 360.327 368.641 369.711 19,20<br />
Fuente: Instituto Vasco <strong>de</strong> Estadística. Servicios: Transportes y Comunicaciones (EUSTAT) y e<strong>la</strong>boración propia a partir <strong>de</strong> estos datos.<br />
El parque <strong>de</strong> vehículos a motor <strong>de</strong> <strong>la</strong> Comunidad Autónoma Vasca se ha incrementado a un ritmo <strong>de</strong> un<br />
2,7% (crecimiento medio) en los últimos seis años. En los Territorios Históricos <strong>de</strong> Á<strong>la</strong>va y Gipuzkoa, el<br />
parque <strong>de</strong> vehículos ha crecido un 2,2% y un 3% respectivamente, mientras que en Bizkaia ha aumentado<br />
en un 2,6%.<br />
EVOLUCIÓN DEL TOTAL DE VEHÍCULOS EN EL PERÍODO 1997 - 2003<br />
20,00%<br />
15,00%<br />
10,00%<br />
5,00%<br />
0,00%<br />
17,28%<br />
14,07%<br />
(%)<br />
17,00%<br />
19,20%<br />
CAPV Á<strong>la</strong>va Bizkaia Gipuzkoa<br />
Fuente: E<strong>la</strong>boración propia a partir <strong>de</strong> los datos <strong>de</strong> EUSTAT.<br />
Si se consi<strong>de</strong>ra <strong>la</strong> evolución por tipología <strong>de</strong> vehículos, se observa que <strong>la</strong> categoría Otros vehículos es <strong>la</strong> que<br />
mayor incremento ha experimentado, un 9,3% para el conjunto <strong>de</strong> <strong>la</strong> CAPV en el período 1997 - 2003.<br />
Respecto a <strong>la</strong>s restantes categorías, el crecimiento ha sido <strong>de</strong> un 2,4% en turismos, un 3,3% en camiones y<br />
furgonetas, un 3,2% en motocicletas y un 1,3% en <strong>la</strong> tipología <strong>de</strong> autobuses.<br />
132<br />
Revisión <strong>de</strong>l Segundo P<strong>la</strong>n General <strong>de</strong> Carreteras <strong>de</strong>l País Vasco
EVOLUCIÓN POR TIPOLOGÍA DE VEHÍCULO EN LA CAPV EN EL PERÍODO 1997 - 2003<br />
9,3%<br />
(%)<br />
1,3%<br />
2,4%<br />
3,2%<br />
3,3%<br />
Turismos Camiones y Furgonetas<br />
Motocicletas Autobuses<br />
Otros vehículos<br />
Fuente: E<strong>la</strong>boración propia a partir <strong>de</strong> los datos <strong>de</strong> EUSTAT.<br />
Se recoge a continuación el índice <strong>de</strong> motorización (en vehículos / 1.000 habitantes) <strong>de</strong> <strong>la</strong> Comunidad<br />
Autónoma <strong>de</strong>l País Vasco, así como el <strong>de</strong> cada uno <strong>de</strong> los Territorios Históricos en el período 1998 – 2003. El<br />
Territorio don<strong>de</strong> el índice <strong>de</strong> motorización en el año 2003 es el menor <strong>de</strong> todos es Bizkaia con 495 vehículos<br />
/ 1.000 habitantes, y finalmente en Gipuzkoa el índice <strong>de</strong> motorización es <strong>de</strong> 541 vehículos / 1.000<br />
habitantes.<br />
EVOLUCIÓN DEL ÍNDICE DE MOTORIZACIÓN EN EL PERÍODO 1998 – 2003<br />
(vehículos / 1.000 habitantes)<br />
Tipología vehículos 1998 1999 2000 2001 2002 2003<br />
CAPV<br />
Turismos 367 381 391 401 408 403<br />
Camiones y Furgonetas 66 69 72 73 75 76<br />
Motocicletas 22 23 24 25 25 25<br />
Autobuses 1 1 1 1 1 1<br />
Otros vehículos 8 9 10 11 11 12<br />
Total 464 484 497 511 522 518<br />
Á<strong>la</strong>va<br />
Turismos 414 432 445 455 464 426<br />
Camiones y Furgonetas 83 88 91 92 94 90<br />
Motocicletas 19 19 20 20 21 20<br />
Autobuses 2 2 2 2 2 2<br />
Otros vehículos 9 9 10 12 13 14<br />
Total 526 550 567 581 592 552<br />
Bizkaia<br />
Turismos 355 369 379 389 396 397<br />
Camiones y Furgonetas 58 60 62 64 66 66<br />
Motocicletas 17 18 18 19 20 20<br />
Autobuses 1 1 1 1 1 1<br />
Otros vehículos 7 8 9 9 10 11<br />
Total 438 456 470 483 493 495<br />
Gipuzkoa<br />
Turismos 365 380 388 399 405 403<br />
Camiones y Furgonetas 73 77 79 81 83 85<br />
Motocicletas 32 34 35 36 37 37<br />
Autobuses 1 1 1 1 1 1<br />
Otros vehículos 9 10 11 12 13 14<br />
Total 480 502 515 530 540 541<br />
Fuente: E<strong>la</strong>boración propia a partir <strong>de</strong> los datos <strong>de</strong>l Instituto Vasco <strong>de</strong> Estadística (Eustat) y <strong>de</strong>l Instituto Nacional <strong>de</strong> Estadística (INE).<br />
133<br />
Revisión <strong>de</strong>l Segundo P<strong>la</strong>n General <strong>de</strong> Carreteras <strong>de</strong>l País Vasco
En <strong>la</strong> siguiente tab<strong>la</strong> se presentan los vehículos matricu<strong>la</strong>dos <strong>de</strong>s<strong>de</strong> el año 1997 hasta el año 2003, tanto en<br />
<strong>la</strong> Comunidad Autónoma Vasca como en los tres Territorios Históricos. Las variaciones <strong>de</strong> unos años a otros<br />
son muy diferentes. Así, <strong>de</strong>stacan los años 1998 y 1999 pues en ellos el crecimiento respecto al año anterior<br />
en <strong>la</strong> CAPV fue consi<strong>de</strong>rable (<strong>de</strong>l 16,8% y <strong>de</strong>l 14,1%); y los años 2000 y 2001 don<strong>de</strong> <strong>la</strong> matricu<strong>la</strong>ción <strong>de</strong><br />
vehículos se <strong>red</strong>ujo (también respecto al año anterior) en más <strong>de</strong> un 6% y <strong>de</strong> un 8% respectivamente.<br />
EVOLUCIÓN DE LA MATRICULACIÓN DE VEHÍCULOS<br />
Año CAPV Á<strong>la</strong>va Bizkaia Gipuzkoa<br />
1997 63.677 11.644 30.574 21.459<br />
1998 74.396 1<strong>2.</strong>266 36.372 25.758<br />
1999 84.881 14.016 41.194 29.671<br />
2000 79.454 13.143 38.900 27.411<br />
2001 79.822 1<strong>2.</strong>725 40.284 26.813<br />
2002 73.180 1<strong>2.</strong>830 36.472 23.878<br />
2003 75.025 13.501 36.583 24.941<br />
20,0<br />
15,0<br />
10,0<br />
5,0<br />
0,0<br />
-5,0<br />
-10,0<br />
Fuente: Dirección General <strong>de</strong> Tráfico (DGT).<br />
VARIACIÓN DEL NÚMERO DE VEHÍCULOS MATRICULADOS<br />
(%)<br />
1998 1999 2000 2001 2002 2003<br />
Fuente: E<strong>la</strong>boración propia<br />
<strong>2.</strong><strong>2.</strong>2 Tráfico y movilidad en <strong>la</strong> <strong>red</strong> funcional<br />
<strong>2.</strong><strong>2.</strong><strong>2.</strong>1. Red <strong>de</strong> Interés Preferente<br />
A continuación se presenta, para <strong>la</strong>s carreteras <strong>de</strong> <strong>la</strong> Red <strong>de</strong> Interés Preferente, <strong>la</strong> evolución <strong>de</strong>l tráfico <strong>de</strong><br />
<strong>la</strong>s estaciones <strong>de</strong> aforo localizadas en cada cor<strong>red</strong>or representativo consi<strong>de</strong>rado. En <strong>la</strong> tab<strong>la</strong> figura <strong>la</strong> IMD y<br />
el porcentaje <strong>de</strong> pesados para los años 2003, 2002, 2001, 2000, 1999, 1998 y 1997, así como <strong>la</strong> tasa <strong>de</strong><br />
crecimiento medio acumu<strong>la</strong>tivo anual en dicho período.<br />
134<br />
Revisión <strong>de</strong>l Segundo P<strong>la</strong>n General <strong>de</strong> Carreteras <strong>de</strong>l País Vasco
Estación Carretera Tipo P.K. Localidad más próxima<br />
AUTOVÍA N-I: AUTOVÍA DEL NORTE. ÁLAVA<br />
EVOLUCIÓN DEL TRÁFICO EN LOS CORREDORES REPRESENTATIVOS DE LA RED DE INTERÉS PREFERENTE<br />
IMD<br />
2003 2002 2001 2000 1999 1998 1997<br />
%<br />
Pesados<br />
IMD<br />
%<br />
Pesados<br />
IMD<br />
%<br />
Pesados<br />
IMD<br />
%<br />
Pesados<br />
IMD<br />
%<br />
Pesados<br />
IMD<br />
%<br />
Pesados<br />
IMD<br />
%<br />
Pesados<br />
135<br />
Variación (%) 1997<br />
- 2003<br />
IMD Pesados<br />
180 N-I 3 321,7 Límite Miranda <strong>de</strong> Ebro 15.635 29,9 15.024 35,6 13.632 39,9 17.228 40,9 14.982 40,9 15.512 43,5 1<strong>2.</strong>793 38,83 3,4 -1,0<br />
121 N-I 1 325,5 Puente Nuevo 15.045 28,5 14.467 29,6 13.641 33,4 14.820 32,8 14.000 33,5 14.325 32,66 1<strong>2.</strong>048 38,82 3,8 -1,4<br />
120 N-I ETD 326,3 ETD 3 – Armiñón 33.207 28,9 3<strong>2.</strong>150 29,1 3<strong>2.</strong>387 31,6 30.836 31,6 29.323 33,7 28.374 32,2 25.578 29,44 4,4 4,1<br />
660 N-I 1 337,0 Boquete <strong>de</strong> Lapueb<strong>la</strong> - - 34.654 35,1 33.577 37,3 3<strong>2.</strong>435 37,6 3<strong>2.</strong>070 33,9 29.179 30,3 31.406 26,91 2,0* 7,6*<br />
240 N-I 1 341,0 Subijana <strong>de</strong> Á<strong>la</strong>va 35.627 24,7 - - 38.787 23,2 38.076 25,9 34.094 26,4 33.041 27,7 31.137 26,90 2,3 0,8<br />
20 N-I 1 344,0 Aríñez - - 24.273 38,1 24.749 39,9 23.790 40,9 23.468 40,8 21.233 43,5 18.416 38,82 5,7* 5,3*<br />
30 N-I 3 346,7 Crispijana/Krispiñana 30.370 35,0 27.689 38,1 28.092 39,9 30.299 40,9 26.481 41,5 2<strong>2.</strong>393 43,5 21.486 38,83 5,9 4,1<br />
40 N-I 1 348,9 Yurre 30.838 39,6 27.300 39,8 27.074 39,6 30.158 40,9 27.209 41,4 20.566 43,5 21.788 38,82 6,0 6,3<br />
50 N-I ETD 354,3 ETD 4 – Abetxuko 36.657 29,2 29.553 35,0 30.123 35,9 30.749 40,9 25.515 40,7 21.168 43,5 21.050 38,83 9,7 4,6<br />
60 N-I 1 356,4 Durana 24.881 28,6 24.545 35,5 2<strong>2.</strong>471 38,2 21.257 40,0 19.589 36,3 17.309 37,4 16.762 30,22 6,8 5,8<br />
70 N-I 1 359,8 Lubiano 2<strong>2.</strong>831 33,1 19.548 39,2 19.079 40,7 21.782 40,0 19.385 36,7 15.665 37,5 14.611 30,22 7,7 9,4<br />
80 N-I 3 365,8 Venta <strong>de</strong>l Patio 19.780 33,0 2<strong>2.</strong>747 30,8 28.894 38,2 23.046 40,0 2<strong>2.</strong>309 36,5 16.494 37,4 14.313 38,82 5,5 15,6<br />
90 N-I 1 371,6 Arrieta 26.478 30,6 24.285 30,6 2<strong>2.</strong>360 36,5 21.920 40,8 20.209 41,1 19.675 32,6 20.537 44,63 4,3 -2,0<br />
200 N-I 1 378,7 Salvatierra o Agurain 2<strong>2.</strong>739 33,2 20.129 33,7 20.413 37,2 21.682 40,9 20.315 40,8 17.004 43,5 14.399 38,82 7,9 5,1<br />
140 N-I 1 379,3 Mezkia 24.188 31,7 23.949 31,7 21.764 35,2 24.057 40,9 19.326 48,7 17.485 43,5 20.803 38,83 2,5 -0,9<br />
220 N-I 1 382,7 Urabain 23.496 34,7 21.118 36,3 21.121 36,1 21.673 40,9 20.265 40,9 16.266 43,5 15.912 38,83 6,7 4,7<br />
230 N-I ETD 387,5 ETD 5 – Egino 23.488 34,0 21.543 37,1 20.826 43,6 19.914 38,5 18.387 39,0 18.716 33,8 16.195 31,99 6,4 7,5<br />
AUTOVÍA N-I: AUTOVÍA DEL NORTE. GIPUZKOA<br />
30 N-I 1 404,4 Puerto <strong>de</strong> Etxegarate 16.098 50,0 1<strong>2.</strong>569 55,0 1<strong>2.</strong>195 59,0 1<strong>2.</strong>519 53,0 11.483 55,0 11.305 55,0 10.908 47,7 6,7 7,5<br />
168 N-I 0 416,4 Beasain 24.562 34,0 2<strong>2.</strong>086 34,0 21.602 37,0 19.609 35,0 19.231 36,0 18.133 36,0 16.778 33,5 6,6 6,8<br />
111 N-I 3 424,0 Itsasondo 39.802 26,0 37.301 - 34.337 - 36.350 - 35.632 - 39.080 - 30.981 - 4,3 -<br />
107 N-I 3 428,5 Variante Ikaztegieta 39.623 26,0 41.940 - 39.345 - 37.017 - 35.551 - 38.279 - 30.395 - 4,5 -<br />
100 N-I 3 434,3 Variante <strong>de</strong> Tolosa 45.196 22,0 41.864 - 4<strong>2.</strong>300 - 40.405 - 37.702 - 36.979 - 26.870 - 9,1 -<br />
12 N-I 2 437,8 Irura 49.814 21,0 45.773 21,0 45.543 23,0 4<strong>2.</strong>608 19,0 43.472 22,0 40.328 22,0 37.687 20,7 4,8 5,0<br />
96 N-I 3 445,1 Sorabil<strong>la</strong> 54.579 19,0 55.105 - 51.936 - 50.686 - 48.482 - 61.795 - 44.452 - 3,5 -<br />
33 N-I 3 448,8 Andoain 68.847 18,0 70.770 - 77.105 - 64.732 - 55.085 - 76.028 - 56.559 - 3,3 -<br />
9101 N-I 3 453,9 Alto <strong>de</strong> Lasarte Oria 33.187 15,0 3<strong>2.</strong>878 - 53.175 - 45.024 - 57.153 - 70.009 - 60.664 - -9,6 -<br />
1 N-I 2 454,6 Frente a Coca – Co<strong>la</strong> 51.954 17,0 50.258 16,0 61.520 18,0 63.363 17,0 71.041 17,0 87.306 16,0 79.951 15,7 -6,9 -5,7<br />
2 N-I 3 461,0 A. <strong>de</strong> Miracruz Atego 31.364 9,0 31.784 - 30.236 - 33.571 - 31.217 - 27.494 - 29.301 - 1,1 -<br />
9302 N-I 3 463,0 Herrera - Escaleril<strong>la</strong>s 49.891 9,5 49.379 - 53.923 - 49.377 - 47.987 - 48.983 - 45.530 - 1,5 -<br />
101 N-I 3 466,2 Kaputxinos 53.473 11,0 51.163 - 50.161 - 41.916 - 47.718 - 47.078 - 38.923 - 5,4 -<br />
253 N-I 3 466,5 Variante Errenteria 43.487 11,0 40.576 - 45.168 - 36.548 - 3<strong>2.</strong>936 - - - - - - -<br />
Revisión <strong>de</strong>l Segundo P<strong>la</strong>n General <strong>de</strong> Carreteras <strong>de</strong>l País Vasco
Estación Carretera Tipo P.K. Localidad más próxima<br />
IMD<br />
2003 2002 2001 2000 1999 1998 1997<br />
%<br />
Pesados<br />
IMD<br />
%<br />
Pesados<br />
IMD<br />
%<br />
Pesados<br />
IMD<br />
%<br />
Pesados<br />
IMD<br />
%<br />
Pesados<br />
IMD<br />
%<br />
Pesados<br />
IMD<br />
%<br />
Pesados<br />
136<br />
Variación (%) 1997<br />
- 2003<br />
IMD Pesados<br />
252 N-I 3 468,0 Variante Errenteria 35.095 11,0 33.450 - 38.595 - 29.159 - 26.543 - - - - - - -<br />
36 N-I 2 469,1 Recta <strong>de</strong> Lintzirin 34.038 11,0 3<strong>2.</strong>675 12,0 31.860 13,0 3<strong>2.</strong>203 12,9 31.276 12,0 26.060 13,0 26.446 11,9 4,3 2,9<br />
3 N-I 1 473,0 Final Gaintxurizketa 34.136 13,0 3<strong>2.</strong>683 13,0 3<strong>2.</strong>048 13,0 31.326 12,0 28.798 14,0 28.371 16,0 27.800 12,7 3,5 3,9<br />
84 N-I 3 476,5 Irun Cruce – Hospital 36.805 12,0 33.016 - 36.069 - 33.619 - 35.529 - 37.023 - 27.936 - 4,7 -<br />
103 N-I 3 479,5 Behobia 28.083 10,5 27.595 - 26.871 - 26.964 - 26.542 - 18.125 - - - - -<br />
102 N-I 3 479,9 Behobia 20.416 10,5 19.614 - 19.412 - 18.806 - 26.542 - 18.125 - 13.956 - 6,5 -<br />
256 N-I 0 481,5 Behobia 14.154 10,0 1<strong>2.</strong>980 10,0 1<strong>2.</strong>130 8,0 1<strong>2.</strong>380 11,0 - - - - - - - -<br />
ACCESOS A LA AUTOVÍA N-I: AUTOVÍA DEL NORTE. GIPUZKOA<br />
247 N-I A 0 2,0 En<strong>la</strong>ce <strong>de</strong> Aritzeta 58.820 15,0 55.993 15,0 46.629 14,0 33.821 14,0 23.667 - - - - - - -<br />
258 N-I H 0 0,7 Puente <strong>de</strong> Santiago 20.049 4,0 19.264 5,0 18.719 5,0 - - - - - - - - -<br />
34 N-I 3 0,0 Zapatari - Avda. Tolosa 29.555 5,0 29.858 - 34.724 - 29.266 - 3<strong>2.</strong>820 - 31.492 - 31.808 - 1,2 -<br />
AUTOPISTA DE PEAJE AP-1: BURGOS – ARMIÑÓN. ÁLAVA<br />
- AP-1 - -<br />
Intercambiador <strong>de</strong> Miranda -<br />
Armiñón<br />
AUTOPISTA DE PEAJE AP-68 (VASCO ARAGONESA. BILBAO - ZARAGOZA): SOLUCIÓN DEL NERBIOI (ALTUBE). BIZKAIA<br />
- - 16.281 28,0 15.048 28,8 13.684 29,4 1<strong>2.</strong>393 29,2 11.208 28,7 10.051 27,8 10,1* 10,3*<br />
28 A AP-68 1 1,7 Buia - Arrigorriaga 29.637 13,9 28.971 13,9 28.073 13,2 25.384 13,0 21.828 12,0 20.344 12,8 18.923 12,4 7,8 9,8<br />
- AP-68 - 10,3 Ugao / Miraballes - Arakaldo 35.711 14,7 34.497 14,9 3<strong>2.</strong>986 14,5 30.103 14,5 26.242 14,4 24.695 14,1 2<strong>2.</strong>518 14,3 8,0 8,5<br />
- AP-68 - 12,5 Arakaldo / Murueta 3<strong>2.</strong>632 14,8 31.541 15,1 30.102 14,6 27.547 14,7 24.224 14,6 2<strong>2.</strong>839 14,3 20.845 14,6 7,8 8,0<br />
- AP-68 - 15,7 Murueta / L.P. Á<strong>la</strong>va 29.543 16,0 28.526 16,2 27.052 16,1 24.747 16,2 21.823 16,2 20.783 15,8 18.690 16,0 7,9 7,9<br />
ACCESOS A LA AUTOPISTA AP-68: (VASCO ARAGONESA. BILBAO - ZARAGOZA). BIZKAIA<br />
155 B AP-68 3 - Entrada a AP-68 (BI-625) 3.907 18,3 3.817 19,0 3.513 20,0 3.314 25,3 3.014 25,3 <strong>2.</strong>896 20,0 <strong>2.</strong>352 20,0 8,8 7,2<br />
155 C AP-68 3 - Salida <strong>de</strong> AP-68 (BI-625) 3.953 21,0 3.864 21,0 3.626 20,8 3.292 20,4 <strong>2.</strong>893 20,4 <strong>2.</strong>779 19,4 <strong>2.</strong>587 19,7 7,3 8,5<br />
AUTOPISTA DE PEAJE AP-68 (VASCO ARAGONESA. BILBAO - ZARAGOZA): ÁLAVA<br />
- AP-68 - - Llodio – Ziorraga - - 28.527 16,2 27.052 16,1 24.747 16,2 21.883 16,1 20.486 15,8 18.690 16,1 8,8* 9,0*<br />
- AP-68 - - Ziorraga – Altube - - 29.568 18,0 28.049 17,8 15.179 16,3 2<strong>2.</strong>222 16,2 20.783 15,8 18.960 16,1 9,3* 11,8*<br />
- AP-68 - - Altube – Subijana - - 14.220 12,8 13.135 12,2 11.946 11,8 10.509 11,8 9.822 11,3 8.939 11,9 9,7* 11,3*<br />
- AP-68 - - Subijana – A-1 - - 14.181 12,8 13.085 12,3 11.928 11,9 10.483 11,8 9.791 11,4 8.906 11,9 9,8* 11,4*<br />
- AP-68 - - A-1 – Miranda <strong>de</strong> Ebro - - 8.012 13,2 7.420 12,9 6.590 12,6 5.381 13,0 4.773 12,8 4.382 13,8 12,8* 11,8*<br />
AUTOPISTA A-8 (BILBAO – BEHOBIA): AUTOPISTA DEL CANTÁBRICO (INCLUIDA LA SOLUCIÓN SUR). BIZKAIA<br />
183 A A-8 0 139,1 E. La Arena - E. La Haya (L.P.) 44.864 10,0 41.338 11,0 38.614 10,1 36.637 10,8 34.019 10,7 31.279 10,5 27.517 12,1 8,5 5,1<br />
182 A A-8 2 135,2 E. San Fuentes - E. La Arena 46.474 11,0 44.250 12,0 40.330 12,0 39.827 12,5 39.034 12,5 33.017 12,0 28.895 12,1 8,2 6,5<br />
181 A A-8 1 131,7 E. Puerto - E. San Fuentes 61.555 11,0 58.220 11,5 56.969 11,5 47.551 12,0 46.465 12,0 40.937 12,1 35.416 11,2 9,7 9,3<br />
180 A A-8 0 128,0 E. Portugalete - E. Santurtzi 84.351 - 81.263 13,3 78.513 12,7 74.024 12,8 7<strong>2.</strong>471 11,6 63.487 11,8 59.560 10,9 6,0 10,7*<br />
179 A A-8 2 126,5 E. Sestao - E. Portugalete 111.912 11,0 106.595 11,0 104.953 10,5 98.649 10,5 91.594 10,5 81.658 12,0 77.646 11,5 6,3 5,5<br />
178 A A-8 1 129,1 E. Cruces - E. Sestao 128.265 10,0 124.462 9,9 119.672 9,8 116.701 9,9 106.239 10,5 96.542 11,5 90.008 12,4 6,1 2,3<br />
Revisión <strong>de</strong>l Segundo P<strong>la</strong>n General <strong>de</strong> Carreteras <strong>de</strong>l País Vasco
Estación Carretera Tipo P.K. Localidad más próxima<br />
IMD<br />
2003 2002 2001 2000 1999 1998 1997<br />
%<br />
Pesados<br />
IMD<br />
%<br />
Pesados<br />
IMD<br />
%<br />
Pesados<br />
IMD<br />
%<br />
Pesados<br />
IMD<br />
%<br />
Pesados<br />
IMD<br />
%<br />
Pesados<br />
IMD<br />
%<br />
Pesados<br />
137<br />
Variación (%) 1997<br />
- 2003<br />
IMD Pesados<br />
21 A A-8 1 120,0 E. Cruces - E. Kastrexana 13<strong>2.</strong>885 - 13<strong>2.</strong>403 9,1 131.002 9,4 127.019 10,0 119.225 10,0 110.593 11,3 106.212 10,9 3,8 0,8*<br />
22 A A-8 0 118,3 E. Kastrexana - E. Sabino A. 130.788 - 134.010 9,0 13<strong>2.</strong>267 9,4 129.948 10,5 124.273 10,0 113.340 11,4 109.070 10,9 3,1 0,3*<br />
24 A A-8 1 116,7 E. Sabino A.- E. Juan Garai 111.707 11,0 109.374 10,9 115.655 10,5 113.493 10,5 114.387 9,9 97.201 11,3 85.828 12,5 4,5 2,3<br />
26 A A-8 1 - E. Juan Garai - Buia 100.920 - 96.527 12,9 94.445 12,0 9<strong>2.</strong>797 12,0 91.386 12,5 84.557 12,3 76.268 12,3 4,8 5,8*<br />
27 A A-8 1 112,9 Buia - E. Basauri 71.283 - 67.557 12,5 66.372 12,4 67.413 11,5 69.559 12,6 64.213 12,1 57.336 12,0 3,7 4,2<br />
- A-8 - 108,5 Circunva<strong>la</strong>ción a Galdakao 36.725 13,1 34.508 13,2 33.418 12,2 31.225 12,7 29.595 12,4 26.941 12,2 23.572 12,0 7,7 9,3<br />
- A-8 - 105,1 Galdakao - Erletxe 31.615 12,4 29.276 12,9 28.730 12,5 27.077 12,4 25.506 11,9 23.449 11,7 20.693 11,6 7,3 8,5<br />
- A-8 - 103,7 Erletxe - Boroa 36.192 12,8 33.453 13,0 3<strong>2.</strong>312 12,7 30.540 12,4 28.684 11,9 26.303 11,8 23.241 11,7 7,7 9,3<br />
- A-8 - 98,9 Amorebieta / Etxano 28.292 12,4 26.412 12,7 - - - - - - - - - - - -<br />
- A-8 - 95,8 Etxano – Iurreta 29.597 12,4 27.545 12,8 26.253 12,7 25.291 12,7 23.815 12,2 21.892 12,2 19.412 12,1 7,3 7,7<br />
- A-8 - 87,1 Iurreta - Zaldibar 20.945 15,6 20.027 16,3 19.385 16,7 18.559 16,8 17.603 16,2 16.524 16,2 14.877 16,2- 5,9 -<br />
ACCESOS A LA AUTOPISTA A-8 (BILBAO – BEHOBIA): AUTOPISTA DEL CANTÁBRICO. BIZKAIA<br />
180 B A-8 2 - E. Santurtzi - Kabietxe 20.272 6,0 20.189 6,0 19.693 6,0 19.467 6,0 18.224 6,0 17.406 6,0 17.860 6,5 2,1 0,8<br />
20 B A-8 2 - Kastrena – A-8 1.052 10,0 1.022 10,0 926 10,0 874 10,0 934 10,0 894 10,0 881 10,0 3,0 3,0<br />
23 A A-8 1 - E. Sabino A. 71.178 5,1 71.198 5,4 66.284 4,6 61.434 4,7 65.162 4,9 57.587 6,0 54.390 5,5 4,6 3,3<br />
AUTOPISTA A-8 (BILBAO – BEHOBIA): AUTOPISTA DEL CANTÁBRICO. GIPUZKOA<br />
271 A-8 0 72,0 Azitain / Ermua 17.301 17,1 18.972 18,1 18.291 19,0 17.460 18,6 16.465 18,1 14.600 18,9 13.969 17,5 3,6 3,2<br />
272 A-8 0 70,9 Elgoibar / Azitain 18.693 15,7 19.688 - 18.782 17,0 17.980 16,6 17.005 16,1 14.802 17,1 14.481 15,9 4,3 4,1<br />
251 A-8 0 69,5 Eibar - Elgoibar 17.205 22,0 19.915 21,0 18.619 22,0 18.210 - 19.018 - - - - - - -<br />
273 A-8 0 60,0 Itziar / Elgoibar 19.787 15,4 20.661 - 20.098 16,0 19.061 16,4 18.169 15,8 15.746 17,0 15.565 15,7 4,1 3,7<br />
274 A-8 0 52,0 Zestoa / Itziar 21.063 14,8 21.698 - 20.974 16,0 19.970 15,9 19.107 15,5 16.807 16,3 16.431 15,3 4,2 3,7<br />
275 A-8 0 45,0 Zestoa / Zarautz 24.200 14,4 24.196 - 23.236 14,0 2<strong>2.</strong>193 15,3 21.401 14,8 19.661 14,6 18.275 14,5 4,8 4,7<br />
265 A-8 0 38,0 Barrera Este 2<strong>2.</strong>064 14,0 20.800 - 19.940 - - - - - - - - -<br />
276 A-8 0 30,0 San Sebastián O. - Zarautz 30.575 13,2 29.705 - 28.670 12,0 27.198 12,4 25.999 12,1 23.886 11,7 21.317 11,9 6,2 8,0<br />
249 A-8 0 27,0 Tramo <strong>de</strong> Aritzeta 33.107 14,6 31.034 - 29.917 12,0 28.481 15,0 28.949 - - - - - - -<br />
248 A-8 0 25,2 En<strong>la</strong>ce <strong>de</strong> Aritzeta 26.030 12,0 24.755 17,0 24.198 16,0 23.559 17,0 25.701 - - - - - - -<br />
250 A-8 0 24,0 Aritzeta - Aiete 77.891 11,0 74.466 - 64.940 11,0 5<strong>2.</strong>206 13,0 45.646 - - - - - - -<br />
116 A-8 3 22,7 Túnel <strong>de</strong> Aiete 106.498 12,0 104.801 - 101.222 - 97.862 - 98.727 - 116.729 - 95.019 - 1,9 -<br />
16 A-8 2 20,7 X <strong>de</strong> <strong>la</strong> Misericordia 65.164 14,5 6<strong>2.</strong>744 23,0 61.433 23,0 59.166 23,0 55.994 23,0 5<strong>2.</strong>380 21,0 47.516 21,7 5,4 6,4<br />
117 A-8 3 18,8 Túnel <strong>de</strong> Intxaurrondo 109.711 15,5 105.879 - 101.803 - 98.516 - 93.354 - 117.369 - 9<strong>2.</strong>627 - 2,9 -<br />
277 A-8 0 16,0 Pasaia / San Sebastián Este 47.297 16,7 46.792 - 45.444 18,0 43.133 17,7 4<strong>2.</strong>766 - 38.137 17,1 36.884 15,8 5,3 6,3<br />
278 A-8 0 12,0 Oiartzun / Pasaia 41.350 18,6 4<strong>2.</strong>559 - 41.257 19,0 39.426 19,4 40.536 - 35.065 18,2 36.761 16,4 3,1 5,3<br />
279 A-8 0 9,0 Irun / Oiartzun 38.293 21,0 35.869 - 34.360 22,0 3<strong>2.</strong>837 22,4 3<strong>2.</strong>935 - 29.183 21,6 28.501 19,7 4,6 5,7<br />
280 A-8 0 7,0 Ventas <strong>de</strong> Irun / Irun 2<strong>2.</strong>780 20,2 19.816 - 18.514 22,0 17.312 21,5 17201,0 - 16189,0 18,7 15961 17,7 11,4 13,9<br />
Revisión <strong>de</strong>l Segundo P<strong>la</strong>n General <strong>de</strong> Carreteras <strong>de</strong>l País Vasco
Estación Carretera Tipo P.K. Localidad más próxima<br />
IMD<br />
2003 2002 2001 2000 1999 1998 1997<br />
%<br />
Pesados<br />
IMD<br />
%<br />
Pesados<br />
IMD<br />
%<br />
Pesados<br />
IMD<br />
%<br />
Pesados<br />
IMD<br />
%<br />
Pesados<br />
IMD<br />
%<br />
Pesados<br />
IMD<br />
%<br />
Pesados<br />
138<br />
Variación (%) 1997<br />
- 2003<br />
IMD Pesados<br />
281 A-8 0 4,0 Behobia / Ventas Irun 24.548 19,9 21.367 - 19.788 21,0 18.545 21,1 18305,0 19,5 16967,0 18,4 15117 18,8 13,7 14,7<br />
282 A-8 0 0,3 Behobia / Francia 19.831 19,6 14.932 - 13.628 21,0 1<strong>2.</strong>695 20,6 1<strong>2.</strong>733 18,8 11.965 17,1 10.202 17,6 19,6 21,7<br />
257 A-8 A 0 0,0 Puente <strong>de</strong> Behobia 18.323 49,0 17.690 52,0 16.382 44,0 - - - - - - - - - -<br />
PEAJES Y ACCESOS A AUTOPISTA A-8 (BILBAO – BEHOBIA): AUTOPISTA DEL CANTÁBRICO. GIPUZKOA<br />
260 A-8 0 70,9 Peaje <strong>de</strong> Eibar 6.100 - 5.599 - 5.391 - - - - - - - - - -<br />
261 A-8 0 64,4 Peaje <strong>de</strong> Elgoibar 5.782 - 5.363 - 5.214 - - - - - - - - - - -<br />
262 A-8 0 54,6 Peaje <strong>de</strong> Itziar 3.318 - <strong>2.</strong>975 - <strong>2.</strong>831 - - - - - - - - - - -<br />
263 A-8 0 48,8 Peaje <strong>de</strong> Zestoa 6.843 - 6.056 - 5.769 - - - - - - - - - - -<br />
264 A-8 0 38,2 Zarautz Oeste 3.716 - 3.396 - 3.292 - - - - - - - - - - -<br />
265 A-8 0 20,0 Barrera Este 2<strong>2.</strong>064 - 20.800 - 19.240 - - - - - - - - - - -<br />
266 A-8 0 0,0 Zarautz Este 9.953 - 8.906 - 8.721 - - - - - - - - - - -<br />
267 A-8 0 14,9 Pasaia - Oeste 7.014 - 5.759 - 5.647 - - - - - - - - - - -<br />
268 A-8 0 11,5 Oiartzun - Oeste 8.676 - 8.045 - 8.137 - - - - - - - - - - -<br />
269 A-8 0 7,3 Barrera Irun 37.313 - 35.869 - 34.360 - - - - - - - - - -<br />
270 A-8 0 6, 7 Ventas <strong>de</strong> Irun <strong>2.</strong>008 - 1.552 - 1.270 - - - - - - - - - - -<br />
AUTOPISTA A-15 (IRURTZUN - ADUNA). GIPUZKOA<br />
134 A-15 0 147,8 Túnel <strong>de</strong> Be<strong>la</strong>bieta 13.248 27,0 14.759 28,0 13.836 25,0 1<strong>2.</strong>961 27,0 1<strong>2.</strong>052 25,0 11.592 24,0 10.627 24,0 3,7 5,8<br />
CARRETERA N-634 (DONOSTIA-SAN SEBASTIÁN – SANTANDER – LA CORUÑA): CORREDOR UGALDEBIETA. BIZKAIA<br />
42 A N-634 2 136,1 Muskiz - L.P. Cantabria 3.986 9,0 4.259 12,5 5.057 12,5 4.082 12,5 3.686 12,6 3.322 12,6 <strong>2.</strong>524 15,5 7,9 -1,4<br />
41 A N-634 2 - Muskiz – Las Carreras 13.886 - 13.243 10,5 13.548 10,5 1<strong>2.</strong>789 10,5 1<strong>2.</strong>230 10,5 11.193 10,5 10.648 10,5 4,5 -<br />
40 C N-634 1 128,8 El Casal - Las Carreras 14.590 - 13.823 10,5 14.141 9,6 13.349 8,5 13.199 9,7 1<strong>2.</strong>071 9,7 11.974 9,5 3,3 -<br />
CARRETERA N-634 (DONOSTIA-SAN SEBASTIÁN – SANTANDER – LA CORUÑA): LÍMITE CON GIPUZKOA - ATXURI. BIZKAIA<br />
5 A N-634 3 - Miraflores - Arenal 14.463 5,0 14.865 5,0 15.743 5,0 14.403 5,0 14.104 5,0 1<strong>2.</strong>441 5,0 9.602 6,0 7,1 3,9<br />
4 B N-634 3 - Bolueta - Miraflores 29.389 5,0 30.117 5,0 29.686 5,0 29.922 5,0 28.719 5,0 28.085 5,0 26.231 6,0 1,9 -1,1<br />
2 A N-634 2 108,1 Ibarsusi - Bolueta 20.205 7,0 19.339 8,0 20.008 7,0 20.597 7,0 18.157 7,0 17.257 7,3 11.389 7,2 10,0 9,5<br />
1 A N-634 1 107,4 Ibarsusi - Etxebarri 46.654 - 45.741 5,5 44.129 5,5 43.716 5,5 40.656 6,5 38.905 6,4 37.410 7,4 3,7 -<br />
107 A N-634 2 104,0 Etxebarri - Irubi<strong>de</strong> 36.295 - 36.567 8,5 34.464 8,5 3<strong>2.</strong>254 8,5 30.726 9,0 31.798 10,6 30.794 9,0 2,8 -<br />
108 A N-634 2 103,5 Irubi<strong>de</strong> - Galdakao 41.150 - 4<strong>2.</strong>680 9,0 4<strong>2.</strong>839 9,0 4<strong>2.</strong>884 8,5 40.179 12,6 38.465 11,8 37.254 9,5 1,7 -<br />
109 A N-634 0 100,2 Galdakao - El Gallo 39.019 - 40.190 9,1 39.720 9,9 38.804 11,9 39.010 13,5 36.472 13,3 34.888 12,6 1,9 -<br />
110 A N-634 3 98,5 El Gallo - Erletxe 27.373 12,0 27.427 13,0 27.535 14,0 26.897 14,5 26.844 14,5 25.858 14,5 24.712 14,2 1,7 -1,1<br />
111 A N-634 2 93,9 Erletxe - Amorebieta O. 2<strong>2.</strong>105 15,0 23.161 14,5 23.503 16,0 23.404 15,5 21.963 15,5 21.743 15,5 2<strong>2.</strong>125 15,5 0,0 -0,6<br />
112 A N-634 1 83,7 Amorebieta - E. La Pi<strong>la</strong>stra 25.374 - 23.987 15,0 23.786 15,7 24.602 15,2 24.126 16,8 23.480 16,5 21.271 16,9 3,0 -<br />
113 A N-634 2 82,9 La Pi<strong>la</strong>stra - E. Iurreta 26.415 - 27.630 15,5 27.144 15,5 26.353 15,5 23.326 16,5 23.143 16,5 21.213 16,5 3,7 -<br />
113 B N-634 3 - E. Iurreta - Durango 27.364 10,0 28.185 10,0 - - 23.736 15,0 19.986 15,0 19.830 15,0 18.563 15,0 6,7 -0,3<br />
Revisión <strong>de</strong>l Segundo P<strong>la</strong>n General <strong>de</strong> Carreteras <strong>de</strong>l País Vasco
Estación Carretera Tipo P.K. Localidad más próxima<br />
IMD<br />
2003 2002 2001 2000 1999 1998 1997<br />
%<br />
Pesados<br />
IMD<br />
%<br />
Pesados<br />
IMD<br />
%<br />
Pesados<br />
IMD<br />
%<br />
Pesados<br />
IMD<br />
%<br />
Pesados<br />
IMD<br />
%<br />
Pesados<br />
IMD<br />
%<br />
Pesados<br />
139<br />
Variación (%) 1997<br />
- 2003<br />
IMD Pesados<br />
114 A N-634 2 79,2 Durango - Matiena 21.141 - 20.546 10,5 - - 21.663 15,5 20.292 16,5 21.216 17,5 19.861 19,0 1,0 -<br />
115 A N-634 3 - Matiena - O<strong>la</strong>kueta 1<strong>2.</strong>452 11,0 1<strong>2.</strong>876 11,0 - - 1<strong>2.</strong>986 10,5 1<strong>2.</strong>657 10,0 1<strong>2.</strong>732 15,0 13.171 15,0 -0,9 -5,9<br />
115 D N-634 1 73,6 O<strong>la</strong>kueta - Zaldibar 9.985 11,0 10.066 12,0 - - 9.452 13,0 10.234 9,3 9.717 16,6 10.190 14,2 -0,3 -4,5<br />
116 A N-634 0 70,1 Zaldibar - Areitio 7.220 - 7.368 14,8 - - 7.493 13,9 7.516 14,4 7.372 15,9 7.418 14,3 -0,4 -<br />
117 A N-634 3 - Areitio - Ermua 7.754 14,0 7.963 14,0 - - 8.001 14,0 7.913 14,0 8.165 17,0 8.201 13,5 -0,9 -0,3<br />
117 D N-634 1 65,7 Ermua - L.P. Gipuzkoa 17.109 - 16.312 7,0 - - 16.274 8,0 16.593 7,0 17.794 8,3 18.381 9,0 -1,2 -<br />
CARRETERA N-634 (DONOSTIA-SAN SEBASTIÁN – SANTANDER – A CORUÑA): DONOSTIA-SAN SEBASTIÁN - LÍMITE CON BIZKAIA. GIPUZKOA<br />
47 N-634 3 66,0 Eibar (Muga) 17.789 13,5 18.659 - 18.289 - 19.524 - 20.727 - 21.536 - 20.208 - -2,1 -<br />
11 N-634 1 61,5 Eibar 19.083 12,9 20.300 14,0 18.779 14,0 19.240 15,0 19.839 15,0 17.137 15,0 18.307 10,7 0,7 3,9<br />
106 N-634 3 59,9 Puente bajo autopista 17.506 12,0 18.122 - 18.649 - 18.385 - 18.308 - 18.269 - 15.481 - 2,1 -<br />
46 N-634 3 57,9 Sigma (Elgoibar) 17.391 12,0 19.335 - 20.131 - 20.852 - 20.557 - 19.968 - 15.698 - 1,7 -<br />
45 N-634 2 54,4 Salida <strong>de</strong> Altzo<strong>la</strong> 9.866 11,0 10.548 11,0 10.019 11,0 10.212 12,0 9.229 10,0 8.930 11,0 9.112 9,2 1,3 -<br />
43 N-634 3 45,4 Deba 6.101 12,0 6.408 - 6.022 - 5.975 - 6.470 - 4.941 - 5.707 - 1,1 -<br />
41 N-634 3 34,4 Itziar (Chatarreria) 3.928 12,0 4.312 - 4.005 - 4.212 - 4.872 - 4.604 - 4.419 - -1,9 -<br />
105 N-634 3 31,1 Cruce <strong>de</strong> Iraeta 5.369 13,0 5.476 - 5.099 - 5.389 - 5.154 - 6.094 - 5.331 - 0,1 -<br />
55 N-634 0 29,9 Arrona 10.176 14,0 10.131 14,0 10.042 14,0 9.853 15,0 9.711 15,0 9.536 16,0 9.094 14,1 1,9 1,8<br />
123 N-634 3 29,6 Salida hacía Okina 11.416 14,0 11.724 - 11.616 - 10.039 - 1<strong>2.</strong>499 - 9.573 - 11.252 - 0,2 -<br />
40 N-634 1 24,7 Getaria 6.265 12,0 7.192 12,0 6.850 13,0 6.448 15,0 6.987 14,0 7.895 - 7.128 - -2,1 -<br />
122 N-634 3 21,4 Getaria - Casa Caminer 8.362 12,0 9.469 - 8.247 - 8.969 - 9.602 - 7.905 - 9.217 - -1,6 -<br />
37 N-634 3 7,6 Aginaga 9.909 11,0 10.979 - 10.752 - 10.480 - 9.680 - 1<strong>2.</strong>559 - 1<strong>2.</strong>023 - -3,2 -<br />
104 N-634 3 1,5 Cruce Txikierdi 23.053 11,0 2<strong>2.</strong>375 - 2<strong>2.</strong>700 - 21.560 - 19.119 - 2<strong>2.</strong>085 - 18.341 - 3,9 -<br />
CARRETERA N-240 (DE TARRAGONA A BILBAO POR EL PUERTO DE BARAZAR): VITORIA-GASTEIZ - LÍMITE CON BIZKAIA. ÁLAVA<br />
61 N-240 3 4,9 Gamarra Mayor 2<strong>2.</strong>801 13,9 2<strong>2.</strong>801 13,9 2<strong>2.</strong>946 14,9 24.072 16,3 2<strong>2.</strong>658 17,5 17.489 16,7 19.649 15,61 2,5 0,5<br />
110 N-240 0 6,3 Durana 26.060 11,6 - - 24.753 14,9 25.776 16,3 24.426 17,3 24.046 16,7 21.766 15,62 3,0 -1,9<br />
111 N-240 3 15,0 Legutiano 11.047 17,6 13.038 17,5 1<strong>2.</strong>713 14,9 10.791 16,3 10.525 17,3 10.030 16,7 - - - -<br />
302 N-240 - 20,0 Ollerías 4.301 32,2 - - - - 4.881 42,6 - - - - 7.720 - -9,3 -<br />
300 N-240 1 21,5 Ubi<strong>de</strong>a 3.929 36,7 4.230 38,7 3.927 42,3 4.807 42,4 5.496 40,3 5.732 40,2 5.200 39,77 -4,6 -5,9<br />
CARRETERA N-240 (DE TARRAGONA A BILBAO POR EL PUERTO DE BARAZAR): LÍMTE CON ÁLAVA – GALDAKAO (EL GALLO). CORREDOR DEL ARRATIA (BARAZAR). BIZKAIA<br />
169 B N-240 1 40,5 Zubizabal - L.P. (Ubi<strong>de</strong>a) 4.184 40,0 4.295 41,6 4.351 41,6 4.542 44,8 5.338 43,2 4.931 40,0 5.190 41,0 -3,5 -3,9<br />
169 A N-240 3 - Barazar - Zubizabal 4.335 38,5 4.449 39,5 4.539 40,8 4.707 44,0 5.533 42,3 5.363 40,0 5.454 40,0 -3,8 -4,4<br />
168 C N-240 3 - Zeanuri - Barazar 4.738 35,5 5.029 36,5 5.139 37,5 5.118 41,0 5.951 39,8 5.692 40,0 5.618 40,0 -2,8 -4,7<br />
168 A N-240 3 - Int. BI-3530 - Zeanuri 5.624 30,5 5.906 30,0 5.987 30,0 6.185 33,5 6.961 34,7 6.630 34,3 7.002 34,0 -3,6 -5,3<br />
166 B N-240 3 - Int. BI-3530 - Zeanuri 5.967 30,0 6.126 32,0 6.740 33,0 6.650 33,0 7.309 34,0 6.995 33,0 7.387 35,0 -3,5 -5,9<br />
166 A N-240 3 -<br />
Arantzazu - Bildoso<strong>la</strong> (BI-<br />
3530)<br />
8.776 26,0 9.025 26,0 8.711 28,0 8.606 30,0 9.468 31,0 9.171 31,0 9.019 34,0 -0,5 -4,8<br />
Revisión <strong>de</strong>l Segundo P<strong>la</strong>n General <strong>de</strong> Carreteras <strong>de</strong>l País Vasco
Estación Carretera Tipo P.K. Localidad más próxima<br />
IMD<br />
2003 2002 2001 2000 1999 1998 1997<br />
%<br />
Pesados<br />
IMD<br />
%<br />
Pesados<br />
IMD<br />
%<br />
Pesados<br />
IMD<br />
%<br />
Pesados<br />
IMD<br />
%<br />
Pesados<br />
IMD<br />
%<br />
Pesados<br />
IMD<br />
%<br />
Pesados<br />
140<br />
Variación (%) 1997<br />
- 2003<br />
IMD Pesados<br />
165 C N-240 3 - Igorre - Arantzazu 9.133 25,5 9.392 26,0 9.136 27,0 9.012 29,0 9.601 31,0 9.478 30,0 9.654 32,0 -0,9 -4,6<br />
165 A N-240 0 20,0 Lemoa - Igorre 13.705 20,4 13.751 20,5 13.868 21,1 13.405 23,4 13.714 29,3 13.753 26,5 13.526 28,2 0,2 -5,0<br />
164 A N-240 3 - Bedia - Lemoa 16.835 20,0 16.572 20,0 16.387 21,0 15.840 22,0 16.324 22,0 16.204 21,5 16.920 20,0 -0,1 -0,1<br />
163 A N-240 1 11,8 El Gallo - Bedia 24.130 15,0 24.008 14,6 23.609 15,3 23.054 16,0 23.552 16,3 2<strong>2.</strong>356 16,3 20.538 18,5 2,7 -0,8<br />
CARRETERA N-637 (CRUCES – ERLETXE POR PUENTE DE RONTEGI): CORREDOR RONTEGI. BIZKAIA<br />
43 A N-637 2 8,7 E. Cruces - E. Barakaldo 13<strong>2.</strong>001 5,8 130.782 5,8 126.763 5,8 125.851 5,8 121.012 5,7 115.462 6,8 105.860 7,0 3,7 0,5<br />
45 A N-637 0 9,7 Barakaldo - Lutxana / Asua 118.754 6,3 117.657 6,2 113.266 6,4 11<strong>2.</strong>008 5,9 11<strong>2.</strong>512 5,7 106.537 7,2 97.253 7,3 3,4 0,9<br />
CARRETERA N-637 (CRUCES – ERLETXE POR PUENTE DE RONTEGI): CORREDOR TXORIHERRI. BIZKAIA<br />
45 C N-637 1 11,6 E. Kuku<strong>la</strong>rra - Enekuri (BI-604) 7<strong>2.</strong>373 5,8 50.102 7,6 43.146 7,6 41.494 7,0 39.573 6,7 36.200 8,0 34.575 8,2 13,1 6,8<br />
99 A N-637 0 12,8<br />
99 C N-637 2 -<br />
E. Asua (BI-604) - TT.<br />
Artxanda<br />
Túneles Artxanda - E.<br />
Larrondo<br />
48.244 6,3 44.983 6,3 40.952 6,9 31.386 7,2 26.281 9,5 25.360 9,2 2<strong>2.</strong>588 9,1 13,5 6,7<br />
51.155 6,1 46.153 6,1 36.685 6,5 - - - - - - - - - -<br />
99 E N-637 2 - E. Larrondo - E. Derio (N-633) 45.815 5,6 41.615 6,5 - - - - - - - - - - - -<br />
98 D N-637 1 19,7 Derio - Zamudio 24.863 9,6 26.251 11,4 26.927 10,2 25.555 9,7 24.698 10,3 2<strong>2.</strong>677 11,8 21.977 11,4 2,1 -0,8<br />
118 A N-637 2 22,6 Zamudio - Lezama 14.961 13,6 17.407 14,0 - - 16.731 14,0 14.263 16,8 14.048 17,0 13.391 16,8 1,9 -1,7<br />
118 B N-637 3 - Lezama - Vte. Larrabetzu 13.441 14,5 15.656 14,5 - - 16.091 14,5 13.277 25,0 1<strong>2.</strong>431 19,0 11.705 18,5 2,3 -1,7<br />
119 A N-637 0 27,3 Vte. Larrabetzu 10.890 19,3 11.658 19,3 - - 1<strong>2.</strong>179 17,9 11.623 27,1 10.694 21,5 10.032 21,2 1,4 -0,2<br />
110 B N-637 3 - Erletxe - Larrabetzu 17.846 15,0 18.362 15,0 18.826 15,0 18.777 15,0 17.166 19,5 16.563 15,0 14.968 15,0 3,0 3,0<br />
ACCESOS A CARRETERA N-637 (CRUCES – ERLETXE POR PUENTE DE RONTEGI): BIZKAIA<br />
44 A N-637 3 - E. Barakaldo (BI – Barakaldo) 20.217 5,0 16.284 5,5 17.282 5,5 17.173 5,5 16.508 5,5 16.407 6,0 14.652 6,0 5,5 2,4<br />
44 B N-637 3 - E. Barakaldo (Barakaldo – BI) 18.436 5,0 17.729 5,5 15.092 5,5 16.434 5,5 15.937 5,5 15.689 6,0 14.901 6,0 3,6 0,5<br />
44 C N-637 3 -<br />
44 D N-637 3 -<br />
E. Barakaldo (Barakaldo –<br />
Rontegi)<br />
E. Barakaldo (Rontegi –<br />
Barakaldo)<br />
14.420 6,0 11.533 5,5 1<strong>2.</strong>196 5,5 13.407 5,5 11.687 5,5 11.253 6,0 10.606 6,0 5,3 5,2<br />
14.174 6,0 11.969 5,5 11.959 5,5 1<strong>2.</strong>690 5,5 11.523 5,5 11.070 6,0 10.320 6,0 5,4 5,4<br />
45 B N-637 2 11,2 E. Lutxana / Asua 2<strong>2.</strong>915 8,0 23.050 8,0 25.203 7,5 26.738 7,5 25.184 7,5 25.439 7,5 24.250 8,7 -0,9 -2,3<br />
CARRETERA N-622: DE VITORIA-GASTEIZ A BILBAO POR LA AUTOPISTA AP-68. ÁLAVA<br />
51 N-622 1 4,5 Puente Zadorra 34.756 6,1 29.799 6,9 27.739 11,8 21.320 17,2 20.742 16,7 17.236 16,1 1<strong>2.</strong>617 15,0 18,4 2,0<br />
840 N-622 ETD 7,0<br />
ETD 1 - En<strong>la</strong>ce <strong>de</strong> Etxabarri<br />
Viña<br />
35.586 10,0 30.731 10,3 26.434 25,1 24.870 20,2 25.561 20,9 23.489 13,9 17.966 15,0 12,1 4,8<br />
844 N-622 3 8,6 Kas 25.136 14,6 23.873 15,1 21.485 17,2 20.337 17,2 17.919 17,0 17.631 16,1 - - - -<br />
100 N-622 0 12,9 Letona 2<strong>2.</strong>813 15,9 21.478 16,2 20.834 16,6 19.721 17,2 18.050 16,8 17.215 16,1 15.073 15,0 7,2 8,2<br />
102 N-622 ETD 23,3 ETD 2 - Peaje AP-68 Altube 16.110 20,4 13.299 15,4 15.652 21,5 13.677 19,8 - - - - - - - -<br />
CARRETERA N-636 (DE BEASAIN A DURANGO POR KANPAZAR): LÍMITE CON GIPUZKOA - DURANGO. BIZKAIA<br />
174 A N-636 3 - Durango - Abadiño 1<strong>2.</strong>319 10,0 11.973 10,0 10.206 10,0 9.949 10,0 9.441 10,0 9.237 10,0 9.083 10,0 5,2 5,2<br />
Revisión <strong>de</strong>l Segundo P<strong>la</strong>n General <strong>de</strong> Carreteras <strong>de</strong>l País Vasco
Estación Carretera Tipo P.K. Localidad más próxima<br />
IMD<br />
2003 2002 2001 2000 1999 1998 1997<br />
%<br />
Pesados<br />
IMD<br />
%<br />
Pesados<br />
IMD<br />
%<br />
Pesados<br />
IMD<br />
%<br />
Pesados<br />
IMD<br />
%<br />
Pesados<br />
IMD<br />
%<br />
Pesados<br />
IMD<br />
%<br />
Pesados<br />
141<br />
Variación (%) 1997<br />
- 2003<br />
IMD Pesados<br />
175 A N-636 0 35,1 Abadiño - Apatamonasterio 14.322 12,1 13.696 13,1 13.261 13,6 13.010 11,7 1<strong>2.</strong>713 13,0 1<strong>2.</strong>425 12,1 11.691 11,9 3,4 3,7<br />
176 A N-636 3 - Apatamonasterio - Vte. Elorrio 15.860 12,5 13.791 12,5 13.459 12,0 13.094 12,0 1<strong>2.</strong>796 13,0 1<strong>2.</strong>505 12,0 11.757 11,0 5,1 7,4<br />
176 C N-636 2 -<br />
Elorrio O. - L.P. (Pto.<br />
Kanpazar)<br />
6.464 16,0 6.344 16,0 6.232 16,0 6.266 16,0 5.923 16,0 6.420 16,0 4.861 16,0 4,9 4,9<br />
176 E N-636 2 - Vte. Elorrio - E. Elorrio 5.727 13,5 5.769 13,5 - - - - - - - - - - - -<br />
176 F N-636 3 - E. Elorrio - Elorrio 4.995 15,0 5.032 15,0 - - - - - - - - - - - -<br />
CARRETERA N-636 (DE BEASAIN A DURANGO POR KANPAZAR): BEASAIN N-I - LÍMITE CON BIZKAIA. GIPUZKOA<br />
54 N-636 3 34,7 Alto Kanpazar 6.897 23,0 7.323 - 7.413 - 7.463 - 7.198 - 5.684 - 5.120 - 5,1 -<br />
133 N-636 1 33,9 Epele - Kanpazar 3.556 37,0 3.556 38,0 3.292 37,0 3.133 40,0 <strong>2.</strong>689 38,0 <strong>2.</strong>794 42,0 <strong>2.</strong>337 31,2 7,2 10,3<br />
15 N-636 3 22,6 Salida hacia Deskarga 11.685 19,0 11.449 - 11.351 - 1<strong>2.</strong>192 - 10.595 - 10.551 - 8.238 - 6,0 -<br />
9213 N-636 3 19,7 Salida a Deskarga 9.233 20,0 9.104 - 8.919 - 9.050 - 8.680 - 9.690 - 7.486 - 3,6 -<br />
9159 N-636 3 16,6 Alto <strong>de</strong> Deskarga 9.197 20,0 9.547 - 9.130 - 6.491 - 8.815 - 9.668 - 7.257 - 4,0 -<br />
9359 N-636 3 9,3 Cruce <strong>de</strong> Ezkio 19.621 22,0 18.678 - 18.014 - 18.522 - 18.660 - 15.742 - 1<strong>2.</strong>992 - 7,1 -<br />
87 N-636 1 7,0 Cruce <strong>de</strong> Ezkio 16.463 22,0 16.800 22,0 15.454 21,0 15.247 21,0 14.830 22,0 14.934 22,0 13.481 18,9 3,4 6,0<br />
170 N-636 3 4,0 Ormaiztegi 17.045 22,2 16.530 - 14.810 - 13.511 - - - - - - - - -<br />
10169 N-636 2 2,1 Ormaiztegi 17.059 22,6 15.375 23,0 15.655 25,0 14.326 24,3 13.042 23,0 11.929 23,0 - - - -<br />
CARRETERA N-102: (DE N-I A VITORIA-GASTEIZ, DIRECCIÓN FRANCIA): N-I EN ARIÑEZ – VITORIA-GASTEIZ EN ARMENTIA. ÁLAVA<br />
130 N-102 1 345,1 Gomecha 15.239 6,6 - - 20.358 6,3 19.170 6,8 18.779 7,2 19.058 8,0 16.034 6,1 - -<br />
CARRETERA N-104 (DE VITORIA-GASTEIZ A N-I, DIRECCIÓN FRANCIA): VITORIA-GASTEIZ EN ARANA – N-I (VENTA DE PATIO). ÁLAVA<br />
10 N-104 1 355,3 Campo <strong>de</strong> Aviación - - - - 15.929 3,8 16.298 4,4 15.737 7,2 14.872 5,7 14.050 4,76 - -<br />
11 N-104 3 355,5 Arkaute 1<strong>2.</strong>329 6,1 11.484 10,3 11.197 3,8 10.228 4,4 11.244 7,3 8.481 5,7 8.346 4,77 6,7 11,1<br />
350 N-104 1 358,8 Matauco 6.617 6,4 6.193 7,1 5.706 7,1 6.070 7,4 6.122 7,2 6.117 6,7 5.138 9,01 4,3 -1,5<br />
CARRETERA N-124: DE VITORIA-GASTEIZ A LOGROÑO POR HARO. ÁLAVA<br />
122 N-124 0 26,5 Cadiñanos 10.502 22,3 10.083 22,3 9.911 22,7 9.599 26,4 10.018 27,1 9.800 23,6 9.156 21,93 2,3 2,6<br />
592 N-124 1 30,7 Zambrana 10.584 26,5 9.935 26,1 10.460 19,3 9.970 25,4 10.071 27,6 - - - - - -<br />
590 N-124 1 35,2 Salinil<strong>la</strong>s <strong>de</strong> Buradón 10.655 25,7 10.205 25,6 9.797 26,9 9.667 24,9 10.261 26,8 10.165 24,5 10.094 21,93 0,9 3,6<br />
CARRETERA N-629 (BURGOS – SANTOÑA): TÉRMINO MUNICIPAL DE LANESTOSA. BIZKAIA<br />
66 B N-629 3 - Lanestosa – L.P. (Bercedo) 1.106 7,0 1.155 7,0 947 8,0 1.087 7,0 909 7,0 883 8,0 938 8,0 2,8 0,4<br />
66 C N-629 2 - Lanestosa – L.P. (Ramales) 1.398 8,0 1.361 8,0 1.201 7,0 1.107 8,0 1.044 8,0 930 8,0 995 8,0 5,8 5,9<br />
CARRETERA N-639 Y N-644: ACCESO PUERTO DE BILBAO. BIZKAIA<br />
54 B N-639 3 - Zierbana - El Puerto (Zierbana) <strong>2.</strong>761 9,0 <strong>2.</strong>621 9,0 <strong>2.</strong>402 9,0 <strong>2.</strong>818 9,0 <strong>2.</strong>619 9,0 <strong>2.</strong>520 9,0 3.218 9,0 -2,5 -2,6<br />
54 C N-639 3 - La Cuesta - El Casal 5.007 8,0 4.620 8,0 4.082 8,0 4.459 8,0 4.093 8,0 3.618 8,0 3.909 8,0 4,2 4,2<br />
181 B N-644 2 130,4 A-8 – Puerto Santurtzi - - 15.310 29,4 16.161 27,0 15.220 25,0 14.156 25,3 1<strong>2.</strong>921 23,1 11.476 20,7 - -<br />
CARRETERA N-633: ACCESO AL AEROPUERTO DE LOIU POR ALDEKONE (BILBAO). BIZKAIA<br />
80 C N-633 2 - BI-631 - Aeropuerto 11.079 2,8 10.382 6,0 10.129 6,0 9.501 3,0 10.112 6,0 9.801 6,0 8.989 6,0 3,5 -8,8<br />
Revisión <strong>de</strong>l Segundo P<strong>la</strong>n General <strong>de</strong> Carreteras <strong>de</strong>l País Vasco
Estación Carretera Tipo P.K. Localidad más próxima<br />
IMD<br />
2003 2002 2001 2000 1999 1998 1997<br />
%<br />
Pesados<br />
IMD<br />
%<br />
Pesados<br />
IMD<br />
%<br />
Pesados<br />
IMD<br />
%<br />
Pesados<br />
IMD<br />
%<br />
Pesados<br />
IMD<br />
%<br />
Pesados<br />
IMD<br />
%<br />
Pesados<br />
142<br />
Variación (%) 1997<br />
- 2003<br />
IMD Pesados<br />
98 C N-633 2 - Derio – Al<strong>de</strong>kone (Aeropuerto) 37.780 7,0 33.990 6,0 - - - - - - - - - - - -<br />
CARRETERA N-624: ACCESO AL AEROPUERTO DE FORONDA (VITORIA-GASTEIZ). ÁLAVA<br />
841 N-624 1 8,50 Foronda 1.239 - 1.267 4, 9 <strong>2.</strong>138 13,1 <strong>2.</strong>003 15,9 <strong>2.</strong>293 10,0 <strong>2.</strong>036 5,8 1.664 5,0 -4,8 -<br />
CARRETERA N-638: ACCESO AL AEROPUERTO DE HONDARRIBIA (DONOSTIA-SAN SEBASTIÁN). GIPUZKOA<br />
128 N-638 3 0,2 Hondarribia 1<strong>2.</strong>520 7,5 1<strong>2.</strong>101 - 13.372 - 10.692 - 10.905 - 10.314 - 9.614 - 4,5 -<br />
118 N-638 3 1,6 Entre Amute y Aeropuerto 25.355 6,0 23.578 - 26.406 - 21.605 - 2<strong>2.</strong>659 - 2<strong>2.</strong>673 - 18.339 - 5,5 -<br />
Se ha llevado a cabo un cálculo <strong>de</strong> <strong>la</strong> IMD pon<strong>de</strong>rada <strong>de</strong> <strong>la</strong>s carreteras <strong>de</strong> <strong>la</strong> Red <strong>de</strong> Interés Preferente. El<br />
resultado se presenta en el siguiente gráfico, que se or<strong>de</strong>na <strong>de</strong> mayor a menor IMD:<br />
50,000<br />
45,000<br />
40,000<br />
35,000<br />
30,000<br />
25,000<br />
20,000<br />
15,000<br />
10,000<br />
5,000<br />
0<br />
IMD PONDERADA EN LA RED DE INTERÉS PREFERENTE<br />
A-8<br />
N-637<br />
N-I<br />
N-633<br />
N-622<br />
N-638<br />
AP-68<br />
IMD 2003<br />
AP-1<br />
N-634<br />
N-644<br />
IMD 2003<br />
Fuente: E<strong>la</strong>boración propia a partir <strong>de</strong> los datos <strong>de</strong> <strong>la</strong>s Diputaciones Forales. Nota: Los datos <strong>de</strong> <strong>la</strong> AP-1 correspon<strong>de</strong>n al año 200<strong>2.</strong><br />
El gráfico anterior, si bien no permite el <strong>análisis</strong> pormenorizado <strong>de</strong> aquellos tramos <strong>de</strong> mayor intensidad <strong>de</strong> tráfico,<br />
da una i<strong>de</strong>a muy aproximada <strong>de</strong> cuáles son los ejes fundamentales <strong>de</strong> distribución <strong>de</strong>l tráfico en <strong>la</strong> Comunidad<br />
Autónoma, al contrastar intensidad <strong>de</strong> tráfico con longitud. Así, aquel<strong>la</strong>s vías que cuenten con una mayor IMD<br />
N-102<br />
A-15<br />
N-240<br />
Fuente: E<strong>la</strong>boración propia a partir <strong>de</strong> los datos <strong>de</strong> <strong>la</strong>s Diputaciones Forales <strong>de</strong> Á<strong>la</strong>va, Gipuzkoa y Bizkaia.<br />
N-124<br />
N-636<br />
N-104<br />
N-639<br />
N-629<br />
pon<strong>de</strong>rada estarán reflejando una mayor regu<strong>la</strong>ridad en sus volúmenes <strong>de</strong> tráfico a lo <strong>la</strong>rgo <strong>de</strong> su recorrido o<br />
bien, en el caso <strong>de</strong> carreteras <strong>de</strong> poca longitud, un alto grado <strong>de</strong> utilización.<br />
Un ejemplo <strong>de</strong>l primer caso es <strong>la</strong> A-8, vía que comunica <strong>la</strong>s Áreas Metropolitanas <strong>de</strong> Bilbao y Donostia – San<br />
Sebastián, siendo el eje fundamental <strong>de</strong>l norte <strong>de</strong> <strong>la</strong> Comunidad Autónoma, y permitiendo el acceso a <strong>la</strong> Frontera<br />
Francesa en Behobia <strong>de</strong>s<strong>de</strong> los tres Territorios Históricos y <strong>de</strong>s<strong>de</strong> el resto <strong>de</strong>l Estado. Esta carretera prácticamente<br />
alcanza los 142 kilómetros <strong>de</strong> longitud en <strong>la</strong> CAPV, lo que dada su IMD pon<strong>de</strong>rada implica que a lo <strong>la</strong>rgo <strong>de</strong> <strong>la</strong><br />
misma se mantienen niveles <strong>de</strong> tráfico importantes. De hecho, dichos niveles superan los 15.000 vehículos en su<br />
tramo <strong>de</strong> menor utilización (en el límite <strong>de</strong> los Territorios Históricos <strong>de</strong> Bizkaia y Gipuzkoa), y los 100.000 en los<br />
<strong>de</strong> mayor afluencia <strong>de</strong> vehículos (en <strong>la</strong>s Áreas Metropolitanas <strong>de</strong> Bilbao y Donostia – San Sebastián).<br />
Junto con <strong>la</strong> A-8, <strong>de</strong>staca en intensidad <strong>de</strong> tráfico pon<strong>de</strong>rado <strong>la</strong> carretera N-637. Esta vía, al contrario <strong>de</strong> <strong>la</strong><br />
anterior, no cuenta con una gran longitud (apenas 20 kilómetros), pero mantiene importantes niveles <strong>de</strong> IMD,<br />
superando los 50.000 vehículos en buena parte <strong>de</strong> su recorrido. Su localización explica estos volúmenes, ya que <strong>la</strong><br />
N-637 se sitúa en al Área Metropolitana <strong>de</strong> Bilbao, en los cor<strong>red</strong>ores Rontegi y Txoriherri.<br />
A<strong>de</strong>más <strong>de</strong> <strong>la</strong>s dos anteriores superan los 15.000 vehículos <strong>de</strong> IMD pon<strong>de</strong>rada, <strong>la</strong> N-I, que mantiene niveles<br />
importantes en toda su longitud; <strong>la</strong>s carreteras <strong>de</strong> pequeña longitud N-633, acceso al Aeropuerto <strong>de</strong> Loiu, N-622,<br />
<strong>de</strong> acceso <strong>de</strong>s<strong>de</strong> Vitoria a <strong>la</strong> AP-68, y N-638, carretera <strong>de</strong> acceso al Aeropuerto <strong>de</strong> Hondarribia – San Sebastián;<br />
así como <strong>la</strong> AP-68, vía fundamental <strong>de</strong> acceso a Bilbao <strong>de</strong>s<strong>de</strong> el Territorio Histórico <strong>de</strong> Á<strong>la</strong>va y <strong>de</strong>s<strong>de</strong> <strong>la</strong> Meseta;<br />
AP-1, tramo <strong>de</strong> peaje <strong>de</strong> <strong>la</strong> N-I; y <strong>la</strong> N-634, <strong>de</strong> recorrido y longitud simi<strong>la</strong>r a <strong>la</strong> A-8, N-644, <strong>de</strong> acceso al Puerto <strong>de</strong><br />
Bilbao y <strong>la</strong> N-102, <strong>de</strong> acceso a Vitoria <strong>de</strong>s<strong>de</strong> <strong>la</strong> N-I.<br />
Revisión <strong>de</strong>l Segundo P<strong>la</strong>n General <strong>de</strong> Carreteras <strong>de</strong>l País Vasco
En el <strong>la</strong>do contrario, <strong>de</strong>stacan por su menor IMD pon<strong>de</strong>rada <strong>la</strong> N-629, carretera Burgos – Santoña, cuyo paso por<br />
Bizkaia se circunscribe al Término Municipal <strong>de</strong> Lanestosa. Esta carretera en ningún punto supera los 1.500<br />
vehículos diarios.<br />
Por su parte, en el gráfico siguiente se representan <strong>la</strong>s carreteras <strong>de</strong> <strong>la</strong> Red <strong>de</strong> Interés Preferente según su<br />
porcentaje medio <strong>de</strong> vehículos pesados. Este porcentaje medio <strong>de</strong> pesados se obtiene, para cada carretera, como<br />
el cociente <strong>de</strong> <strong>la</strong> IMD pon<strong>de</strong>rada <strong>de</strong> vehículos pesados y <strong>la</strong> IMD pon<strong>de</strong>rada <strong>de</strong>l total <strong>de</strong> vehículos.<br />
PORCENTAJE MEDIO DE VEHÍCULOS PESADOS EN LA RED DE INTERÉS PREFERENTE<br />
35.00%<br />
30.00%<br />
25.00%<br />
20.00%<br />
15.00%<br />
10.00%<br />
5.00%<br />
0.00%<br />
N-644<br />
AP-1<br />
A-15<br />
N-124<br />
N-I<br />
N-240<br />
% PESADOS 2003<br />
N-636<br />
N-622<br />
AP-68<br />
A-8<br />
N-634<br />
% PESADOS 2003<br />
Fuente: E<strong>la</strong>boración propia a partir <strong>de</strong> los datos <strong>de</strong> <strong>la</strong>s Diputaciones Forales. Nota: los datos <strong>de</strong> <strong>la</strong> AP-1 correspon<strong>de</strong>n a 200<strong>2.</strong><br />
Superan el 15% <strong>de</strong> vehículos pesados <strong>la</strong> N-644, <strong>de</strong> acceso al puerto <strong>de</strong> Bilbao y que prácticamente alcanza el<br />
30%, <strong>la</strong> AP-1, <strong>la</strong> A-15, <strong>la</strong> N-124 (<strong>de</strong> Vitoria a Logroño por Haro), <strong>la</strong> N-I, N-240 (<strong>de</strong> Vitoria a Bilbao por el puerto <strong>de</strong><br />
Barazar, y vía alternativa a <strong>la</strong> AP-68), N-636 (<strong>de</strong> Beasain a Durango por Kanpazar) y <strong>la</strong> N-62<strong>2.</strong> En estos casos <strong>la</strong><br />
fuerte presencia <strong>de</strong> vehículos pesados se explica por <strong>la</strong> funcionalidad portuaria (N-644), por tratarse <strong>de</strong> ejes <strong>de</strong><br />
distribución fundamental (caso <strong>de</strong> <strong>la</strong> N-I, <strong>la</strong> AP-1 o <strong>la</strong> A-15, y también, en menor medida, <strong>de</strong> <strong>la</strong> N-124) y / o<br />
alternativos a vías <strong>de</strong> peaje (como <strong>la</strong> N-240 y <strong>la</strong> N-636), y <strong>de</strong> acceso a áreas metropolitanas, como es el caso <strong>de</strong><br />
<strong>la</strong> N-62<strong>2.</strong><br />
Es interesante resaltar que, en media, ninguna carretera <strong>de</strong> <strong>la</strong> Red <strong>de</strong> Interés Preferente se encuentra por <strong>de</strong>bajo<br />
<strong>de</strong>l 5% <strong>de</strong> pesados, siendo relevante, como se ha visto, el número <strong>de</strong> el<strong>la</strong>s que sobrepasan el 15%.<br />
N-639<br />
N-629<br />
N-637<br />
N-102<br />
N-638<br />
N-104<br />
N-633<br />
Se presenta a continuación un gráfico don<strong>de</strong> figura <strong>la</strong> tasa <strong>de</strong> crecimiento medio acumu<strong>la</strong>tivo anual (%) en el<br />
período <strong>de</strong> <strong>análisis</strong> (1997 – 2003) para <strong>la</strong>s carreteras <strong>de</strong> <strong>la</strong> Red <strong>de</strong> Interés Preferente. Para <strong>la</strong>s carreteras N-644,<br />
AP-1 y AP-68, en que se carece <strong>de</strong> dato para 2003, <strong>la</strong> tasa <strong>de</strong> incremento se ha calcu<strong>la</strong>do para el período 1997 –<br />
200<strong>2.</strong><br />
VARIACIÓN DE LA INTENSIDAD DE TRÁFICO TOTAL (%) EN LA RED DE INTERÉS PREFERENTE<br />
20.0<br />
15.0<br />
10.0<br />
5.0<br />
0.0<br />
-5.0<br />
-10.0<br />
N-633 (B)<br />
AP-1 (A)<br />
AP-68 (A)<br />
AP-68 (B)<br />
N-637 (B)<br />
N-636 (G)<br />
N-622 (A)<br />
PERÍODO 1997 – 2003<br />
N-644 (B)<br />
N-638 (G)<br />
N-104 (A)<br />
N-I (A)<br />
Fuente: E<strong>la</strong>boración propia a partir <strong>de</strong> los datos <strong>de</strong> <strong>la</strong>s Diputaciones Forales. Nota: para <strong>la</strong> AP-1 se ha tomado el periodo 1997 – 200<strong>2.</strong><br />
La carretera que mayor crecimiento ha experimentado en los últimos seis años es <strong>la</strong> N-633 que da acceso al<br />
Aeropuerto <strong>de</strong> Loiu. En esta carretera, <strong>la</strong> tasa <strong>de</strong> crecimiento acumu<strong>la</strong>tiva anual ha sido <strong>de</strong>l 18%, lo que se explica<br />
por <strong>la</strong> reciente puesta en funcionamiento <strong>de</strong> dichas insta<strong>la</strong>ciones aeroportuarias. En segundo lugar, <strong>la</strong> AP-1 ha<br />
experimentado un crecimiento anual por encima <strong>de</strong>l 10%, pasando <strong>de</strong> 10.000 vehículos en 1997 a 16.281 en<br />
200<strong>2.</strong><br />
Por encima <strong>de</strong>l 5% anual se encuentran también <strong>la</strong> AP-68, tanto en Bizkaia como en Á<strong>la</strong>va (9,7 y 7,9%,<br />
respectivamente), <strong>la</strong> N-637 (7,2%), N-636 (7,1%), N-622 (6,5%), N-644 (5,9%), N-638 (5,2%), N-104 (5,2%), y<br />
<strong>la</strong> N-I en el Territorio Histórico <strong>de</strong> Á<strong>la</strong>va (5,2%).<br />
Por <strong>de</strong>bajo <strong>de</strong> ese crecimiento se encuentran algunas <strong>de</strong> <strong>la</strong>s vías fundamentales <strong>de</strong> <strong>la</strong> Comunidad Autónoma,<br />
como <strong>la</strong> A-8, tanto en Bizkaia como en Gipuzkoa (3,6 y 3,8%, respectivamente), <strong>la</strong> N-I en Gipuzkoa (2,5%), <strong>la</strong> N-<br />
634 (1,8% en Bizkaia y –0,1% en Gipuzkoa), o <strong>la</strong> A-15 (3,7%).<br />
N-629 (B)<br />
A-8 (G)<br />
A-15 (G)<br />
A-8 (B)<br />
N-I (G)<br />
N-634 (B)<br />
N-124 (A)<br />
N-639 (B)<br />
N-636 (B)<br />
N-634 (G)<br />
143<br />
Revisión <strong>de</strong>l Segundo P<strong>la</strong>n General <strong>de</strong> Carreteras <strong>de</strong>l País Vasco<br />
N-644 (Bizkaia)<br />
N-240 (A)<br />
N-624 (A)
Por su parte, aquel<strong>la</strong>s carreteras don<strong>de</strong> el número <strong>de</strong> vehículos se ha visto <strong>red</strong>ucido <strong>de</strong>s<strong>de</strong> el año 1997 hasta el<br />
año 2003, son <strong>la</strong> N-624, que da acceso al Aeropuerto <strong>de</strong> Foronda en Vitoria-Gasteiz (-4,8%), <strong>la</strong> N-240 tanto en<br />
Bizkaia como en Á<strong>la</strong>va (-0,4 y –1,5%, respectivamente) y <strong>la</strong> citada carretera N-634 a su paso por el Territorio<br />
Histórico <strong>de</strong> Gipuzkoa. Estos cuatro tramos <strong>de</strong> carretera son los únicos que han obtenido crecimientos negativos<br />
en el período seña<strong>la</strong>do en el total <strong>de</strong> vías integrantes <strong>de</strong> <strong>la</strong> Red <strong>de</strong> Interés Preferente.<br />
VARIACIÓN DE LA INTENSIDAD DE TRÁFICO DE PESADOS (%) EN LA RED DE INTERÉS PREFERENTE<br />
20,0<br />
15,0<br />
10,0<br />
5,0<br />
0,0<br />
-5,0<br />
-10,0<br />
N-633 (B)<br />
N-644 (B)<br />
A-8 (G)<br />
AP-68 (A)<br />
AP-1 (A)<br />
AP-68 (B)<br />
N-636 (G)<br />
N-622 (A)<br />
PERÍODO 1997 – 2003<br />
A-15 (G)<br />
N-104 (A)<br />
N-124 (A)<br />
Fuente: E<strong>la</strong>boración propia a partir <strong>de</strong> los datos <strong>de</strong> <strong>la</strong>s Diputaciones Forales. Nota: para <strong>la</strong> AP-1 se ha tomado el periodo 1997 – 200<strong>2.</strong><br />
Respecto a <strong>la</strong> categoría <strong>de</strong> pesados y al igual que el crecimiento total <strong>de</strong> vehículos, es <strong>la</strong> carretera N-633 aquel<strong>la</strong><br />
don<strong>de</strong> más ha crecido esta tipología <strong>de</strong> vehículos con una tasa <strong>de</strong> crecimiento anual acumu<strong>la</strong>do <strong>de</strong>l 18,3%,<br />
pudiéndose aplicar el mismo comentario que en el caso <strong>de</strong> <strong>la</strong> IMD total. En segundo lugar y con crecimiento anual<br />
<strong>de</strong>l 13,6%, se sitúa <strong>la</strong> carretera N-644, explicándose este crecimiento por su funcionalidad <strong>de</strong> acceso al Puerto <strong>de</strong><br />
Bilbao.<br />
A<strong>de</strong>más <strong>de</strong> <strong>la</strong>s anteriores, tuvieron un crecimiento <strong>de</strong> vehículos pesados por encima <strong>de</strong>l 10% <strong>la</strong> A-8 en Gipuzkoa<br />
(12,1%), <strong>la</strong> AP-68 en Á<strong>la</strong>va (11,3%) y <strong>la</strong> AP-1 (10,3%). Por encima <strong>de</strong>l 5% se sitúan también <strong>la</strong> AP-68 en Bizkaia<br />
(8,7%), <strong>la</strong> N-636 en Gipuzkoa (8,4%), <strong>la</strong> N-622 (6%), <strong>la</strong> A-15 (5,8%) y <strong>la</strong> N-102 (5,1%).<br />
N-629 (B)<br />
A-8 (B)<br />
N-634 (G)<br />
N-636 (B)<br />
N-637 (B)<br />
N-639 (B)<br />
N-I (G)<br />
N-I (A)<br />
N-638 (G)<br />
N-634 (B)<br />
N-240 (B)<br />
N-624 (A)<br />
En cuanto al resto <strong>de</strong> vías fundamentales cabe <strong>de</strong>stacar el 3,2% <strong>de</strong> crecimiento anual <strong>de</strong> <strong>la</strong> A-8 en el tramo <strong>de</strong><br />
Bizkaia, o el escaso 0,7% <strong>de</strong> <strong>la</strong> N-I en Gipuzkoa. En cuanto a <strong>la</strong> N-634 contrasta el crecimiento <strong>de</strong>l 2,7% en el<br />
tramo <strong>de</strong> Gipuzkoa (coincidiendo con un <strong>de</strong>scenso <strong>de</strong> <strong>la</strong> IMD total, lo que indica un trasvase <strong>de</strong> vehículos ligeros a<br />
<strong>la</strong> A-8), con el <strong>de</strong>scenso <strong>de</strong>l -3,1% que se ha registrado en el tramo <strong>de</strong> Bizkaia. La N-I en Á<strong>la</strong>va y <strong>la</strong> N-638 se<br />
sitúan en crecimiento cero.<br />
Junto con el seña<strong>la</strong>do <strong>de</strong> <strong>la</strong> N-634 en Bizkaia han sufrido crecimientos negativos <strong>la</strong> N-240, tanto en Bizkaia como<br />
en Á<strong>la</strong>va (-3,8 y –3,7%, respectivamente) y <strong>la</strong> N-624 (-5,7%). En el caso <strong>de</strong> <strong>la</strong> N-240, este <strong>de</strong>scenso <strong>de</strong>l<br />
porcentaje <strong>de</strong> pesados permitiría explicar el crecimiento registrado por <strong>la</strong> AP-68, ya que parece haberse producido<br />
un trasvase entre ambas carreteras. En cuanto a <strong>la</strong> N-624, vía <strong>de</strong> acceso al aeropuerto vitoriano <strong>de</strong> Foronda, el<br />
<strong>de</strong>scenso <strong>de</strong> pesados es compatible con el comportamiento general <strong>de</strong> <strong>la</strong> IMD <strong>de</strong> esta vía, que registra el mayor<br />
<strong>de</strong>scenso en términos globales, lo que parece reflejar un <strong>de</strong>scenso en <strong>la</strong> actividad <strong>de</strong> dichas insta<strong>la</strong>ciones<br />
aeroportuarias.<br />
La N-121-A, <strong>de</strong> <strong>la</strong> que no se disponen datos <strong>de</strong> aforo, no se ha incluido en los gráficos anteriores.<br />
En los siguientes gráficos, se presenta el valor <strong>de</strong> <strong>la</strong> IMD en <strong>la</strong>s carreteras <strong>de</strong> <strong>la</strong> Red <strong>de</strong> Interés Preferente que<br />
forman parte <strong>de</strong> <strong>la</strong> Red Funcional, en 2003, y <strong>de</strong> <strong>la</strong>s que se disponga datos <strong>de</strong> tráfico para ese año.<br />
80,000<br />
70,000<br />
60,000<br />
50,000<br />
40,000<br />
30,000<br />
20,000<br />
10,000<br />
0<br />
Puente Nuevo<br />
INTENSIDAD DE TRÁFICO EN LA AUTOVIA N-I: AUTOVÍA NORTE<br />
Yurre<br />
Durana<br />
Lubiano<br />
Venta <strong>de</strong>l Patio<br />
Arrieta<br />
Salvatierra o Agurain<br />
Mezkia<br />
Urabain<br />
IM D 2003<br />
Puerto <strong>de</strong> Etxegarate (Gipuzkoa)<br />
Beasain<br />
Itsasondo<br />
Variante Ikaztegieta<br />
Variante <strong>de</strong> Tolosa<br />
Irura<br />
Sorabil<strong>la</strong><br />
Andoain<br />
Alto <strong>de</strong> Lasarte Oria<br />
A. De Miracruz Atego<br />
Herrera - Escaleril<strong>la</strong>s<br />
Kaputxinos<br />
Variante Errenteria<br />
Variante Errenteria<br />
Recta <strong>de</strong> Lintzirin<br />
Final Gaintxurizketa<br />
Behobia<br />
Behobia<br />
Fuente: E<strong>la</strong>boración propia a partir <strong>de</strong> los datos <strong>de</strong> <strong>la</strong>s Diputaciones Forales.<br />
IM D<br />
144<br />
Revisión <strong>de</strong>l Segundo P<strong>la</strong>n General <strong>de</strong> Carreteras <strong>de</strong>l País Vasco
La Autovía N-I, Autovía <strong>de</strong>l Norte, presenta menores valores <strong>de</strong> IMD en el Territorio Histórico <strong>de</strong> Á<strong>la</strong>va que en el<br />
<strong>de</strong> Gipuzkoa. En Á<strong>la</strong>va los menores valores <strong>de</strong> IMD son los registrados al comienzo <strong>de</strong> <strong>la</strong> carretera, cerca <strong>de</strong>l límite<br />
con <strong>la</strong> provincia <strong>de</strong> Burgos (entre Miranda <strong>de</strong> Ebro y Armiñón), en torno a los 15.000 vehículos / día, y los<br />
mayores valores a su paso por el Condado <strong>de</strong> Treviño con más <strong>de</strong> 30.000 vehículos / día y en <strong>la</strong> Circunva<strong>la</strong>ción <strong>de</strong><br />
Vitoria-Gasteiz con una IMD comprendida 2<strong>2.</strong>000 vehículos / día y 37.000 vehículos / día en el año 2003. Al este<br />
<strong>de</strong> Vitoria, entre Venta <strong>de</strong> Patio y el límite con Navarra, <strong>la</strong> IMD se mantiene entre 20.000 y 25.000 vehículos día.<br />
En el tramo guipuzcoano <strong>de</strong> <strong>la</strong> Autovía N-I, a partir <strong>de</strong> Beasain, el valor <strong>de</strong> <strong>la</strong> IMD aumenta consi<strong>de</strong>rablemente, tal<br />
y como se observa en el gráfico, alcanzando en torno a los 70.000 vehículos / día en Andoain, lugar don<strong>de</strong> se ha<br />
recogido el tráfico proce<strong>de</strong>nte <strong>de</strong> <strong>la</strong> Autopista A-15. En <strong>la</strong>s inmediaciones <strong>de</strong> Donostia – San Sebastián el tráfico se<br />
mantiene alre<strong>de</strong>dor <strong>de</strong> los 50.000 vehículos, <strong>de</strong>scendiendo mo<strong>de</strong>radamente <strong>de</strong>s<strong>de</strong> aquí hasta <strong>la</strong> frontera con<br />
Francia, don<strong>de</strong> se registran 14.000 vehículos en <strong>la</strong> última estación <strong>de</strong> aforo <strong>de</strong> esta carretera en Behobia.<br />
60.00%<br />
50.00%<br />
40.00%<br />
30.00%<br />
20.00%<br />
10.00%<br />
0.00%<br />
Puente Nuevo<br />
PORCENTAJE DE PESADOS EN LA AUTOVIA N-I: AUTOVÍA NORTE<br />
Yurre<br />
Durana<br />
Lubiano<br />
Venta <strong>de</strong>l Patio<br />
Arrieta<br />
Salvatierra o Agurain<br />
Mezkia<br />
Urabain<br />
IM D 2003<br />
% Pesados<br />
Puerto <strong>de</strong> Etxegarate (Gipuzkoa)<br />
Beasain<br />
Itsasondo<br />
Variante Ikaztegieta<br />
Variante <strong>de</strong> Tolosa<br />
Irura<br />
Sorabil<strong>la</strong><br />
Andoain<br />
Alto <strong>de</strong> Lasarte Oria<br />
Fuente: E<strong>la</strong>boración propia a partir <strong>de</strong> los datos <strong>de</strong> <strong>la</strong>s Diputaciones Forales.<br />
A. De Miracruz Atego<br />
Herrera - Escaleril<strong>la</strong>s<br />
Kaputxinos<br />
Variante Errenteria<br />
Variante Errenteria<br />
Recta <strong>de</strong> Lintzirin<br />
Final Gaintxurizketa<br />
Behobia<br />
Behobia<br />
Respecto al tráfico <strong>de</strong> pesados, <strong>la</strong> carretera se mantiene en porcentajes <strong>de</strong> pesados alre<strong>de</strong>dor <strong>de</strong>l 30% en el<br />
Territorio Histórico <strong>de</strong> Á<strong>la</strong>va, con valores absolutos que osci<strong>la</strong>n entre los 5.000 y los 1<strong>2.</strong>000 vehículos. En el tramo<br />
guipuzcoano, con excepción <strong>de</strong>l Puerto <strong>de</strong> Etxegarate, los porcentajes se mantienen por <strong>de</strong>bajo <strong>de</strong>l 20%, con<br />
valores absolutos que, sin embargo, se mantienen en el mismo rango. El menor porcentaje <strong>de</strong> pesados, por<br />
<strong>de</strong>bajo <strong>de</strong>l 10%, se registra al final <strong>de</strong> <strong>la</strong> carretera, en <strong>la</strong>s inmediaciones <strong>de</strong> <strong>la</strong> frontera francesa.<br />
Para <strong>la</strong> Autopista <strong>de</strong> Peaje Vasco Aragonesa (AP-68), <strong>de</strong> Bilbao a Zaragoza, se dispone <strong>de</strong> valores <strong>de</strong> IMD para el<br />
año 2002 para el conjunto <strong>de</strong> <strong>la</strong> carretera. En este caso, los valores <strong>de</strong> IMD son <strong>de</strong>crecientes registrándose mayor<br />
volumen en el tramo correspondiente al Territorio Histórico <strong>de</strong> Bizkaia, con una IMD <strong>de</strong> 34.500 vehículos / día<br />
entre Ugao / Miraballes y Arakaldo (Bizkaia), que <strong>de</strong>scien<strong>de</strong> en el tramo a<strong>la</strong>vés, llegando a tan sólo 8.000<br />
vehículos / día entre <strong>la</strong> Autopista AP-1 y Miranda <strong>de</strong> Ebro, en Á<strong>la</strong>va.<br />
40,000<br />
35,000<br />
30,000<br />
25,000<br />
20,000<br />
15,000<br />
10,000<br />
5,000<br />
0<br />
Buia - Arrigorriaga<br />
Ugao / Mirabelles - Arakaldo<br />
INTENSIDAD DE TRÁFICO EN LA AUTOPISTA DE PEAJE AP-68:<br />
Arakaldo / Murueta<br />
VASCO ARAGONESA BILBAO - ZARAGOZA<br />
Fuente: E<strong>la</strong>boración propia a partir <strong>de</strong> los datos <strong>de</strong> <strong>la</strong>s Diputaciones Forales.<br />
Con respecto al tráfico <strong>de</strong> pesados éste se mantiene en porcentajes entre el 12 y el 18% a lo <strong>la</strong>rgo <strong>de</strong> toda <strong>la</strong><br />
carretera, reflejando un comportamiento parejo al <strong>de</strong>l total <strong>de</strong> <strong>la</strong> IMD.<br />
IM D<br />
145<br />
Revisión <strong>de</strong>l Segundo P<strong>la</strong>n General <strong>de</strong> Carreteras <strong>de</strong>l País Vasco
20.00%<br />
18.00%<br />
16.00%<br />
14.00%<br />
1<strong>2.</strong>00%<br />
10.00%<br />
8.00%<br />
6.00%<br />
4.00%<br />
<strong>2.</strong>00%<br />
0.00%<br />
Buia - Arrigorriaga<br />
PORCENTAJE DE PESADOS EN LA AUTOPISTA DE PEAJE AP-68:<br />
Ugao / Mirabelles - Arakaldo<br />
VASCO ARAGONESA BILBAO - ZARAGOZA<br />
Arakaldo / Murueta<br />
IMD 2003<br />
% Pesados<br />
Fuente: E<strong>la</strong>boración propia a partir <strong>de</strong> los datos <strong>de</strong> <strong>la</strong>s Diputaciones Forales.<br />
La Autopista <strong>de</strong> Peaje A-8 (Bilbao – Behobia) recorre los Territorios Históricos <strong>de</strong> Bizkaia y <strong>de</strong> Gipuzkoa. Se<br />
observa al analizar <strong>la</strong> gráfica <strong>de</strong> IMD que el tráfico se divi<strong>de</strong> en tres tramos. El primero <strong>de</strong> ellos en Bilbao<br />
Metropolitano, don<strong>de</strong> crece <strong>de</strong>s<strong>de</strong> 41.000 vehículos / día en el límite con <strong>la</strong> provincia <strong>de</strong> Cantabria hasta más <strong>de</strong><br />
130.000 vehículos / día en el en<strong>la</strong>ce <strong>de</strong> Kastrexana (Bilbao) para <strong>de</strong>crecer posteriormente hasta <strong>la</strong> variante <strong>de</strong><br />
Galdakao. En este punto comienza el segundo tramo hasta el en<strong>la</strong>ce <strong>de</strong> Aritzeta (antes <strong>de</strong> Donostia-San<br />
Sebastián), don<strong>de</strong> el tráfico se mantiene estable en torno a los 25.000 vehículos / día. Finalmente, el último tramo<br />
en el que se ha dividido el tráfico <strong>de</strong> <strong>la</strong> Autopista A-8, es el comprendido entre Donostia-San Sebastián y Behobia.<br />
En este tramo, el tráfico llega a superar los 100.000 vehículos / día a su paso por <strong>la</strong> capital guipuzcoana y a partir<br />
<strong>de</strong> <strong>la</strong> localidad <strong>de</strong> Pasaia <strong>de</strong>crece hasta que en Behobia se registran los menores valores <strong>de</strong> toda <strong>la</strong> autopista<br />
(15.000 vehículos / día).<br />
INTENSIDAD DE TRÁFICO EN LA AUTOPISTA A-8: AUTOPISTA DEL CÁNTABRICO<br />
140,000<br />
120,000<br />
100,000<br />
80,000<br />
60,000<br />
40,000<br />
20,000<br />
0<br />
Puente <strong>de</strong> Behobia<br />
Behobia / Francia<br />
Oiratzun / Pasaia<br />
X <strong>de</strong> <strong>la</strong> Misericordia<br />
Aritzeta - Ariete<br />
En<strong>la</strong>ce <strong>de</strong> Aritzeta<br />
Tramo <strong>de</strong> Aritzeta<br />
IM D 2003<br />
Zestoa / Zarautz<br />
Zestoa / Itziar<br />
Itziar / Elgoibar<br />
Eibar / Elgoibar<br />
Elgoibar / Azitain<br />
Azitain / Ermua<br />
Iurreta - Zaldibar<br />
IM D<br />
Amorebieta / Etxano<br />
Erletxes - Boroa<br />
Galdakao - Erletxes<br />
Fuente: E<strong>la</strong>boración propia a partir <strong>de</strong> los datos <strong>de</strong> <strong>la</strong>s Diputaciones Forales.<br />
Buia - E. Basauri<br />
E. Sabino A.- E. Juan Garai<br />
E. Kastrexana - E. Sabino A.<br />
E. Cruces - E. Kastrexana<br />
E. Sestao - E. Portugalete<br />
E. Cruces - E. Sestao<br />
E. Perto - E. S. Fuentes<br />
E. San Fuentes - E. La Arena<br />
E. La Arena - E. La Haya (L.P.)<br />
En cuanto al tráfico <strong>de</strong> pesados, éste se mantiene entre el 10 y el 20% en toda <strong>la</strong> carretera, observándose una<br />
punta importante en <strong>la</strong> frontera francesa en que el porcentaje prácticamente alcanza el 50%. En el resto, cabe<br />
<strong>de</strong>stacar que los porcentajes se mantienen alre<strong>de</strong>dor <strong>de</strong>l 20% entre Donostia – San Sebastián y <strong>la</strong> frontera con<br />
Francia, situándose más cercanos al 10% entre <strong>la</strong> capital guipuzcoana y el límite con Cantabria, sin que se<br />
observe un incremento <strong>de</strong>stacable en porcentaje en el área metropolitana <strong>de</strong> Bilbao.<br />
Tales porcentajes <strong>de</strong> pesados indican que el comportamiento <strong>de</strong> estos vehículos sugiere un perfil semejante al <strong>de</strong><br />
<strong>la</strong> IMD global en esta vía.<br />
146<br />
Revisión <strong>de</strong>l Segundo P<strong>la</strong>n General <strong>de</strong> Carreteras <strong>de</strong>l País Vasco
INTENSIDAD DE PESADOS EN LA AUTOPISTA A-8: AUTOPISTA DEL CÁNTABRICO<br />
60.00%<br />
50.00%<br />
40.00%<br />
30.00%<br />
20.00%<br />
10.00%<br />
0.00%<br />
Puente <strong>de</strong> Behobia<br />
Behobia / Francia<br />
Oiratzun / Pasaia<br />
X <strong>de</strong> <strong>la</strong> Misericordia<br />
Aritzeta - Ariete<br />
En<strong>la</strong>ce <strong>de</strong> Aritzeta<br />
Tramo <strong>de</strong> Aritzeta<br />
IM D 2003<br />
Zestoa / Zarautz<br />
Zestoa / Itziar<br />
Itziar / Elgoibar<br />
Eibar / Elgoibar<br />
Elgoibar / Azitain<br />
Azitain / Ermua<br />
Iurreta - Zaldibar<br />
% P esados<br />
Amorebieta / Etxano<br />
Erletxes - Boroa<br />
Galdakao - Erletxes<br />
Fuente: E<strong>la</strong>boración propia a partir <strong>de</strong> los datos <strong>de</strong> <strong>la</strong>s Diputaciones Forales.<br />
E. Sabino A.- E. Juan Garai<br />
E. Sestao - E. Portugalete<br />
E. Cruces - E. Sestao<br />
E. Perto - E. S. Fuentes<br />
E. San Fuentes - E. La Arena<br />
E. La Arena - E. La Haya (L.P.)<br />
La carretera N-634 presenta un trazado sensiblemente paralelo a <strong>la</strong> autopista A-8, siendo complementaria <strong>de</strong> <strong>la</strong><br />
misma y usándose como distribuidora <strong>de</strong> los viajes <strong>de</strong> <strong>la</strong> vía principal. Los mayores valores <strong>de</strong> <strong>la</strong> carretera tienen<br />
lugar en el área <strong>de</strong>l Bilbao Metropolitano, don<strong>de</strong> se superan los 45.000 vehículos día. Fuera <strong>de</strong>l área <strong>de</strong> influencia<br />
bilbaína, <strong>la</strong> carretera cuenta con puntas <strong>de</strong> tráfico en <strong>la</strong>s inmediaciones <strong>de</strong> Eibar, en el límite entre los Territorios<br />
Históricos <strong>de</strong> Bizkaia y Gipuzkoa, don<strong>de</strong> prácticamente se alcanzan los 20.000 vehículos, así como en <strong>la</strong>s<br />
inmediaciones <strong>de</strong> Donostia – San Sebastián, don<strong>de</strong> <strong>la</strong> IMD se acerca a los 25.000 vehículos.<br />
INTENSIDAD DE TRÁFICO EN LA CARRETERA N- 634: DONOSTIA-SAN SEBASTIÁN- SANTANDER- LA<br />
CORUÑA<br />
50,000<br />
45,000<br />
40,000<br />
35,000<br />
30,000<br />
25,000<br />
20,000<br />
15,000<br />
10,000<br />
5,000<br />
0<br />
Cruce Txikierdi<br />
Aginaga<br />
Getaria - Casa Caminer<br />
Getaria<br />
IMD 2003<br />
Arrona<br />
Cruce <strong>de</strong> Iraeta<br />
Itziar (Chatarreria)<br />
Deba<br />
Salida <strong>de</strong> Altzo<strong>la</strong><br />
Sigma (Elgoibar)<br />
Puente bajo autopista<br />
Eibar<br />
Ermua - L.P. Gipuzkoa<br />
Areitio - Ermua<br />
Zaldibar - Areitio<br />
O<strong>la</strong>kueta - Zaldibar<br />
Matiena - O<strong>la</strong>kueta<br />
Durango - Matiena<br />
E. Iurreta - Durango<br />
La Pi<strong>la</strong>stra - E. Iurreta<br />
Amorebieta - E. La Pi<strong>la</strong>stra<br />
Erletxes - Amorebieta O.<br />
El Gallo - Erletxes<br />
Galdakao - El Gallo<br />
Irubi<strong>de</strong> - Galdakao<br />
Etxebarri - Irubi<strong>de</strong><br />
Ibarsusi - Etxebarri<br />
Ibarsusi - Bolueta<br />
Bolueta - Miraflores<br />
Miraflores - Arenal<br />
Basurto - Kastrexana<br />
IMD<br />
Fuente: E<strong>la</strong>boración propia a partir <strong>de</strong> los datos <strong>de</strong> <strong>la</strong>s Diputaciones Forales.<br />
147<br />
Retuerto - Cruces<br />
Ugarte - Retuerto<br />
Ugarte - Zabal<strong>la</strong><br />
Trapagan - Ortuel<strong>la</strong><br />
Nocedal - Ortuel<strong>la</strong><br />
El Casal - Nocedal<br />
El Casal - Las Carreras<br />
Muskiz - L.P. Cantabria<br />
El porcentaje <strong>de</strong> pesados presenta un comportamiento muy constante en esta carretera, manteniéndose a lo <strong>la</strong>rgo<br />
<strong>de</strong> <strong>la</strong> misma alre<strong>de</strong>dor <strong>de</strong>l 10%. Destacan los porcentajes cercanos al 15% que se observan en el área <strong>de</strong>l Bilbao<br />
Metropolitano y en <strong>la</strong>s inmediaciones <strong>de</strong> Eibar, reflejando un comportamiento semejante al <strong>de</strong> <strong>la</strong> IMD.<br />
Revisión <strong>de</strong>l Segundo P<strong>la</strong>n General <strong>de</strong> Carreteras <strong>de</strong>l País Vasco
INTENSIDAD DE PESADOS EN LA CARRETERA N- 634: DONOSTIA-SAN SEBASTIÁN- SANTANDER- LA<br />
CORUÑA<br />
16.00%<br />
14.00%<br />
1<strong>2.</strong>00%<br />
10.00%<br />
8.00%<br />
6.00%<br />
4.00%<br />
<strong>2.</strong>00%<br />
0.00%<br />
Cruce Txikierdi<br />
Aginaga<br />
Getaria - Casa Caminer<br />
Getaria<br />
IMD 2003<br />
Arrona<br />
Cruce <strong>de</strong> Iraeta<br />
Itziar (Chatarreria)<br />
Deba<br />
Salida <strong>de</strong> Altzo<strong>la</strong><br />
Sigma (Elgoibar)<br />
Puente bajo autopista<br />
Eibar<br />
Ermua - L.P. Gipuzkoa<br />
Areitio - Ermua<br />
Zaldibar - Areitio<br />
O<strong>la</strong>kueta - Zaldibar<br />
Matiena - O<strong>la</strong>kueta<br />
Durango - Matiena<br />
E. Iurreta - Durango<br />
La Pi<strong>la</strong>stra - E. Iurreta<br />
Amorebieta - E. La Pi<strong>la</strong>stra<br />
Erletxes - Amorebieta O.<br />
El Gallo - Erletxes<br />
Galdakao - El Gallo<br />
Irubi<strong>de</strong> - Galdakao<br />
Etxebarri - Irubi<strong>de</strong><br />
Ibarsusi - Etxebarri<br />
Ibarsusi - Bolueta<br />
Bolueta - Miraflores<br />
Miraflores - Arenal<br />
Basurto - Kastrexana<br />
% P esado s<br />
Fuente: E<strong>la</strong>boración propia a partir <strong>de</strong> los datos <strong>de</strong> <strong>la</strong>s Diputaciones Forales.<br />
Retuerto - Cruces<br />
Ugarte - Retuerto<br />
Ugarte - Zabal<strong>la</strong><br />
Trapagan - Ortuel<strong>la</strong><br />
Nocedal - Ortuel<strong>la</strong><br />
El Casal - Nocedal<br />
El Casal - Las Carreras<br />
Muskiz - L.P. Cantabria<br />
La carretera N-240 une Vitoria-Gasteiz en Á<strong>la</strong>va con Lemoa en Bizkaia. Los mayores valores <strong>de</strong> tráfico tienen lugar<br />
en su comienzo, es <strong>de</strong>cir, en <strong>la</strong> capital a<strong>la</strong>vesa con una IMD que supera los 25.000 vehículos, y en su final, justo<br />
antes <strong>de</strong> <strong>la</strong> intersección con <strong>la</strong> autopista A-8, con una IMD <strong>de</strong>l or<strong>de</strong>n <strong>de</strong> 24.000 vehículos / día. En el trazado<br />
intermedio el tráfico es uniforme variando <strong>de</strong> 4.000 vehículos / día a 9.300 vehículos / día.<br />
INTENSIDAD DE TRÁFICO EN LA CARRETERA N-240: TARRAGONA - BILBAO POR BARAZAR<br />
30,000<br />
25,000<br />
20,000<br />
15,000<br />
10,000<br />
5,000<br />
0<br />
Gamarra Mayor<br />
Durana<br />
Legutiano<br />
Ubi<strong>de</strong>a<br />
Zubizabal - L.P. (Ubi<strong>de</strong>a)<br />
Barazar - Zubizabal<br />
IMD 2003<br />
Zeanuri - Barazar<br />
Int. BI-3530 - Zeanuri<br />
Int. BI-3530 - Zeanuri<br />
Arantzazu - Bildoso<strong>la</strong> (BI-3530)<br />
Igorre - Arantzazu<br />
Fuente: E<strong>la</strong>boración propia a partir <strong>de</strong> los datos <strong>de</strong> <strong>la</strong>s Diputaciones Forales.<br />
IMD<br />
Lemoa - Igorre<br />
Bedia - Lemoa<br />
El Gallo - Bedia<br />
El tráfico <strong>de</strong> pesados presenta un comportamiento mucho más uniforme, lo cual pue<strong>de</strong> comprobarse observando<br />
los porcentajes a lo <strong>la</strong>rgo <strong>de</strong> <strong>la</strong> carretera, que tien<strong>de</strong>n a ser superiores en <strong>la</strong> parte central <strong>de</strong> <strong>la</strong> vía, don<strong>de</strong> <strong>la</strong> IMD<br />
global es inferior. En dicho tramo central los porcentajes <strong>de</strong> pesados alcanzan el 40%, reflejando el menor<br />
trasvase <strong>de</strong> este tipo <strong>de</strong> vehículos a <strong>la</strong> autopista AP-68 que el que se produce con los vehículos ligeros.<br />
148<br />
Revisión <strong>de</strong>l Segundo P<strong>la</strong>n General <strong>de</strong> Carreteras <strong>de</strong>l País Vasco
INTENSIDAD DE PESADOS EN LA CARRETERA N-240: TARRAGONA - BILBAO POR BARAZAR<br />
45.00%<br />
40.00%<br />
35.00%<br />
30.00%<br />
25.00%<br />
20.00%<br />
15.00%<br />
10.00%<br />
5.00%<br />
0.00%<br />
Gamarra Mayor<br />
Durana<br />
Legutiano<br />
Ubi<strong>de</strong>a<br />
Zubizabal - L.P. (Ubi<strong>de</strong>a)<br />
Barazar - Zubizabal<br />
IMD 2003<br />
Zeanuri - Barazar<br />
Int. BI-3530 - Zeanuri<br />
Int. BI-3530 - Zeanuri<br />
Arantzazu - Bildoso<strong>la</strong> (BI-3530)<br />
% Pesado s<br />
Igorre - Arantzazu<br />
Fuente: E<strong>la</strong>boración propia a partir <strong>de</strong> los datos <strong>de</strong> <strong>la</strong>s Diputaciones Forales.<br />
Lemoa - Igorre<br />
Bedia - Lemoa<br />
El Gallo - Bedia<br />
La carretera N-637 <strong>de</strong> Bizkaia se ubica entre el En<strong>la</strong>ce <strong>de</strong> Cruces y Erletxe. Incluye el Cor<strong>red</strong>or Rontegi (entre el<br />
En<strong>la</strong>ce <strong>de</strong> Cruces y Erandio) y el Cor<strong>red</strong>or Txoriherri (Erandio – Erletxe). Presenta un tráfico <strong>de</strong>creciente <strong>de</strong>s<strong>de</strong> el<br />
Cor<strong>red</strong>or Rontegi (don<strong>de</strong> los tráficos son los más altos, pues se superan los 115.000 vehículos / día y los 7.200<br />
vehículos pesados / día) hasta Erletxe (intersección <strong>de</strong> <strong>la</strong> N-637 y N-634). A lo <strong>la</strong>rgo <strong>de</strong> todo el cor<strong>red</strong>or,<br />
excluyendo el Cor<strong>red</strong>or Rontegi, <strong>la</strong> IMD en el año 2003 varía <strong>de</strong> los 7<strong>2.</strong>300 vehículos / día en el En<strong>la</strong>ce Kuku<strong>la</strong>rra<br />
(Erandio) a los 17.800 vehículos / día en Erletxe.<br />
INTENSIDAD DE TRÁFICO EN LA CARRETERA N-637: CRUCES – ERLETXE. BIZKAIA<br />
150,000<br />
125,000<br />
100,000<br />
75,000<br />
50,000<br />
25,000<br />
0<br />
E. Cruces - E. Barakaldo<br />
Barakaldo - Lutxana / Asua<br />
E. Kuku<strong>la</strong>rra - Enekuri (BI-604)<br />
E. Asua (BI-604) - TT. Artxanda<br />
IM D 2003<br />
E. Larrondo - E. Derio (N-633)<br />
Derio - Zamudio<br />
Zamudio - Lezama<br />
Lezama - Vte. Larrabeztu<br />
Fuente: E<strong>la</strong>boración propia a partir <strong>de</strong> los datos <strong>de</strong> <strong>la</strong>s Diputaciones Forales.<br />
IM D<br />
Vte. Larrabeztu<br />
Erletxes - Larrabeztu<br />
En cuanto al tráfico <strong>de</strong> pesados, éste se mantiene en porcentajes <strong>de</strong> alre<strong>de</strong>dor <strong>de</strong>l 5% en el Rontegi, aumentando<br />
a partir <strong>de</strong> aquí hasta un máximo <strong>de</strong>l 19% en Larrabetzu.<br />
149<br />
Revisión <strong>de</strong>l Segundo P<strong>la</strong>n General <strong>de</strong> Carreteras <strong>de</strong>l País Vasco
INTENSIDAD DE PESADOS EN LA CARRETERA N-637: CRUCES – ERLETXE. BIZKAIA<br />
25.00%<br />
20.00%<br />
15.00%<br />
10.00%<br />
5.00%<br />
0.00%<br />
E. Cruces - E. Barakaldo<br />
Barakaldo - Lutxana / Asua<br />
E. Asua (BI-604) - TT. Artxanda<br />
E. Kuku<strong>la</strong>rra - Enekuri (BI-604)<br />
IM D 2003<br />
E. Larrondo - E. Derio (N-633)<br />
Derio - Zamudio<br />
% P esados<br />
Zamudio - Lezama<br />
Lezama - Vte. Larrabeztu<br />
Fuente: E<strong>la</strong>boración propia a partir <strong>de</strong> los datos <strong>de</strong> <strong>la</strong>s Diputaciones Forales.<br />
Vte. Larrabeztu<br />
Erletxes - Larrabeztu<br />
La conexión entre Vitoria-Gasteiz y <strong>la</strong> Autopista <strong>de</strong> Peaje AP-68 a <strong>la</strong> altura <strong>de</strong> Altube se realiza mediante <strong>la</strong><br />
carretera N-62<strong>2.</strong> Carretera que presenta un <strong>de</strong>crecimiento uniforme <strong>de</strong>s<strong>de</strong> <strong>la</strong> capital a<strong>la</strong>vesa hasta <strong>la</strong> conexión con<br />
dicha autopista, pasando <strong>de</strong> registrar en su comienzo más <strong>de</strong> 35.000 vehículos / día a registrar al final <strong>de</strong> <strong>la</strong><br />
misma alre<strong>de</strong>dor <strong>de</strong> 16.000 vehículos / día, en el tramo más cercano a <strong>la</strong> citada autopista.<br />
INTENSIDAD DE TRÁFICO EN LA CARRETERA N-622: DE VITORIA-GASTEIZ A BILBAO POR LA<br />
AUTOPISTA AP-68. ÁLAVA<br />
40,000<br />
35,000<br />
30,000<br />
25,000<br />
20,000<br />
15,000<br />
10,000<br />
5,000<br />
0<br />
Puente Zadorra<br />
IM D 2003<br />
Kas<br />
Letona<br />
Fuente: E<strong>la</strong>boración propia a partir <strong>de</strong> los datos <strong>de</strong> <strong>la</strong>s Diputaciones Forales.<br />
IM D<br />
Peaje AP-68 Altube<br />
El comportamiento <strong>de</strong> vehículos pesados en <strong>la</strong> carretera N-622 refleja volúmenes constantes a lo <strong>la</strong>rgo <strong>de</strong> <strong>la</strong><br />
carretera, lo cual se traduce en un perfil creciente en porcentaje, registrándose los mayores porcentajes en <strong>la</strong>s<br />
inmediaciones <strong>de</strong> <strong>la</strong> AP-68.<br />
150<br />
Revisión <strong>de</strong>l Segundo P<strong>la</strong>n General <strong>de</strong> Carreteras <strong>de</strong>l País Vasco
INTENSIDAD DE PESADOS EN LA CARRETERA N-622: DE VITORIA-GASTEIZ A BILBAO POR LA<br />
AUTOPISTA AP-68. ÁLAVA<br />
25.00%<br />
20.00%<br />
15.00%<br />
10.00%<br />
5.00%<br />
0.00%<br />
Puente Zadorra<br />
IM D 2003<br />
Kas<br />
% P esados<br />
Letona<br />
Fuente: E<strong>la</strong>boración propia a partir <strong>de</strong> los datos <strong>de</strong> <strong>la</strong>s Diputaciones Forales.<br />
Peaje AP-68 Altube<br />
Las carreteras GI-632 y BI-632 se han incorporado a <strong>la</strong> Red <strong>de</strong> Interés Preferente bajo <strong>la</strong> <strong>de</strong>nominación <strong>de</strong> N-636<br />
y comunican Durango en Bizkaia con Beasain en Gipuzkoa. El comportamiento <strong>de</strong>l tráfico refleja <strong>la</strong> existencia <strong>de</strong><br />
dos tramos <strong>de</strong> mayor intensidad, coinci<strong>de</strong>ntes con el tramo comprendido entre Zumarraga y Beasain en Gipuzkoa,<br />
don<strong>de</strong> se alcanzan los 19.000 vehículos al día, y <strong>la</strong>s inmediaciones <strong>de</strong> Durango y Abadiño, don<strong>de</strong> no se alcanzan<br />
los 15.000. En el resto <strong>de</strong> <strong>la</strong> carretera el tráfico baja, especialmente en <strong>la</strong> zona limítrofe entre ambos Territorios<br />
Históricos, en que llega a situarse por <strong>de</strong>bajo <strong>de</strong> los 5.000 vehículos en el Puerto <strong>de</strong> Kanpazar.<br />
INTENSIDAD DE TRÁFICO EN LA CARRETERA N-636: DE BEASAIN A DURANGO POR KANPAZAR<br />
30,000<br />
25,000<br />
20,000<br />
15,000<br />
10,000<br />
5,000<br />
0<br />
Ormaiztegi<br />
Ormaiztegi<br />
Cruce <strong>de</strong> Ezkio<br />
Cruce <strong>de</strong> Ezkio<br />
Alto <strong>de</strong> Deskarga<br />
Salida a Deskarga<br />
Salida hacia Deskarga<br />
IM D 2003<br />
Epele - Kanpazar<br />
Alto Kanpazar<br />
IM D<br />
E. Elorrio - Elorrio<br />
Vte. Elorrio - E. Elorrio<br />
Apatamonasterio - Vte. Elorrio<br />
Elorrio O. - L.P. (Pto. Kanpazar)<br />
Fuente: E<strong>la</strong>boración propia a partir <strong>de</strong> los datos <strong>de</strong> <strong>la</strong>s Diputaciones Forales.<br />
En cuanto al tráfico <strong>de</strong> pesados este se mantiene en porcentajes altos (superiores al 20%) en todo el tramo<br />
guipuzcoano, con una punta <strong>de</strong>l 37% en <strong>la</strong> subida a Kanpazar. En Bizkaia los porcentajes bajan para situarse<br />
alre<strong>de</strong>dor <strong>de</strong>l 15%.<br />
151<br />
Revisión <strong>de</strong>l Segundo P<strong>la</strong>n General <strong>de</strong> Carreteras <strong>de</strong>l País Vasco
PORCENTAJE DE PESADOS EN LA CARRETERA N-636: DE BEASAIN A DURANGO POR KANPAZAR<br />
40.00%<br />
35.00%<br />
30.00%<br />
25.00%<br />
20.00%<br />
15.00%<br />
10.00%<br />
5.00%<br />
0.00%<br />
Ormaiztegi<br />
Ormaiztegi<br />
Cruce <strong>de</strong> Ezkio<br />
Cruce <strong>de</strong> Ezkio<br />
Alto <strong>de</strong> Deskarga<br />
Salida a Deskarga<br />
Salida hacia Deskarga<br />
IM D 2003<br />
Epele - Kanpazar<br />
Alto Kanpazar<br />
% P esados<br />
E. Elorrio - Elorrio<br />
Vte. Elorrio - E. Elorrio<br />
Apatamonasterio - Vte. Elorrio<br />
Elorrio O. - L.P. (Pto. Kanpazar)<br />
Fuente: E<strong>la</strong>boración propia a partir <strong>de</strong> los datos <strong>de</strong> <strong>la</strong>s Diputaciones Forales.<br />
De <strong>la</strong> carretera N-104 (Vitoria-Gasteiz - Venta <strong>de</strong> Patio), únicamente se disponen datos <strong>de</strong> dos <strong>de</strong> <strong>la</strong>s tres<br />
estaciones <strong>de</strong> aforo <strong>de</strong> <strong>la</strong>s que cuenta. En el<strong>la</strong>s, el comportamiento <strong>de</strong>l tráfico total y el comportamiento <strong>de</strong> <strong>la</strong><br />
categoría <strong>de</strong> pesados es simi<strong>la</strong>r, pues los mayores valores <strong>de</strong> IMD son los registrados en Arkaute (tras <strong>la</strong> conexión<br />
con <strong>la</strong> carretera A-132), y los más bajos en <strong>la</strong> estación más alejada <strong>de</strong> <strong>la</strong> capital a<strong>la</strong>vesa don<strong>de</strong> el número <strong>de</strong><br />
vehículos <strong>de</strong>crece en más <strong>de</strong> 5.200 vehículos / día.<br />
INTENSIDAD DE TRÁFICO EN LA CARRETERA N-104: DE VITORIA-GASTEIZ A N-I, DIRECCIÓN<br />
FRANCIA (ÁLAVA)<br />
20,000<br />
15,000<br />
10,000<br />
5,000<br />
0<br />
Arcaute<br />
IM D 2003<br />
Matauco<br />
Fuente: E<strong>la</strong>boración propia a partir <strong>de</strong> los datos <strong>de</strong> <strong>la</strong>s Diputaciones Forales.<br />
En consecuencia con lo comentado, los porcentajes <strong>de</strong> pesados se mantienen al mismo nivel <strong>de</strong>l 6% en ambos<br />
puntos.<br />
IM D<br />
152<br />
Revisión <strong>de</strong>l Segundo P<strong>la</strong>n General <strong>de</strong> Carreteras <strong>de</strong>l País Vasco
INTENSIDAD DE PESADOS EN LA CARRETERA N-104: DE VITORIA-GASTEIZ A N-I, DIRECCIÓN<br />
FRANCIA (ÁLAVA)<br />
10.00%<br />
9.00%<br />
8.00%<br />
7.00%<br />
6.00%<br />
5.00%<br />
4.00%<br />
3.00%<br />
<strong>2.</strong>00%<br />
1.00%<br />
Arcaute<br />
IM D 2003<br />
% P esados<br />
Matauco<br />
Fuente: E<strong>la</strong>boración propia a partir <strong>de</strong> los datos <strong>de</strong> <strong>la</strong>s Diputaciones Forales.<br />
La carretera N-124 (Armiñón – Briñas) es, <strong>de</strong> <strong>la</strong>s carreteras <strong>de</strong> Interés Preferente, <strong>la</strong> localizada más al sur <strong>de</strong> <strong>la</strong><br />
Comunidad Autónoma <strong>de</strong>l País Vasco. El tráfico en dicha carretera es uniforme en todo su trazado, siendo <strong>la</strong> IMD<br />
media <strong>de</strong> <strong>la</strong> misma, en torno a los 10.500 vehículos / día en el 2003.<br />
En <strong>la</strong>s tres estaciones <strong>de</strong> aforo existentes el nivel <strong>de</strong> IMD es muy constante, manteniéndose en el entorno <strong>de</strong> los<br />
10.500 vehículos apuntados.<br />
INTENSIDAD DE TRÁFICO EN LA CARRETERA N-124: DE VITORIA-GASTEIZ A LOGROÑO POR HARO<br />
(ÁLAVA)<br />
10,000<br />
7,500<br />
5,000<br />
IM D 2003<br />
Zambrana<br />
Fuente: E<strong>la</strong>boración propia a partir <strong>de</strong> los datos <strong>de</strong> <strong>la</strong>s Diputaciones Forales.<br />
Los vehículos pesados, por el contrario, presentan un comportamiento simi<strong>la</strong>r, situándose en todo momento en<br />
niveles importantes, alre<strong>de</strong>dor <strong>de</strong>l 25%.<br />
IM D<br />
153<br />
Revisión <strong>de</strong>l Segundo P<strong>la</strong>n General <strong>de</strong> Carreteras <strong>de</strong>l País Vasco
PORCENTAJE DE PESADOS EN LA CARRETERA N-124: DE VITORIA-GASTEIZ A LOGROÑO POR HARO<br />
(ÁLAVA)<br />
30.00%<br />
25.00%<br />
20.00%<br />
15.00%<br />
10.00%<br />
5.00%<br />
0.00%<br />
IMD 2003<br />
Zambrana<br />
% P esado s<br />
Fuente: E<strong>la</strong>boración propia a partir <strong>de</strong> los datos <strong>de</strong> <strong>la</strong>s Diputaciones Forales.<br />
La carretera N-629 que une Santoña, en Cantabria, con Trespa<strong>de</strong>rne, en Burgos, atraviesa en un tramo <strong>de</strong> poca<br />
longitud el Término Municipal <strong>de</strong> Lanestosa en el Territorio Histórico <strong>de</strong> Bizkaia, siendo <strong>la</strong> carretera situada más al<br />
oeste <strong>de</strong> todas <strong>la</strong>s que constituyen <strong>la</strong> Red <strong>de</strong> Interés Preferente. En esta carretera se localizan dos estaciones <strong>de</strong><br />
aforo, antes y <strong>de</strong>spués <strong>de</strong>l núcleo urbano <strong>de</strong> Lanestosa. El tráfico registrado en estas dos estaciones, a<strong>de</strong>más <strong>de</strong><br />
muy bajo, es muy simi<strong>la</strong>r, en torno a los 1.200 vehículos / día y a los 100 vehículos pesados / día.<br />
2,000<br />
1,500<br />
1,000<br />
500<br />
0<br />
INTENSIDAD DE TRÁFICO EN LA CARRETERA N-629: BURGOS – SANTOÑA (BIZKAIA)<br />
IMD 2003<br />
IMD<br />
Fuente: E<strong>la</strong>boración propia a partir <strong>de</strong> los datos <strong>de</strong> <strong>la</strong>s Diputaciones Forales.<br />
Los vehículos pesados se mantienen en porcentajes entre el 7 y el 8% en esta carretera.<br />
154<br />
Revisión <strong>de</strong>l Segundo P<strong>la</strong>n General <strong>de</strong> Carreteras <strong>de</strong>l País Vasco
10.00%<br />
9.00%<br />
8.00%<br />
7.00%<br />
6.00%<br />
5.00%<br />
4.00%<br />
3.00%<br />
<strong>2.</strong>00%<br />
1.00%<br />
INTENSIDAD DE PESADOS EN LA CARRETERA N-629: BURGOS – SANTOÑA (BIZKAIA)<br />
IM D 2003<br />
% P esados<br />
Fuente: E<strong>la</strong>boración propia a partir <strong>de</strong> los datos <strong>de</strong> <strong>la</strong>s Diputaciones Forales.<br />
Las carreteras N-639 y N-644 dan acceso al Puerto <strong>de</strong> Santurtzi en Bilbao. Como se observa en <strong>la</strong> gráfica <strong>de</strong>l año<br />
2002, año para el que se tienen datos <strong>de</strong> ambas carreteras, es mucho mayor el número <strong>de</strong> vehículos (totales y<br />
pesados) que acce<strong>de</strong>n al Puerto <strong>de</strong> Bilbao a través <strong>de</strong> <strong>la</strong> carretera N-644 (Autovía <strong>de</strong>l Puerto), pues mientras que<br />
en ésta se registran 15.310 vehículos / día, en <strong>la</strong> carretera N-639 <strong>la</strong> IMD media registrada por <strong>la</strong>s dos estaciones<br />
<strong>de</strong> aforo con <strong>la</strong>s que cuenta es <strong>de</strong> 3.600 vehículos / día. Respectivamente estos valores en el caso <strong>de</strong> <strong>la</strong> categoría<br />
<strong>de</strong> pesados son 4.500 vehículos pesados / día y 300 vehículos pesados / día.<br />
En porcentaje, <strong>la</strong> carretera N-644 cuenta con cerca <strong>de</strong>l 25% <strong>de</strong> vehículos pesados, mientras que <strong>la</strong> N-639 se<br />
mantiene por <strong>de</strong>bajo <strong>de</strong>l 10%.<br />
INTENSIDAD DE TRÁFICO EN LA CARRETERA N-639 Y N-644: ACCESO AL PUERTO DE ZIERBANA<br />
(BIZKAIA)<br />
16.000<br />
14.000<br />
1<strong>2.</strong>000<br />
10.000<br />
8.000<br />
6.000<br />
4.000<br />
<strong>2.</strong>000<br />
IMD 2002<br />
54 B (N-639) 54 C (N-639) 181 B (N-644)<br />
IMD 2002<br />
Fuente: E<strong>la</strong>boración propia a partir <strong>de</strong> los datos <strong>de</strong> <strong>la</strong>s Diputaciones Forales.<br />
PORCENTAJE DE PESADOS EN LA CARRETERA N-639 Y N-644: ACCESO AL PUERTO DE ZIERBANA<br />
(BIZKAIA)<br />
20,0%<br />
10,0%<br />
0,0%<br />
Pesados 2002<br />
54 B (N-639) 54 C (N-639) 181 B (N-644)<br />
Pesados 2002<br />
Fuente: E<strong>la</strong>boración propia a partir <strong>de</strong> los datos <strong>de</strong> <strong>la</strong>s Diputaciones Forales.<br />
155<br />
Revisión <strong>de</strong>l Segundo P<strong>la</strong>n General <strong>de</strong> Carreteras <strong>de</strong>l País Vasco
El acceso al Aeropuerto <strong>de</strong> Loiu, en Bilbao, se lleva a cabo mediante <strong>la</strong> carretera <strong>de</strong> Interés Preferente N-633. El<br />
tráfico <strong>de</strong> <strong>la</strong> estación localizada inmediatamente antes <strong>de</strong> entrar al Aeropuerto, registra un tráfico elevado <strong>de</strong> más<br />
<strong>de</strong> 37.000 vehículos / día y <strong>2.</strong>600 vehículos pesados / día en el año 2003.<br />
INTENSIDAD DE TRÁFICO EN LA CARRETERA N-633: ACCESO AL AEROPUERTO DE BILBAO<br />
(BIZKAIA)<br />
40,000<br />
35,000<br />
30,000<br />
25,000<br />
20,000<br />
15,000<br />
10,000<br />
5,000<br />
0<br />
BI-631 - Aeropuerto<br />
IM D 2003<br />
Fuente: E<strong>la</strong>boración propia a partir <strong>de</strong> los datos <strong>de</strong> <strong>la</strong>s Diputaciones Forales.<br />
En cuanto a los porcentajes <strong>de</strong> pesados, estos osci<strong>la</strong>n entre el 3 y el 7%.<br />
IM D<br />
PORCENTAJE DE PESADOS EN LA CARRETERA N-633: ACCESO AL AEROPUERTO DE BILBAO<br />
(BIZKAIA)<br />
8.00%<br />
7.00%<br />
6.00%<br />
5.00%<br />
4.00%<br />
3.00%<br />
<strong>2.</strong>00%<br />
1.00%<br />
0.00%<br />
BI-631 - Aeropuerto<br />
IM D 2003<br />
% P esados<br />
Fuente: E<strong>la</strong>boración propia a partir <strong>de</strong> los datos <strong>de</strong> <strong>la</strong>s Diputaciones Forales.<br />
La carretera N-638 da acceso al Aeropuerto <strong>de</strong> Hondarribia (Donostia-San Sebastián) en Gipuzkoa y, tal y como<br />
ocurría en el caso anterior, es <strong>la</strong> estación <strong>de</strong> aforo más próxima al Aeropuerto <strong>la</strong> que mayor IMD presenta (25.300<br />
vehículos / día en 2003).<br />
Los porcentajes <strong>de</strong> pesados en ambos puntos <strong>de</strong> aforo se mantienen en niveles semejantes <strong>de</strong>l 6 y el 7,5%.<br />
156<br />
Revisión <strong>de</strong>l Segundo P<strong>la</strong>n General <strong>de</strong> Carreteras <strong>de</strong>l País Vasco
INTENSIDAD DE TRÁFICO EN LA CARRETERA N-638: ACCESO AL AEROPUERTO DE HONDARRIBIA<br />
(GIPUZKOA)<br />
30,000<br />
25,000<br />
20,000<br />
15,000<br />
10,000<br />
5,000<br />
0<br />
Hondarribia<br />
IMD 2003<br />
IMD<br />
Entre Amute y Aeropuerto<br />
Fuente: E<strong>la</strong>boración propia a partir <strong>de</strong> los datos <strong>de</strong> <strong>la</strong>s Diputaciones Forales.<br />
PORCENTAJE DE PESADOS EN LA CARRETERA N-638: ACCESO AL AEROPUERTO DE HONDARRIBIA<br />
(GIPUZKOA)<br />
8.0<br />
7.0<br />
6.0<br />
5.0<br />
4.0<br />
3.0<br />
<strong>2.</strong>0<br />
1.0<br />
0.0<br />
Hondarribia<br />
IM D 2003<br />
% P esados<br />
Entre Amute y Aeropuerto<br />
Fuente: E<strong>la</strong>boración propia a partir <strong>de</strong> los datos <strong>de</strong> <strong>la</strong>s Diputaciones Forales.<br />
En <strong>la</strong> AP-1 (Burgos – Armiñón) y en <strong>la</strong> A-15 (Irurtzun – Aduna) únicamente existe una estación <strong>de</strong> aforo y, por<br />
tanto, no se pue<strong>de</strong> evaluar <strong>la</strong> variación <strong>de</strong> tráfico a lo <strong>la</strong>rgo <strong>de</strong> <strong>la</strong>s mismas.<br />
Para <strong>la</strong> autopista AP-1, en el año 2002 (último año <strong>de</strong>l que se disponen datos <strong>de</strong> esta estación <strong>de</strong> aforo) <strong>la</strong> IMD es<br />
superior a 16.000 vehículos / día, con 4.500 vehículos pesados / día. En el caso <strong>de</strong> <strong>la</strong> Autopista A-15, <strong>la</strong> IMD en el<br />
año 2003 supera los 13.000 vehículos / día y los 3.500 vehículos pesados / día.<br />
Finalmente, <strong>la</strong> carretera N-121-A no figura en el presente <strong>análisis</strong> por no existir estaciones <strong>de</strong> aforo en <strong>la</strong> misma.<br />
<strong>2.</strong><strong>2.</strong><strong>2.</strong><strong>2.</strong> Red Básica<br />
De igual modo que se ha <strong>de</strong>sarrol<strong>la</strong>do para <strong>la</strong> Red <strong>de</strong> Interés Preferente, se realiza el <strong>análisis</strong> <strong>de</strong> <strong>la</strong> intensidad <strong>de</strong><br />
tráfico para <strong>la</strong>s carreteras <strong>de</strong> <strong>la</strong> Red Básica que forman parte <strong>de</strong> <strong>la</strong> Red Funcional, en el período 1997 - 2003:<br />
157<br />
Revisión <strong>de</strong>l Segundo P<strong>la</strong>n General <strong>de</strong> Carreteras <strong>de</strong>l País Vasco
Estación Carretera Tipo P.K. Localidad más próxima<br />
IMD<br />
EVOLUCIÓN DEL TRÁFICO EN LOS CORREDORES REPRESENTATIVOS DE LA RED BÁSICA<br />
2003 2002 2001 2000 1999 1998 1997<br />
%<br />
Pesados<br />
CARRETERA A-132 (LUMBIER POR TAFALLA YE ESTELLA): ELORRIAGA – SATAN CRUZ DE KANPEZO. ÁLAVA<br />
IMD<br />
%<br />
Pesados<br />
IMD<br />
%<br />
Pesados<br />
IMD<br />
%<br />
Pesados<br />
IMD<br />
%<br />
Pesados<br />
IMD<br />
%<br />
Pesados<br />
IMD<br />
%<br />
Pesados<br />
158<br />
Variación (%) 1997<br />
- 2003<br />
IMD Pesados<br />
12 A-132 1 4,9 Ascarza 4.785 10,3 4.558 12,3 4.629 10,3 6.951 11,6 5.547 14,2 5.507 13,1 4.299 15,1 1,8 -4,6<br />
1200 A-132 3 8,7 Andollu 4.415 10,6 4.031 10,8 4.764 10,9 4.121 11,6 5.287 13,8 3.784 13,1 3.356 15,1 4,7 -1,3<br />
150 A-132 1 22,3 Azatzeta 3.477 10,4 3.387 10,8 3.328 10,9 <strong>2.</strong>814 11,6 3.226 13,7 3.219 13,1 3.540 15,1 -0,3 -6,3<br />
420 A-132 3 34,5 Antoñana <strong>2.</strong>493 11,3 <strong>2.</strong>654 10,8 <strong>2.</strong>884 10,9 1.750 11,5 <strong>2.</strong>856 14,2 <strong>2.</strong>740 13,1 <strong>2.</strong>121 15,1 2,7 -2,2<br />
430 A-132 2 41,5 Sta. Cruz (Límite Navarra) <strong>2.</strong>676 9,8 <strong>2.</strong>273 10,8 <strong>2.</strong>538 10,9 <strong>2.</strong>234 11,6 3.187 14,1 <strong>2.</strong>602 13,1 <strong>2.</strong>578 15,1 0,6 -6,4<br />
CARRETERA A-624 (DE ALTUBE A BALMASEDA): N-622 - LÍMITE CON BURGOS. ÁLAVA<br />
820 A-624 1 25,0 Altube 3.335 2,0 3.042 2,1 3.037 2,5 3.673 16,3 3.881 14,6 4.270 14,9 4.080 15,0 -3,3 -30,8<br />
821 A-624 0 30,9 Cruce <strong>de</strong> Urquillo 4.314 17,5 4.042 17,7 3.869 17,5 4.059 16,8 - - - - - - - -<br />
770 A-624 1 40,0 Larrimbe 3.140 16,8 <strong>2.</strong>789 17,6 <strong>2.</strong>570 16,6 <strong>2.</strong>449 17,0 3.146 14,1 <strong>2.</strong>235 15,3 <strong>2.</strong>615 11,0 3,1 10,6<br />
1062 A-624 3 42,9 Amurrio 3.731 6,2 <strong>2.</strong>762 5,9 <strong>2.</strong>741 6,4 <strong>2.</strong>706 6,1 3.472 6,9 3.426 9,1 <strong>2.</strong>587 6,0 6,3 7,0<br />
910 A-624 1 45,7 Respaldiza 3.166 6,1 3.065 5,9 <strong>2.</strong>953 6,4 <strong>2.</strong>812 6,2 <strong>2.</strong>793 6,9 <strong>2.</strong>581 9,1 <strong>2.</strong>504 7,2 4,0 1,1<br />
911 A-624 3 49,0 Menagaray <strong>2.</strong>264 6,3 <strong>2.</strong>072 5,9 <strong>2.</strong>818 6,4 1.889 6,1 1.486 7,1 784 9,2 1.715 5,8 4,7 6,0<br />
903 A-624 3 57,0 Artziniega (Balmaseda) 463 5,4 443 6,1 524 5,9 664 6,0 365 5,5 348 6,0 388 5,9 3,0 1,4<br />
CARRETERA A-124 (DE BRIÑAS A LOGROÑO POR LAGUARDIA): LÍMITE CON LA RIOJA (BRIÑAS) – LÍMITE CON LA RIOJA (EXCEPTO EL TRAMO DE SAN VICENTE DE SONSIERRA). ÁLAVA<br />
580 A-124 1 42,5 Labastida <strong>2.</strong>080 5,6 1.964 9,1 1.940 4,0 1.861 4,0 1.583 3,2 1.268 3,9 1.292 4,0 8,3 14,3<br />
520 A-124 1 52,8 Ábalos 1.899 7,8 <strong>2.</strong>059 8,6 1.877 7,6 1.675 7,1 1.802 7,3 1.367 6,9 1.238 5,5 7,4 13,8<br />
510 A-124 1 61,1 Páganos 3.633 7,9 <strong>2.</strong>508 6,6 <strong>2.</strong>431 6,9 <strong>2.</strong>534 8,9 <strong>2.</strong>355 5,6 <strong>2.</strong>147 6,2 <strong>2.</strong>151 5,3 9,1 16,9<br />
500 A-124 1 75,5 Laserna 3.677 7,7 3.461 7,3 3.432 7,2 3.420 6,8 3.232 6,9 3.138 6,6 <strong>2.</strong>983 5,2 3,5 10,4<br />
CARRETERA A-126: LÍMITE CON NAVARRA LÍMITE CON CONDADO DE TREVIÑO. ÁLAVA<br />
462 A-126 3 36,0 Navarrete 777 1,8 691 1,8 974 2,1 846 2,1 638 6,0 719 2,2 476 1,9 8,5 7,6<br />
440 A-126 3 39,0 Genevil<strong>la</strong> 871 10,8 848 10,8 603 10,9 1.057 11,5 734 13,5 738 13,0 539 15,2 8,3 2,3<br />
471 A-126 3 39,5 Bernedo (Límite Navarra) 561 4,1 446 4,0 393 4,1 433 3,9 342 4,4 721 4,0 265 4,2 13,3 13,1<br />
473 A-126 3 41,8 Angostina 275 4,0 219 4,0 172 4,1 282 3,9 191 4,2 181 3,9 138 4,3 12,2 10,6<br />
CARRETERA GI-131 (DE ANDOAIN A DONOSTIA-SAN SEBASTIÁN POR HERNANI): ANDOAIN (N-I) - DONOSTIA-SAN SEBASTIÁN (NUDO LOYOLA). GIPUZKOA<br />
68 GI-131 3 2,0 Andoain - A. Irurain 1<strong>2.</strong>966 15,0 13.193 - 1<strong>2.</strong>550 - 11.996 - 8.743 - 9.416 - 8.091 - 8,2 -<br />
120 GI-131 3 5,6 Urnieta 15.934 16,0 15.671 - 15.068 - 13.586 - 14.679 - 11.255 - 10.371 - 7,4 -<br />
259 GI-131 3 8,0 Variante <strong>de</strong> Hernani 9.952 18,5 9.425 - 9.279 - - - - - - - - - - -<br />
69 GI-131 2 9,0 Parada Bus Carabel 16.721 15,0 16.952 16,0 15.020 16,0 16.638 16,0 16.062 16,0 15.283 15,0 16.124 12 0,6 4,4<br />
35 GI-131 3 10,6 Astigar - C. Garziateg 16.048 12,0 15.454 - 15.074 - 15.574 - 14.855 - 18.789 - 13.634 - 2,8 -<br />
79 GI-131 3 10,7 Astigarraga 18.830 10,0 18.800 - 18.283 - 18.720 - 18.756 - 16.275 - 14.833 - 4,1 -<br />
81 GI-131 3 13,5 Donostia (Loio<strong>la</strong>) 16.870 11,0 17.574 - 18.524 - 19.168 - 21.947 - 14.362 - 19.044 - -2,0 -<br />
CARRETERA GI-631: ZUMAIA – ZUMARRAGA. GIPUZKOA<br />
Revisión <strong>de</strong>l Segundo P<strong>la</strong>n General <strong>de</strong> Carreteras <strong>de</strong>l País Vasco
Estación Carretera Tipo P.K. Localidad más próxima<br />
IMD<br />
2003 2002 2001 2000 1999 1998 1997<br />
%<br />
Pesados<br />
IMD<br />
%<br />
Pesados<br />
IMD<br />
%<br />
Pesados<br />
IMD<br />
%<br />
Pesados<br />
IMD<br />
%<br />
Pesados<br />
IMD<br />
%<br />
Pesados<br />
IMD<br />
%<br />
Pesados<br />
159<br />
Variación (%) 1997<br />
- 2003<br />
IMD Pesados<br />
9210 GI-631 3 0,2 Cruce <strong>de</strong> Arroa 7.913 16,0 7.433 - 8.261 - 7.033 - 7.147 - 6.781 - 5.368 - 6,7 -<br />
9157 GI-631 3 3,8 Cruce <strong>de</strong> <strong>la</strong> Variante <strong>de</strong> Iraeta 10.937 14,0 10.525 - 10.590 - 10.212 - 10.135 - 7.429 - 7.500 - 6,5 -<br />
58 GI-631 3 12,2 Azpeitia (Gasolinera) 11.802 14,0 11.746 - 11.534 - 11.575 - 11.126 - 9.285 - 7.999 - 6,7 -<br />
158 GI-631 2 15,9 Loyo<strong>la</strong> 15.365 11,0 16.438 12,0 14.945 12,0 15.894 12,0 14.620 11,0 13.642 12,0 14.111 13,0 1,4 -1,4<br />
125 GI-631 3 20,8 Azkoitia 3.967 17,0 3.835 - 3.575 - 3.805 - 3.603 - 4.430 - <strong>2.</strong>426 - 8,5 -<br />
59 GI-631 3 31,5 Cruce <strong>de</strong> Agiñeta 4.513 16,0 4.159 - 3.951 - <strong>2.</strong>736 - 3.539 - 3.422 - 3.375 - 5,0 -<br />
CARRETERA BI-604 (DE BILBAO A ASUA POR ENEKURI): VARIANTE BAJA DE DEUSTO – LACADENA (BI-2704). BIZKAIA<br />
14 A BI-604 3 - Deusto - Enekuri - - 25.896 5,0 29.123 5,0 29.208 5,0 33.294 5,0 3<strong>2.</strong>524 5,0 29.244 4,0 - -<br />
78 A BI-604 2 4,8 Enekuri - Deusto 33.156 5,0 25.896 5,0 29.123 5,0 29.208 5,0 33.294 5,0 3<strong>2.</strong>524 5,0 29.244 4,0 2,1 6,0<br />
78 C BI-604 2<br />
6,0<br />
Enekuri – Kuku<strong>la</strong>rra /<br />
Txoriherri 39.660 5,0<br />
31.598 5,0 30.785 5,0 30.476 5,0 34.740 5,0 33.824 5,0 31.606 4,0<br />
3,9 7,8<br />
79 A BI-604 2 - Asua – E. Kuku<strong>la</strong>rra 16.594 5,0 17.438 5,0 14.717 5,0 17.171 5,0 18.062 5,0 16.744 5,0 14.048 4,5 2,8 4,6<br />
CARRETERA BI-624 (DE ALTUBE A BALMASEDA): LÍMITE CON BURGOS – BALMASEDA (BI-636). BIZKAIA<br />
61 B BI-624 2 - La Pinil<strong>la</strong> - Artziniega - - 671 6,0 655 6,0 624 6,0 560 6,0 590 6,0 650 6,0 - -<br />
161 C BI-624 3 - Amurrio - Artziniega 3.400 6,5 3.335 6,5 3.039 6,5 3.097 6,5 3.093 6,5 <strong>2.</strong>802 6,5 <strong>2.</strong>762 6,5 3,5 3,5<br />
CARRETERA BI-630 (DE BALMASEDA A CARRANZA): BALMASEDA (BI-636) - LÍMITE CON CANTABRIA (EXCEPTO EL PASO POR EL ENCLAVE DE TRUCIOS). BIZKAIA<br />
62 A BI-630 3 - Balmaseda - Ma<strong>la</strong>brigo <strong>2.</strong>262 8,0 <strong>2.</strong>229 8,0 <strong>2.</strong>195 8,0 <strong>2.</strong>142 8,0 <strong>2.</strong>091 8,0 <strong>2.</strong>103 8,0 <strong>2.</strong>196 8,0 0,5 0,5<br />
62 C BI-630 3 - Ma<strong>la</strong>brigo - Herbosa <strong>2.</strong>278 9,0 <strong>2.</strong>202 9,0 <strong>2.</strong>278 9,0 <strong>2.</strong>166 9,0 1.957 9,0 1.758 9,0 1.770 9,0 4,3 4,3<br />
63 A BI-630 1 35,0 Herbosa - Artzentales 1.966 9,5 1.833 9,8 1.848 9,5 1.832 10,3 1.712 9,0 1.589 9,3 1.609 9,1 3,4 4,2<br />
64 A BI-630 3 - Artzentales - Turtzioz <strong>2.</strong>138 8,0 <strong>2.</strong>049 8,0 <strong>2.</strong>080 8,0 <strong>2.</strong>018 8,0 1.910 8,0 1.756 8,0 1.672 8,0 4,2 4,2<br />
65 A BI-630 3 - Turtzioz - Ambasaguas <strong>2.</strong>045 8,0 <strong>2.</strong>038 8,0 1.867 8,0 1.863 8,0 1.724 8,0 1.727 8,0 1.838 8,0 1,8 1,8<br />
65 B BI-630 2 - Ambasaguas - L.P. (Ramales) 1.524 7,0 1.482 7,0 1.293 7,0 1.281 7,0 1.275 7,0 1.300 7,0 1.310 7,0 2,6 2,6<br />
CARRETERA BI-631: BERMEO – DERIO. BIZKAIA<br />
104 A BI-631 3 - Sollube - Bermeo 4.609 5,0 4.471 5,0 4.087 5,0 3.802 5,0 3.578 5,0 3.482 5,0 3.455 5,0 4,9 4,9<br />
103 A BI-631 2 - Larrauri - Sollube 4.659 5,0 4.500 5,0 4.326 5,0 3.880 5,0 3.653 5,0 3.526 5,0 3.374 5,0 5,5 5,5<br />
102 A BI-631 3 - Larrauri – Int. BI-3101 6.957 5,0 6.821 5,0 6.270 5,0 5.947 5,0 5.629 5,0 5.501 6,0 5.241 6,0 4,8 1,7<br />
101 D BI-631 3 - Mungia - Larrauri 7.963 7,0 8.152 7,0 7.679 7,0 7.794 7,0 7.407 7,0 7.143 7,0 6.471 7,0 3,5 3,5<br />
101 G BI-631 0 17,4 Variante Mungia 26.929 5,9 24.379 5,6 21.473 5,9 - - - - - - - - - -<br />
98 A BI-631 1<br />
4,4<br />
Santo Domingo – N-633<br />
(Galbarriatu) 31.784 4,1<br />
31.978 3,6 29.604 3,7 23.499 3,3 21.379 3,0 21.456 5,5 20.151 6,0<br />
7,9 1,3<br />
97 A BI-631 2(1) 3,1 Orueta – Santo Domingo 39.109 4,2 37.131 4,2 38.657 4,5 27.473 4,0 25.100 3,5 25.369 5,2 23.847 6,0 8,6 2,3<br />
1 B BI-631 2 - Ibarsusi – Santo Domingo 20.589 4,0 19.934 4,0 20.336 5,0 17.773 5,0 - - - - - - - -<br />
6 A BI-631 1 - S. Sur (A-8) - Miraflores 36.745 2,3 34.256 4,5 34.267 2,5 33.848 3,0 26.440 4,5 26.149 5,0 24.422 5,9 7,0 -8,5<br />
CARRETERA BI-633 (DE DURANGO A ONDARROA POR TRABAKUA): MATIENA (N-634) - ONDARROA. BIZKAIA<br />
114 B BI-633 2 - Matiena – Bi<strong>de</strong>barrieta (Berriz) 11.166 8,5 10.920 8,5 - - 9.269 8,0 8.184 8,0 8.077 8,0 8.447 8,0 4,8 5,8<br />
Revisión <strong>de</strong>l Segundo P<strong>la</strong>n General <strong>de</strong> Carreteras <strong>de</strong>l País Vasco
Estación Carretera Tipo P.K. Localidad más próxima<br />
IMD<br />
2003 2002 2001 2000 1999 1998 1997<br />
%<br />
Pesados<br />
IMD<br />
%<br />
Pesados<br />
IMD<br />
%<br />
Pesados<br />
IMD<br />
%<br />
Pesados<br />
IMD<br />
%<br />
Pesados<br />
IMD<br />
%<br />
Pesados<br />
IMD<br />
%<br />
Pesados<br />
160<br />
Variación (%) 1997<br />
- 2003<br />
IMD Pesados<br />
143 A BI-633 3 - Ormaiztegi - Bi<strong>de</strong>barrieta 10.044 10,0 10.461 10,0 9.963 9,0 7.141 8,5 6.037 10,9 6.439 8,5 6.008 8,5 8,9 11,9<br />
143 C BI-633 0 35,1 Bi<strong>de</strong>barrieta - Gomezeaga 8.224 11,6 7.660 12,7 7.164 11,2 6.777 10,8 6.037 10,9 5.679 10,2 5.239 10,7 7,8 9,3<br />
144 A BI-633 2(1) - Gomezeaga – Pto. Trabakua 6.626 11,5 6.740 11,5 6.301 11,5 6.015 11,5 5.888 11,5 4.985 10,2 4.616 10,0 6,2 8,7<br />
145 A BI-633 2 - Arrangizgana - Iruzubieta 7.162 10,5 7.030 10,5 6.834 10,0 6.124 10,0 5.995 10,0 5.656 10,0 4.550 10,0 7,9 8,7<br />
145 C BI-633 3 - Iruzubieta – Vte. Markina 8.644 9,5 8.374 9,5 7.950 9,0 6.883 9,5 6.286 9,5 5.879 9,0 5.383 8,5 8,2 10,2<br />
147 B BI-633 3 - Iruzubieta – Vte. Markina 9.347 8,0 8.627 8,0 8.282 8,0 7.220 8,0 7.603 7,0 7.033 7,0 6.914 7,0 5,2 7,5<br />
147 C BI-633 2 - Vte. Markina 5.821 8,0 5.582 8,0 - - - - - - - - - - - -<br />
147 A BI-633 1 - Vte. Markina - Urberuaga 8.322 8,0 7.992 8,0 8.013 7,2 7.388 7,5 7.375 7,6 6.648 8,0 6.132 8,0 5,2 5,2<br />
148 A BI-633 3 - Urberuaga - P<strong>la</strong>zako<strong>la</strong> 7.933 9,0 6.796 9,0 6.856 9,0 6.494 9,0 6.128 9,0 5.667 9,0 5.640 9,0 5,9 5,9<br />
148 C BI-633 3 - P<strong>la</strong>zako<strong>la</strong> - Berriatua 6.427 8,5 6.269 8,5 5.994 8,0 5.708 8,0 5.857 8,0 5.905 8,0 5.819 8,0 -6,9 -11,2<br />
149 A BI-633 2 - Berriatua - Ondarroa 7.454 8,0 7.561 8,0 7.258 7,5 7.050 7,5 6.965 7,5 6.440 7,5 6.046 7,5 3,6 4,7<br />
CARRETERA BI-634: BERANGO - MUNGIA. BIZKAIA<br />
87 A BI-634 0 19,3 Berango - Larrabasterra 31.959 3,2 30.872 3,4 30.216 3,5 30.016 3,5 29.209 3,5 26.241 4,6 25.888 4,6 3,6 -2,5<br />
88 A BI-634 2 20,9 Larrabasterra - Sope<strong>la</strong>na 20.261 4,0 20.516 4,0 19.673 4,5 17.879 5,5 17.136 6,0 16.677 4,5 16.199 4,5 3,8 1,8<br />
88 B BI-634 3 - Sope<strong>la</strong>na - Urduliz 10.318 5,0 10.131 5,0 9.731 5,0 9.427 5,0 9.610 5,0 9.386 5,0 9.151 5,0 2,0 2,0<br />
94 B BI-634 3 - Urduliz - Elortza 7.528 5,0 7.522 5,0 7.682 5,0 7.435 4,0 7.353 4,0 7.247 4,0 6.823 4,0 1,7 5,5<br />
94 C BI-634 2 - Elortza - Butroe 5.448 5,0 5.271 5,0 5.103 5,0 4.857 4,0 4.626 4,0 4.398 4,0 4.165 4,0 4,6 8,5<br />
95 A BI-634 3 - Butroe - Gatika 4.390 5,0 4.110 5,0 3.595 5,0 3.483 5,0 3.327 5,0 3.133 5,0 3.443 4,5 4,1 6,0<br />
95 B BI-634 2 - Gatika - Mungia - - 7.641 6,0 7.384 6,0 7.292 6,0 7.058 6,0 6.828 6,0 6.472 6,0 - -<br />
101 B BI-634 2 - Mungia - Gatika 8.404 6,0 7.641 6,0 7.780 6,0 7.909 6,0 7.646 6,0 7.564 6,0 7.234 6,0 2,5 2,5<br />
CARRETERA BI-635: LEMOA - GERNIKA-LUMO. BIZKAIA<br />
126 A BI-635 0 34,6 Vista Alegre - Gernika 15.564 10,7 16.396 9,7 16.025 9,5 16.087 11,0 16.026 8,6 14.335 11,3 14.140 13,8 1,6 -2,6<br />
125 A BI-635 3 - Zugaztieta – Vista Alegre 13.301 10,0 13.078 10,0 13.025 10,0 13.231 10,0 1<strong>2.</strong>902 10,0 11.900 13,0 1<strong>2.</strong>244 12,0 1,4 -1,6<br />
124 A BI-635 3 - E. Amorebieta - Zugaztieta 13.294 10,0 1<strong>2.</strong>948 10,0 1<strong>2.</strong>674 10,0 1<strong>2.</strong>237 10,0 11.828 10,0 11.352 13,0 11.375 12,5 2,6 -1,1<br />
111 B BI-635 2 - Amorebieta - Zugaztieta 1<strong>2.</strong>771 10,0 13.090 10,0 1<strong>2.</strong>988 10,0 1<strong>2.</strong>626 10,0 1<strong>2.</strong>828 10,0 1<strong>2.</strong>946 11,0 13.556 11,0 -1,0 -2,6<br />
164 B BI-635 2 - Lemoa - Amorebieta 7.884 20,0 7.776 20,0 7.557 20,0 7.416 22,0 7.402 22,0 7.284 22,0 7.150 22,0 1,6 0,0<br />
CARRETERA BI-636 (DE BILBAO A REINOSA): BILBAO (A-8) – LÍMITE CON BURGOS (CORREDOR KADAGUA). BIZKAIA<br />
21 B BI-636 1 4,2 E. A-8 - Kastrexana 27.406 8,9 25.743 7,6 20.079 7,9 23.270 7,0 2<strong>2.</strong>344 7,3 19.671 8,1 15.286 9,2 10,2 9,6<br />
55 C BI-636 2 -<br />
Solución Sur (A-8) -<br />
Kastrexana 2<strong>2.</strong>061 9,5<br />
20.331 9,0 20.189 9,0 19.124 8,5 17.453 8,5 16.656 9,0 15.896 9,0<br />
5,6 6,6<br />
55 A BI-636 1 7,2 Kastrexana - Alonsotegi 23.575 10,7 2<strong>2.</strong>371 9,7 21.188 9,5 20.776 9,4 19.175 9,5 18.977 10,5 18.035 10,0 4,6 5,8<br />
56 A BI-636 3 - Alonsotegi - Zaramillo 19.048 5,5 18.726 5,5 18.299 5,5 17.562 5,5 16.102 6,0 15.231 6,0 14.650 6,0 4,5 3,0<br />
56 B BI-636 3 - Zaramillo - La Cuadra 18.466 5,0 17.927 5,0 17.490 5,0 16.326 5,0 15.483 5,5 14.983 5,0 14.411 5,0 4,2 4,2<br />
57 A BI-636 0 - La Cuadra - Sodupe 18.247 4,2 17.715 3,7 17.283 3,7 16.148 4,1 15.335 5,1 14.904 4,9 14.185 4,9 4,3 1,6<br />
57 C BI-636 1 13,8 Sodupe - Artxube 9.721 7,9 9.473 6,1 - - - - - - - - - - - -<br />
Revisión <strong>de</strong>l Segundo P<strong>la</strong>n General <strong>de</strong> Carreteras <strong>de</strong>l País Vasco
Estación Carretera Tipo P.K. Localidad más próxima<br />
IMD<br />
2003 2002 2001 2000 1999 1998 1997<br />
%<br />
Pesados<br />
IMD<br />
%<br />
Pesados<br />
IMD<br />
%<br />
Pesados<br />
IMD<br />
%<br />
Pesados<br />
IMD<br />
%<br />
Pesados<br />
IMD<br />
%<br />
Pesados<br />
IMD<br />
%<br />
Pesados<br />
161<br />
Variación (%) 1997<br />
- 2003<br />
IMD Pesados<br />
59 A BI-636 3 - Artxube - L<strong>la</strong>ntada 1<strong>2.</strong>549 8,0 1<strong>2.</strong>297 7,0 10.936 5,0 10.135 5,0 9.789 5,0 9.208 6,0 8.207 6,0 7,3 12,6<br />
60 A BI-636 2 - L<strong>la</strong>ntada - Balmaseda N. 8.597 7,5 8.290 7,5 7.789 6,0 7.585 6,0 7.636 6,0 7.369 6,0 7.147 6,0 3,1 7,0<br />
61 A BI-636 3 - Balmaseda - La Pinil<strong>la</strong> 4.990 8,0 4.972 8,0 4.942 8,0 4.786 8,0 4.815 8,0 - - 4.171 7,0 3,0 5,3<br />
61 C BI-636 2 - La Pinil<strong>la</strong> - Vil<strong>la</strong>sana 6.863 7,0 6.691 7,0 5.863 7,0 5.804 7,0 5.780 7,0 5.701 7,0 5.353 7,0 4,2 4,2<br />
CARRETERA BI-637: ERANDIO – SOPELANA. BIZKAIA<br />
46 A BI-637 2 - E. Kuku<strong>la</strong>rra – R. Erandio 99.308 5,8 96.769 6,0 96.947 6,0 95.381 5,0 94.251 5,2 91.090 9,4 87.917 7,2 2,1 -1,6<br />
81 A BI-637 0 9,3 E. Erandio - Santimami 106.314 5,8 103.269 5,9 101.665 6,4 99.760 6,1 98.259 5,9 9<strong>2.</strong>854 6,1 88.185 6,0 3,2 2,6<br />
83 A BI-637 2(1) 11,1 Santimami - Leioa 96.147 5,5 9<strong>2.</strong>921 5,5 91.498 6,0 7<strong>2.</strong>198 3,5 70.114 3,5 58.851 6,5 54.479 6,0 9,9 8,3<br />
84 A BI-637 2 - Leioa - Artaza 79.447 5,0 76.687 5,2 75.290 5,5 7<strong>2.</strong>899 5,5 70.657 5,5 68.189 6,0 6<strong>2.</strong>244 6,0 4,2 1,0<br />
84 C BI-637 1 - Gobe<strong>la</strong> - Bolue - - - - - - - - 6.666 6,3 6.532 6,5 5.881 5,9 - -<br />
84 D BI-637 1 13,9 Artaza - Bolue 70.829 3,8 67.414 3,8 66.643 4,1 63.754 3,5 61.808 4,4 50.139 4,8 46.397 4,9 7,3 2,9<br />
86 B BI-637 1 16,5 Bolue – Kurtxes (Berango) 35.175 5,5 3<strong>2.</strong>884 6,0 31.744 5,8 29.724 4,0 27.761 3,5 - - - - - -<br />
CARRETERA A-623 (VITORIA-GASTEIZ – DURANGO): LEGUATIANO - LÍMITE CON BIZKAIA EN GOMILAZ. ÁLAVA<br />
310 A-623 1 18,3 Límite Otxandio 4.787 5,9 4.278 6,1 4.452 4,9 4.255 5,9 4.158 5,8 4.216 6,02 3.648 6,0 4,6 4,2<br />
CARRETERA BI-623 (VITORIA-GASTEIZ – DURANGO): LÍMITE CON ÁLAVA EN GOMILAZ – DURANGO (N-634). BIZKAIA<br />
171 A BI-623 3 - Durango - Izurtza - - 9.008 15,0 8.581 15,0 8.595 16,0 7.592 10,0 7.412 10,0 7.438 10,0 - -<br />
172 A BI-623 1 31,1 Izurtza - Mañaria 8.543 17,1 8.706 15,1 8.277 16,5 7.689 18,9 7.866 12,0 7.659 13,0 7.181 12,5 2,9 8,5<br />
172 B BI-623 3 - Mañaria - Urkio<strong>la</strong> 4.283 10,0 4.534 10,0 4.396 10,0 4.201 10,0 3.829 10,0 3.538 10,0 3.337 10,0 4,2 4,2<br />
173 A BI-623 3 - Urkio<strong>la</strong> - Otxandio 3.676 10,0 3.715 10,0 3.716 10,0 3.550 10,0 3.238 10,0 3.095 10,0 <strong>2.</strong>917 10,0 3,9 3,9<br />
173 B BI-623 2 - Otxandio - L.P. (Á<strong>la</strong>va) 3.755 10,0 3.836 10,0 3.862 10,0 3.626 10,0 4.118 10,0 3.718 10,0 3.646 10,0 0,5 0,5<br />
CARRETERA A-627 (DE VITORIA-GASTEIZ Z EIBAR): N-240 – LÍMITE CON GIPUZKOA. ÁLAVA<br />
1050 A-627 1 17,7 Landa 9.316 13,1 8.580 13,1 8.987 10,9 8.619 13,3 8.355 14,2 8.154 12,66 7.660 14,3 3,3 1,8<br />
1051 A-627 1 13,1 Urbina 8.916 15,4 8.834 17,2 8.106 17,9 8.542 18,3 8.753 17,5 8.265 21,2 - - - -<br />
CARRETERA GI-627 (DE VITORIA-GASTEIZ A EIBAR): LÍMITE CON ÁLAVA - EIBAR (MALTZAGA). GIPUZKOA<br />
9211 GI-627 3 52,3<br />
Antes entrada variante a<br />
Soraluze / P<strong>la</strong>cencia <strong>de</strong> Armas 1<strong>2.</strong>659 17,0<br />
1<strong>2.</strong>563 - 13.315 - 10.527 - 1<strong>2.</strong>038 - 1<strong>2.</strong>029 - 9.277 -<br />
5,3 -<br />
9113 GI-627 3 49,2 Meko<strong>la</strong>l<strong>de</strong> 13.373 17,0 13.144 - 14.004 - 11.388 - 13.290 - 13.477 - 10.064 - 4,9 -<br />
127 GI-627 3 40,4 San Pru<strong>de</strong>ntzio 16.454 17,0 18.081 - 16.456 - 17.737 - 19.436 - 15.613 - 13.205 - 3,7 -<br />
89 GI-627 1 39,4 Cruce <strong>de</strong> San Pru<strong>de</strong>ntzio 20.380 17,0 20.727 17,0 18.858 18,0 17.808 16,0 18.178 18,0 15.540 17,0 16.563 14,4 3,5 6,4<br />
112 GI-627 3 33,2 Fagor (Mondragón) 9.126 17,0 9.649 - 9.909 - 9.345 - 8.235 - 6.613 - 5.902 - 7,5 -<br />
52 GI-627 0 22,3 Puerto <strong>de</strong> Ar<strong>la</strong>bán 1.983 75,0 <strong>2.</strong>058 75,0 <strong>2.</strong>010 74,0 <strong>2.</strong>063 69,0 <strong>2.</strong>001 73,0 3.371 - <strong>2.</strong>545 - -4,1 -<br />
51 GI-627 3 19,0 Alto <strong>de</strong> Ar<strong>la</strong>bán 8.476 17,5 8.763 - 8.815 - 9.108 - 9.453 - 6.736 - 6.696 - 4,0 -<br />
13 GI-627 3 0,0 Altos Hornos <strong>de</strong> Bergara <strong>2.</strong>716 14,0 3.142 - 3.536 - 3.272 - <strong>2.</strong>465 - - - - - - -<br />
CARRETERA A-625 (DE ORDUÑA A BILBAO): LÍMITE CON ÁLAVA – LÍMITE CON BIZKAIA (VARIANTE AMURRIO). ÁLAVA<br />
1070 A-625 1 371,0 Llodio (Bilbao) 14.487 28,8 1<strong>2.</strong>772 19,2 11.469 19,9 11.408 29,1 11.079 22,6 9.841 30,8 9.598 24,0 7,1 10,4<br />
Revisión <strong>de</strong>l Segundo P<strong>la</strong>n General <strong>de</strong> Carreteras <strong>de</strong>l País Vasco
Estación Carretera Tipo P.K. Localidad más próxima<br />
IMD<br />
2003 2002 2001 2000 1999 1998 1997<br />
%<br />
Pesados<br />
IMD<br />
%<br />
Pesados<br />
IMD<br />
%<br />
Pesados<br />
IMD<br />
%<br />
Pesados<br />
IMD<br />
%<br />
Pesados<br />
IMD<br />
%<br />
Pesados<br />
IMD<br />
%<br />
Pesados<br />
162<br />
Variación (%) 1997<br />
- 2003<br />
IMD Pesados<br />
1071 A-625 1 369,0 Llodio (Amurrio) 11.222 8,1 11.773 10,2 9.822 19,9 8.725 29,1 7.679 22,6 4.721 30,8 4.886 24,0 14,9 -4,1<br />
160 A(2) A-625 1 - Laudio - Luxaondo 13527 12,0 1<strong>2.</strong>538 12,0 1<strong>2.</strong>113 12,0 11.603 12,5 11.203 12,5 10.429 12,5 9.804 12,5 5,5 4,8<br />
1060 A-625 2 360,2 Amurrio (Llodio) 11.236 9,2 11.395 19,2 1<strong>2.</strong>188 19,9 10.357 29,1 9.540 23,8 8.770 30,8 8.118 24,0 5,6 -10,0<br />
161 A(2) A-625 2 - Luxaondo – Amurrio 10.251 12,0 10.132 12,0 9.562 12,0 8.815 12,0 8.544 12,0 8.430 12,0 7.946 11,8 4,3 4,6<br />
1064 A-625 1 360,0 Circunva<strong>la</strong>ción <strong>de</strong> Amurrio 5.169 12,0 5.637 15,8 - - - - - - - - - - - -<br />
161 B(2) A-625 3 - Amurrio – Vitoria-Gasteiz 4761 11,0 4.115 11,0 3.482 11,0 3.562 11,0 3.619 11,0 3.430 11,0 <strong>2.</strong>980 11,0 8,1 8,1<br />
1063 A-625 3 358,2 Amurrio 4.749 12,4 3.766 19,2 3.637 19,9 <strong>2.</strong>824 29,1 <strong>2.</strong>289 22,7 1.708 30,9 1.968 32,4 15,8 -1,3<br />
1061 A-625 3 356,0 Saratxo 4.798 12,2 3.613 19,2 3.956 19,9 4.054 29,1 3.893 22,2 4.291 30,9 4.539 32,5 0,9 -14,3<br />
CARRETERA BI-625 (DE ORDUÑA A BILBAO): LÍMITE CON ÁLAVA – CRUCE CON N-634. BIZKAIA<br />
154 A BI-625 1 384,9<br />
E. Basauri - Moyordín<br />
(Arrigorriaga)<br />
29.829 16,0 25.861 16,0 25.702 16,5 25.491 18,0 24.961 19,3 23.953 17,5 23.052 14,0 4,4 6,7<br />
155 A BI-625 1 383,6 Moyordín - E. Arrigorriaga 2<strong>2.</strong>557 16,4 19.105 17,5 19.230 17,0 18.892 18,4 19.788 18,4 18.674 16,0 16.237 15,5 5,6 6,6<br />
156 A BI-625 3 - BI-712 - Ugao (Miraballes) 20.512 11,5 17.822 11,5 17.354 11,8 16.388 13,5 17.550 13,5 17.027 13,0 15.428 13,0 4,9 2,7<br />
157 A BI-625 0 380,6<br />
157 C BI-625 3 -<br />
Arrigorriaga - Miraballes<br />
(Ugao)<br />
Miraballes (Ugao) -<br />
Arrankudiaga<br />
18.561 11,5 17.019 11,6 16.636 10,9 15.948 13,5 17.180 13,5 16.667 12,3 15.103 11,9 3,5 2,9<br />
1<strong>2.</strong>470 15,5 1<strong>2.</strong>078 15,5 11.812 15,0 11.763 16,0 1<strong>2.</strong>530 16,0 1<strong>2.</strong>141 15,5 10.866 13,0 2,3 5,4<br />
158 A BI-625 1 - Arrankudiaga - E. Areta Norte 11.383 17,5 10.956 17,5 10.680 16,0 10.792 16,0 11.716 16,0 11.491 16,0 9.762 12,5 2,6 8,5<br />
158 B BI-625 3 - E. Areta Norte - Areta 13.462 15,5 1<strong>2.</strong>617 15,5 1<strong>2.</strong>053 15,0 1<strong>2.</strong>252 15,0 1<strong>2.</strong>780 15,0 1<strong>2.</strong>653 14,50 11.714 11,0 2,3 8,4<br />
162 A BI-625 2 - Amurrio - Orduña 4.414 9,0 4.329 9,0 4.155 9,0 4.076 9,0 4.124 9,0 4.060 9,5 3.594 9,5 3,5 2,5<br />
CARRETERA GI-638 (DE DEBA A ONDARROA): DEBA (N-634) – LÍMITE CON BIZKAIA. GIPUZKOA<br />
91 GI-638 3 1,3 Deba 5.225 11,0 4.976 - 4.577 - 4.949 - 5.029 - 5.768 - 3.944 - 4,8 -<br />
49 GI-638 3 3,5 Entrada Mutriku 5.372 10,5 5.218 - 5.415 - 5.187 - 4.864 - 7.319 - 4.556 - 2,8 -<br />
50 GI-638 3 7,2 Saturrarán 6.705 9,5 6.452 - 6.057 - 6.633 - 6.693 - 7.738 - 4.750 - 5,9 -<br />
CARRETERA BI-638 (DE DEBA A ONDARROA): LÍMITE CON GIPUZKOA - ONDARROA. BIZKAIA<br />
149 C BI-638 2 - Ondarroa – L.P. (Deba) - - 6.601 8,0 6.533 8,0 6.407 8,0 6.476 8,0 6.146 8,0 5.668 8,0 - -<br />
(1): Estación primaria en el año 2000 y anteriores.<br />
(2): Estaciones <strong>de</strong> aforo obtenidas en <strong>la</strong> Diputación foral <strong>de</strong> Bizkaia, pero que correspon<strong>de</strong>n a <strong>la</strong> carretera A-625 <strong>de</strong> Á<strong>la</strong>va.<br />
Fuente: E<strong>la</strong>boración propia a partir <strong>de</strong> los datos <strong>de</strong> <strong>la</strong>s Diputaciones Forales <strong>de</strong> Á<strong>la</strong>va, Gipuzkoa y Bizkaia.<br />
Revisión <strong>de</strong>l Segundo P<strong>la</strong>n General <strong>de</strong> Carreteras <strong>de</strong>l País Vasco
Al igual que en <strong>la</strong> Red <strong>de</strong> Interés Preferente se ha llevado a cabo un cálculo <strong>de</strong> <strong>la</strong> IMD pon<strong>de</strong>rada <strong>de</strong> <strong>la</strong>s<br />
carreteras <strong>de</strong> <strong>la</strong> Red Básica. El resultado se presenta en el siguiente gráfico, que se or<strong>de</strong>na <strong>de</strong> mayor a menor<br />
IMD:<br />
80.000<br />
70.000<br />
60.000<br />
50.000<br />
40.000<br />
30.000<br />
20.000<br />
10.000<br />
0<br />
IMD PONDERADA EN LA RED BÁSICA<br />
IMD 2003<br />
IMD 2003<br />
Fuente: E<strong>la</strong>boración propia a partir <strong>de</strong> los datos <strong>de</strong> <strong>la</strong>s Diputaciones Forales.<br />
Muy por encima <strong>de</strong> todas <strong>la</strong>s <strong>de</strong>más <strong>de</strong>staca <strong>la</strong> BI-637, carretera que se localiza en el Bilbao Metropolitano y que<br />
hace el recorrido entre Erandio y Sope<strong>la</strong>na. La IMD pon<strong>de</strong>rada <strong>de</strong> esta carretera supera los 70.000 vehículos día,<br />
contando con tramos en que se superan los 100.000 vehículos.<br />
Bastante por <strong>de</strong>bajo <strong>de</strong> el<strong>la</strong>, pero también muy <strong>de</strong>stacable, se encuentra <strong>la</strong> BI-604, carretera también <strong>de</strong>l Bilbao<br />
Metropolitano, <strong>de</strong> acceso a los núcleos <strong>de</strong> Deusto y Erandio, que comunica con <strong>la</strong> anterior, y que cuenta con una<br />
IMD pon<strong>de</strong>rada por encima <strong>de</strong> los 30.000 vehículos diarios.<br />
Ninguna <strong>de</strong> <strong>la</strong>s carreteras restantes supera los 20.000 vehículos. Por encima <strong>de</strong> los 10.000 vehículos se<br />
encuentran varias carreteras <strong>de</strong> <strong>la</strong> <strong>red</strong> <strong>de</strong>l Territorio Histórico <strong>de</strong> Bizkaia, como <strong>la</strong> BI-625, <strong>la</strong> BI-631, <strong>la</strong> BI-636, <strong>la</strong><br />
BI-635 y <strong>la</strong> BI-634, <strong>la</strong> mayor parte <strong>de</strong> el<strong>la</strong>s localizadas también en el Bilbao Metropolitano, así como dos<br />
guipuzcoanas, <strong>la</strong> GI-131 (Andoain a Donostia – San Sebastián por Hernani) y <strong>la</strong> GI-627 (Vitoria – Eibar), y tan sólo<br />
una a<strong>la</strong>vesa, <strong>la</strong> A-625 (Orduña – Bilbao). Las <strong>de</strong>más se encuentran por <strong>de</strong>bajo <strong>de</strong> los 10.000 vehículos.<br />
En <strong>la</strong> parte inferior, por <strong>de</strong>bajo <strong>de</strong> 5.000 vehículos se sitúan <strong>la</strong> A-623 (Vitoria-Gasteiz – Durango), BI-624 y A-624<br />
(Altube – Balmaseda), A-132 (Elorriaga – Santa Cruz <strong>de</strong> Kanpezo), A-124 (Briñas – Logroño por Laguardia), BI-<br />
630 (Balmaseda – Carranza) y A-126 (Límite con Navarra – Límite con Condado <strong>de</strong> Treviño), que es <strong>la</strong> que tiene<br />
menor IMD, con tan sólo 556 vehículos / día.<br />
Por su parte, en el gráfico siguiente se representan <strong>la</strong>s carreteras <strong>de</strong> <strong>la</strong> Red Básica según su porcentaje medio <strong>de</strong><br />
vehículos pesados. Este porcentaje medio <strong>de</strong> pesados se obtiene, para cada carretera, como el cociente <strong>de</strong> <strong>la</strong> IMD<br />
pon<strong>de</strong>rada <strong>de</strong> vehículos pesados y <strong>la</strong> IMD pon<strong>de</strong>rada <strong>de</strong>l total <strong>de</strong> vehículos.<br />
20,00%<br />
18,00%<br />
16,00%<br />
14,00%<br />
12,00%<br />
10,00%<br />
8,00%<br />
6,00%<br />
4,00%<br />
2,00%<br />
0,00%<br />
GI-627<br />
BI-623<br />
BI-625<br />
A-627<br />
PORCENTAJE DE PESADOS EN LA RED BÁSICA<br />
GI-631<br />
GI-131<br />
A-625<br />
BI-635<br />
A-132<br />
IMD 2003<br />
BI-633<br />
A-624<br />
BI-630<br />
IMD 2003<br />
Fuente: E<strong>la</strong>boración propia a partir <strong>de</strong> los datos <strong>de</strong> <strong>la</strong>s Diputaciones Forales.<br />
La carretera con mayor porcentaje <strong>de</strong> vehículos pesados es <strong>la</strong> GI-627 (Vitoria – Eibar), que supera el 19% en<br />
media, con un valor medio pon<strong>de</strong>rado <strong>de</strong> <strong>2.</strong>239 vehículos. Por encima <strong>de</strong>l 10% se sitúan también <strong>la</strong> BI-623, BI-<br />
625, A-627, GI-631, GI-131, A-625, BI-635 y A-13<strong>2.</strong> El resto se sitúa entre el 4 y el 10%.<br />
En general, el porcentaje <strong>de</strong> pesados en <strong>la</strong>s carreteras <strong>de</strong> <strong>la</strong> Red Básica no cuenta con gran<strong>de</strong>s osci<strong>la</strong>ciones, ya<br />
que, con excepción <strong>de</strong> <strong>la</strong> GI-627, todas <strong>la</strong>s <strong>de</strong>más se sitúan en un rango entre el 4% y el 15%. En términos<br />
absolutos, sólo <strong>la</strong> BI-637 supera los 3.000 vehículos pesados, en el entorno <strong>de</strong> Bilbao Metropolitano. El resto<br />
tienen IMD <strong>de</strong> vehículos pesados inferiores a los <strong>2.</strong>500.<br />
BI-638<br />
A-124<br />
BI-636<br />
BI-624<br />
A-623<br />
A-126<br />
163<br />
Revisión <strong>de</strong>l Segundo P<strong>la</strong>n General <strong>de</strong> Carreteras <strong>de</strong>l País Vasco<br />
BI-637<br />
BI-604<br />
BI-631<br />
BI-634
Se presenta a continuación un gráfico don<strong>de</strong> figura <strong>la</strong> tasa <strong>de</strong> crecimiento medio acumu<strong>la</strong>tivo anual (%) en el<br />
período <strong>de</strong> <strong>análisis</strong> (1997 – 2003) para <strong>la</strong>s carreteras <strong>de</strong> <strong>la</strong> Red Básica. El dato <strong>de</strong> <strong>la</strong> BI-638 correspon<strong>de</strong> al<br />
período 1997 – 2002, por carecer <strong>de</strong> datos <strong>de</strong> 2003.<br />
12,0<br />
10,0<br />
8,0<br />
6,0<br />
4,0<br />
2,0<br />
0,0<br />
-2,0<br />
-4,0<br />
-6,0<br />
A-126<br />
VARIACIÓN DE LA INTENSIDAD DE TRÁFICO (%) EN LA RED BÁSICA<br />
BI-631<br />
A-625<br />
A-124<br />
BI-637<br />
BI-633<br />
GI-631<br />
PERÍODO 1997 – 2003<br />
A-623<br />
BI-634<br />
GI-627<br />
IMD<br />
GI-638<br />
BI-636<br />
IMD<br />
Fuente: E<strong>la</strong>boración propia a partir <strong>de</strong> los datos <strong>de</strong> <strong>la</strong>s Diputaciones Forales.<br />
En <strong>la</strong> Red Básica, <strong>la</strong>s tasas <strong>de</strong> crecimiento medio acumu<strong>la</strong>tivo anual en el período consi<strong>de</strong>rado (1997 – 2003) son<br />
menores que <strong>la</strong>s registradas en <strong>la</strong> Red <strong>de</strong> Interés Preferente. Son <strong>la</strong>s carreteras A-126 (entre Navarra y el<br />
Condado <strong>de</strong> Treviño, al sureste <strong>de</strong>l Territorio Histórico <strong>de</strong> Á<strong>la</strong>va) y <strong>la</strong> BI-631 (Bermeo – Derio, en Bilbao<br />
Metropolitano), <strong>la</strong>s que mayor crecimiento <strong>de</strong> tráfico han experimentado en los últimos años, siendo en ambos<br />
casos <strong>la</strong> tasa superior al 9%. La mayoría <strong>de</strong> <strong>la</strong>s carreteras han registrado crecimientos mo<strong>de</strong>rados, entre el 2 y el<br />
6% anual.<br />
La única carretera don<strong>de</strong> se producen variaciones tráfico negativas es en <strong>la</strong> BI-623 (<strong>de</strong> Vitoria-Gasteiz a Durango),<br />
don<strong>de</strong> el <strong>de</strong>crecimiento en el periodo <strong>de</strong> <strong>análisis</strong> es <strong>de</strong> –3,8%.<br />
BI-624<br />
BI-630<br />
BI-604<br />
A-624<br />
A-627<br />
BI-625<br />
GI-131<br />
A-132<br />
BI-635<br />
BI-623<br />
8,0<br />
6,0<br />
4,0<br />
2,0<br />
0,0<br />
-2,0<br />
-4,0<br />
-6,0<br />
-8,0<br />
VARIACIÓN DE LA INTENSIDAD DE TRÁFICO DE PESADOS (%) EN LA RED BÁSICA<br />
BI-604<br />
BI-633<br />
BI-625<br />
BI-636<br />
BI-631<br />
A-126<br />
A-623<br />
PERÍODO 1997 – 2003<br />
BI-634<br />
A-624<br />
Pesados<br />
BI-624<br />
BI-630<br />
BI-637<br />
Pesados<br />
Fuente: E<strong>la</strong>boración propia a partir <strong>de</strong> los datos <strong>de</strong> <strong>la</strong>s Diputaciones Forales.<br />
Si se consi<strong>de</strong>ra <strong>la</strong> variación <strong>de</strong>l tráfico <strong>de</strong> pesados, en aquel<strong>la</strong>s carreteras <strong>de</strong> <strong>la</strong>s que se dispone <strong>de</strong> datos, es <strong>la</strong> BI-<br />
604 (<strong>de</strong> Bilbao a Asua por Enekuri, en Bilbao Metropolitano) y <strong>la</strong> BI-633 (<strong>de</strong> Durango a Ondarroa por Trabakua)<br />
<strong>la</strong>s que mayor crecimiento han experimentado en los últimos seis años (6,9%).<br />
Por el contrario, <strong>la</strong>s carreteras que han experimentado una variación negativa <strong>de</strong> tráfico <strong>de</strong> pesados son <strong>la</strong> GI-631<br />
(<strong>de</strong> Zumaia a Zumarraga), <strong>la</strong> BI-635 (<strong>de</strong> Lemoa a Gernika-Lumo), <strong>la</strong> A-132 (Lumbier por Tafal<strong>la</strong> y Estel<strong>la</strong>), <strong>la</strong> BI-<br />
623 (<strong>de</strong> Vitoria-Gasteiz a Durango), <strong>la</strong> A-625 (<strong>de</strong> Orduña a Bilbao) y <strong>la</strong> A-124 (<strong>de</strong> Briñas a Logroño por Laguardia).<br />
En el gráfico anterior no se ha representado <strong>la</strong> carretera GI-638 (<strong>de</strong> Deba a Ondarroa, en el Territorio Histórico <strong>de</strong><br />
Gipuzkoa).<br />
En general, <strong>la</strong> variación en los volúmenes <strong>de</strong> pesados presenta también crecimientos mo<strong>de</strong>rados, situándose<br />
también <strong>la</strong> mayoría <strong>de</strong> <strong>la</strong>s carreteras <strong>de</strong> <strong>la</strong> Red Básica entre el 2 y el 6% anual.<br />
En los siguientes gráficos, se presenta el valor <strong>de</strong> <strong>la</strong> IMD en 2003 a <strong>la</strong>rgo <strong>de</strong> <strong>la</strong>s carreteras <strong>de</strong> <strong>la</strong> Red Básica<br />
pertenecientes a <strong>la</strong> Red Funcional, <strong>de</strong> <strong>la</strong>s que existen datos.<br />
La carretera <strong>de</strong> <strong>la</strong> Red Básica A-132 (Á<strong>la</strong>va) permite <strong>la</strong> conexión entre Vitoria-Gasteiz y <strong>la</strong> provincia <strong>de</strong> Navarra a<br />
<strong>la</strong> altura <strong>de</strong> Santa Cruz <strong>de</strong> Kanpezo. El tráfico en esta carretera presenta un <strong>de</strong>crecimiento uniforme <strong>de</strong> vehículos<br />
A-627<br />
GI-131<br />
GI-627<br />
GI-631<br />
BI-635<br />
164<br />
Revisión <strong>de</strong>l Segundo P<strong>la</strong>n General <strong>de</strong> Carreteras <strong>de</strong>l País Vasco<br />
A-132<br />
BI-623<br />
A-625<br />
A-124
ligeros y vehículos pesados <strong>de</strong>s<strong>de</strong> <strong>la</strong> estación <strong>de</strong> aforo más próxima a <strong>la</strong> capital a<strong>la</strong>vesa, en Ascarza, don<strong>de</strong> se<br />
registran 4.785 vehículos, hasta <strong>la</strong> estación más próxima a <strong>la</strong> provincia <strong>de</strong> Navarra, en Santa Cruz <strong>de</strong> Kanpezo,<br />
con <strong>2.</strong>676 vehículos.<br />
INTENSIDAD DE TRÁFICO EN LA CARRETERA A-132: LUMBIER POR TAFALLA Y ESTELLA (ÁLAVA)<br />
6,000<br />
5,000<br />
4,000<br />
3,000<br />
2,000<br />
1,000<br />
0<br />
Ascarza<br />
Andollu<br />
IM D 2003<br />
Fuente: E<strong>la</strong>boración propia a partir <strong>de</strong> los datos <strong>de</strong> <strong>la</strong>s Diputaciones Forales.<br />
Los porcentajes <strong>de</strong> pesados se mantienen constantes y alre<strong>de</strong>dor <strong>de</strong>l 10 y el 11%, lo que indica un<br />
comportamiento simi<strong>la</strong>r <strong>de</strong> este tipo <strong>de</strong> vehículos que el <strong>de</strong> <strong>la</strong> IMD global.<br />
IM D<br />
PORCENTAJE DE PESADOS EN LA CARRETERA A-132: LUMBIER POR TAFALLA Y ESTELLA (ÁLAVA)<br />
11.50%<br />
11.00%<br />
10.50%<br />
10.00%<br />
9.50%<br />
9.00%<br />
Ascarza<br />
Andollu<br />
IM D 2003<br />
% P esados<br />
Fuente: E<strong>la</strong>boración propia a partir <strong>de</strong> los datos <strong>de</strong> <strong>la</strong>s Diputaciones Forales.<br />
La carretera A-624 en el Territorio Histórico <strong>de</strong> Á<strong>la</strong>va, une Altube con Balmaseda. Presenta una punta <strong>de</strong> tráfico,<br />
con más <strong>de</strong> 4.000 vehículos / día y más <strong>de</strong> 700 vehículos pesados / día, en el cruce <strong>de</strong> Urquillo; <strong>de</strong>s<strong>de</strong> este punto,<br />
el tráfico <strong>de</strong>crece al acercarse a <strong>la</strong> localidad <strong>de</strong> Balmaseda y, por tanto, a <strong>la</strong> provincia <strong>de</strong> Burgos, don<strong>de</strong> tan sólo<br />
se registran en <strong>la</strong> última estación <strong>de</strong> aforo <strong>de</strong> <strong>la</strong> carretera, 443 vehículos / día y 23 vehículos pesados / día.<br />
165<br />
Revisión <strong>de</strong>l Segundo P<strong>la</strong>n General <strong>de</strong> Carreteras <strong>de</strong>l País Vasco
4,500<br />
4,000<br />
3,500<br />
3,000<br />
2,500<br />
2,000<br />
1,500<br />
1,000<br />
500<br />
0<br />
INTENSIDAD DE TRÁFICO EN LA CARRETERA A-624: ALTUBE – BALMASEDA (ÁLAVA)<br />
Altube<br />
Cruce <strong>de</strong> Urquillo<br />
Larrimbe<br />
IM D 2003<br />
Amurrio<br />
IM D<br />
Respaldiza<br />
Menagaray<br />
Fuente: E<strong>la</strong>boración propia a partir <strong>de</strong> los datos <strong>de</strong> <strong>la</strong>s Diputaciones Forales.<br />
Artziniega (Balmaseda)<br />
En cuanto al porcentaje <strong>de</strong> pesados alcanza valores cercanos al 20% también en cruce <strong>de</strong> Urquillo y Larrimbe,<br />
<strong>de</strong>scendiendo al entorno <strong>de</strong>l 6% a partir <strong>de</strong> este punto. En volúmenes, en ningún tramo se superan en <strong>la</strong> A-624<br />
los 800 vehículos pesados diarios.<br />
PORCENTAJE DE PESADOS EN LA CARRETERA A-624: ALTUBE – BALMASEDA (ÁLAVA)<br />
20.0<br />
18.0<br />
16.0<br />
14.0<br />
1<strong>2.</strong>0<br />
10.0<br />
8.0<br />
6.0<br />
4.0<br />
<strong>2.</strong>0<br />
0.0<br />
Altube<br />
Cruce <strong>de</strong> Urquillo<br />
Larrimbe<br />
IMD 2003<br />
Amurrio<br />
% Pesados<br />
Respaldiza<br />
Menagaray<br />
Fuente: E<strong>la</strong>boración propia a partir <strong>de</strong> los datos <strong>de</strong> <strong>la</strong>s Diputaciones Forales.<br />
Artziniega (Balmaseda)<br />
La carretera a<strong>la</strong>vesa A-124 (Briñas – Logroño), es <strong>la</strong> carretera <strong>de</strong> <strong>la</strong> Red Básica localizada más al sur <strong>de</strong> <strong>la</strong><br />
Comunidad Autónoma <strong>de</strong>l País Vasco y presenta un tráfico con crecimiento uniforme <strong>de</strong>s<strong>de</strong> Labastida (<strong>2.</strong>000<br />
vehículos / día y 115 vehículos pesados / día) hasta Laserna (3.600 vehículos / día y 280 vehículos pesados / día).<br />
166<br />
Revisión <strong>de</strong>l Segundo P<strong>la</strong>n General <strong>de</strong> Carreteras <strong>de</strong>l País Vasco
INTENSIDAD DE TRÁFICO EN LA CARRETERA A-124: DE BRIÑAS A LOGROÑO POR LAGUARDIA<br />
(ÁLAVA)<br />
5,000<br />
4,000<br />
3,000<br />
2,000<br />
1,000<br />
0<br />
Labastida<br />
IMD 2003<br />
IMD<br />
Fuente: E<strong>la</strong>boración propia a partir <strong>de</strong> los datos <strong>de</strong> <strong>la</strong>s Diputaciones Forales.<br />
En cuanto al tráfico <strong>de</strong> pesados este se mantiene en porcentajes constantes en toda <strong>la</strong> carretera, entre el 5 y el<br />
8%, lo que refleja un perfil semejante al <strong>de</strong> <strong>la</strong> IMD total. En ningún punto <strong>de</strong> <strong>la</strong> carretera se superan los 300<br />
vehículos pesados al día.<br />
Laserna<br />
INTENSIDAD DE PESADOS EN LA CARRETERA A-124: DE BRIÑAS A LOGROÑO POR LAGUARDIA<br />
(ÁLAVA)<br />
9.00%<br />
8.00%<br />
7.00%<br />
6.00%<br />
5.00%<br />
4.00%<br />
3.00%<br />
<strong>2.</strong>00%<br />
1.00%<br />
0.00%<br />
Labastida<br />
IMD 2003<br />
% P esado s<br />
Fuente: E<strong>la</strong>boración propia a partir <strong>de</strong> los datos <strong>de</strong> <strong>la</strong>s Diputaciones Forales.<br />
La carretera A-126 (<strong>de</strong>s<strong>de</strong> el límite con Navarra al límite con el Condado <strong>de</strong> Treviño), tiene valores <strong>de</strong> IMD<br />
re<strong>la</strong>tivamente bajos, siendo en Genevil<strong>la</strong> don<strong>de</strong> alcanza su máximo valor con 871 vehículos / día y 94 vehículos<br />
pesados / día. La IMD pon<strong>de</strong>rada <strong>de</strong> esta carretera es <strong>la</strong> más baja <strong>de</strong> <strong>la</strong> Red Básica, con tan sólo 556 vehículos /<br />
día.<br />
Laserna<br />
167<br />
Revisión <strong>de</strong>l Segundo P<strong>la</strong>n General <strong>de</strong> Carreteras <strong>de</strong>l País Vasco
INTENSIDAD DE TRÁFICO EN LA CARRETERA A-126: DE LÍMITE CON NAVARRA A LÍMITE CON<br />
CONDADO DE TREVIÑO (ÁLAVA)<br />
1,000<br />
900<br />
800<br />
700<br />
600<br />
500<br />
400<br />
300<br />
200<br />
100<br />
0<br />
Navarrete<br />
IMD 2003<br />
Genevil<strong>la</strong><br />
Fuente: E<strong>la</strong>boración propia a partir <strong>de</strong> los datos <strong>de</strong> <strong>la</strong>s Diputaciones Forales.<br />
IMD<br />
Angostina<br />
En cuanto al volumen <strong>de</strong> pesados, el máximo porcentaje se alcanza en Genevil<strong>la</strong>, don<strong>de</strong> se supera el 10%,<br />
estando el resto <strong>de</strong> <strong>la</strong> carretera por <strong>de</strong>bajo <strong>de</strong>l 5%. En ningún punto se superan los 100 vehículos pesados al día<br />
en esta carretera.<br />
PORCENTAJE DE PESADOS EN LA CARRETERA A-126: DE LÍMITE CON NAVARRA A LÍMITE CON<br />
CONDADO DE TREVIÑO (ÁLAVA)<br />
1<strong>2.</strong>0<br />
10.0<br />
8.0<br />
6.0<br />
4.0<br />
<strong>2.</strong>0<br />
0.0<br />
Navarrete<br />
IM D 2003<br />
Genevil<strong>la</strong><br />
% P esados<br />
Fuente: E<strong>la</strong>boración propia a partir <strong>de</strong> los datos <strong>de</strong> <strong>la</strong>s Diputaciones Forales.<br />
Angostina<br />
De <strong>la</strong>s carreteras <strong>de</strong> <strong>la</strong> Red Básica, es <strong>la</strong> GI-131 <strong>la</strong> sita más al este <strong>de</strong> todo el País Vasco y comunica Andoain con<br />
Donostia-San Sebastián. Es una <strong>de</strong> <strong>la</strong>s carreteras que cuenta con mayores volúmenes <strong>de</strong> tráfico <strong>de</strong> <strong>la</strong> Red Básica,<br />
manteniéndose por encima <strong>de</strong> los 15.000 vehículos en prácticamente todo su recorrido, con excepción <strong>de</strong> <strong>la</strong><br />
variante <strong>de</strong> Hernani y el tramo inicial entre Andoain y Urnieta, en que se rondan los 10.000.<br />
168<br />
Revisión <strong>de</strong>l Segundo P<strong>la</strong>n General <strong>de</strong> Carreteras <strong>de</strong>l País Vasco
INTENSIDAD DE TRÁFICO EN LA CARRETERA GI-131: DE ANDOAIN A DONOSTIA-SAN SEBASTIÁN<br />
POR HERNANI (GIPUZKOA)<br />
20,000<br />
15,000<br />
10,000<br />
5,000<br />
0<br />
Andoain - A. Irurain<br />
Urnieta<br />
Variante <strong>de</strong> Hernani<br />
IM D 2003<br />
Parada Bus Carabel<br />
Astigar - C. Garziateg<br />
IM D<br />
Astigarraga<br />
Fuente: E<strong>la</strong>boración propia a partir <strong>de</strong> los datos <strong>de</strong> <strong>la</strong>s Diputaciones Forales.<br />
Donostia (Loio<strong>la</strong>)<br />
Los vehículos pesados se sitúan en porcentajes entre el 10 y el 18% en toda <strong>la</strong> carretera, alcanzando su máximo<br />
en <strong>la</strong> variante <strong>de</strong> Hernani, punto don<strong>de</strong> baja <strong>la</strong> intensidad total <strong>de</strong> <strong>la</strong> carretera. Estos porcentajes reve<strong>la</strong>n un<br />
comportamiento más homogéneo <strong>de</strong> los pesados, que se mantienen a lo <strong>la</strong>rgo <strong>de</strong> toda <strong>la</strong> vía en el entorno <strong>de</strong> los<br />
<strong>2.</strong>000 vehículos día.<br />
PORCENTAJE DE PESADOS EN LA CARRETERA GI-131: DE ANDOAIN A DONOSTIA-SAN SEBASTIÁN<br />
POR HERNANI (GIPUZKOA)<br />
20.0<br />
18.0<br />
16.0<br />
14.0<br />
1<strong>2.</strong>0<br />
10.0<br />
8.0<br />
6.0<br />
4.0<br />
<strong>2.</strong>0<br />
0.0<br />
Andoain - A. Irurain<br />
Urnieta<br />
Variante <strong>de</strong> Hernani<br />
IM D 2003<br />
Parada Bus Carabel<br />
Astigar - C. Garziateg<br />
% P esados<br />
Astigarraga<br />
Fuente: E<strong>la</strong>boración propia a partir <strong>de</strong> los datos <strong>de</strong> <strong>la</strong>s Diputaciones Forales.<br />
Donostia (Loio<strong>la</strong>)<br />
La carretera GI-631 une <strong>la</strong>s localida<strong>de</strong>s <strong>de</strong> Zumaia y Zumarraga, sirviendo también <strong>de</strong> comunicación con los<br />
núcleos <strong>de</strong> Azkoitia, Azpeitia y Zestoa, ejerciendo <strong>de</strong> vía <strong>de</strong> distribución fundamental en una <strong>de</strong> <strong>la</strong>s áreas <strong>de</strong><br />
mayor peso pob<strong>la</strong>cional <strong>de</strong>l Territorio Histórico <strong>de</strong> Gipuzkoa. Consecuentemente con ello <strong>la</strong> IMD pon<strong>de</strong>rada es<br />
re<strong>la</strong>tivamente importante, alcanzando prácticamente los 8.000 vehículos diarios.<br />
Los mayores volúmenes <strong>de</strong> IMD se registran entre Azkoitia y Azpeitia, a <strong>la</strong> altura <strong>de</strong>l Santuario <strong>de</strong> Loyo<strong>la</strong>, con más<br />
<strong>de</strong> 15.000 vehículos diarios, <strong>de</strong>scendiendo significativamente hacia el sur, entre Azpeitia y Zumarraga.<br />
169<br />
Revisión <strong>de</strong>l Segundo P<strong>la</strong>n General <strong>de</strong> Carreteras <strong>de</strong>l País Vasco
INTENSIDAD DE TRÁFICO EN LA CARRETERA GI-631: ZUMAIA – ZUMARRAGA (GIPUZKOA)<br />
16,000<br />
14,000<br />
12,000<br />
10,000<br />
8,000<br />
6,000<br />
4,000<br />
2,000<br />
0<br />
Crece <strong>de</strong> <strong>la</strong> Variante<br />
Azpeitia (Gasolinera)<br />
IM D 2003<br />
Loyo<strong>la</strong><br />
IM D<br />
Azkoitia<br />
Fuente: E<strong>la</strong>boración propia a partir <strong>de</strong> los datos <strong>de</strong> <strong>la</strong>s Diputaciones Forales.<br />
Los porcentajes <strong>de</strong> pesados se mantienen entre el 11 y el 17%, alcanzando su máximo en Azkoitia, punto don<strong>de</strong><br />
se registra <strong>la</strong> menor IMD, y su mínimo en Loyo<strong>la</strong>, al contrario <strong>de</strong> lo que ocurre con <strong>la</strong> IMD global. En términos<br />
absolutos, los pesados se mantienen <strong>de</strong>l or<strong>de</strong>n 1.700 vehículos entre Zumaia y Azkoitia, <strong>de</strong>scendiendo por <strong>de</strong>bajo<br />
<strong>de</strong> los 1.000 entre este punto y Zumarraga.<br />
PORCENTAJE DE PESADOS EN LA CARRETERA GI-631: ZUMAIA – ZUMARRAGA (GIPUZKOA)<br />
18.0<br />
16.0<br />
14.0<br />
1<strong>2.</strong>0<br />
10.0<br />
8.0<br />
6.0<br />
4.0<br />
<strong>2.</strong>0<br />
0.0<br />
Crece <strong>de</strong> <strong>la</strong> Variante<br />
Azpeitia (Gasolinera)<br />
IM D 2003<br />
Loyo<strong>la</strong><br />
% P esados<br />
Azkoitia<br />
Fuente: E<strong>la</strong>boración propia a partir <strong>de</strong> los datos <strong>de</strong> <strong>la</strong>s Diputaciones Forales.<br />
El tráfico en <strong>la</strong> carretera BI-604 (Bilbao – Asua) en el Bilbao Metropolitano, presenta un comportamiento simi<strong>la</strong>r<br />
para <strong>la</strong> IMD total y para los vehículos pesados. Es <strong>la</strong> carretera que cuenta con el tercer mayor volumen <strong>de</strong> IM<br />
pon<strong>de</strong>rada <strong>de</strong> <strong>la</strong> Red Básica, superando los 30.000 vehículos diarios. Permite el acceso <strong>de</strong>s<strong>de</strong> Bilbao hacia los<br />
núcleos <strong>de</strong> Deusto y Erandio y <strong>la</strong> margen izquierda <strong>de</strong> <strong>la</strong> Ría.<br />
Los mayores volúmenes <strong>de</strong> tráfico se producen en <strong>la</strong>s inmediaciones <strong>de</strong>l núcleo <strong>de</strong> Deusto, don<strong>de</strong> se registran casi<br />
40.000 vehículos, <strong>de</strong>scendiendo hasta los 17.000 en Sondika.<br />
170<br />
Revisión <strong>de</strong>l Segundo P<strong>la</strong>n General <strong>de</strong> Carreteras <strong>de</strong>l País Vasco
INTENSIDAD DE TRÁFICO EN LA CARRETERA BI-604: DE BILBAO A ASUA POR ENEKURI (BIZKAIA)<br />
45,000<br />
40,000<br />
35,000<br />
30,000<br />
25,000<br />
20,000<br />
15,000<br />
10,000<br />
5,000<br />
0<br />
Enekuri - Deusto<br />
IMD 2003<br />
Fuente: E<strong>la</strong>boración propia a partir <strong>de</strong> los datos <strong>de</strong> <strong>la</strong>s Diputaciones Forales.<br />
Los pesados se mantienen en un porcentaje constante <strong>de</strong>l 5% en toda <strong>la</strong> carretera, según los datos disponibles, lo<br />
que indica un perfil semejante al <strong>de</strong>l total <strong>de</strong> <strong>la</strong> IMD. En volúmenes, se mantienen en el entorno <strong>de</strong> los <strong>2.</strong>000<br />
vehículos diarios en <strong>la</strong>s inmediaciones <strong>de</strong> Deusto, <strong>de</strong>scendiendo a partir <strong>de</strong> aquí hasta situarse por <strong>de</strong>bajo <strong>de</strong> los<br />
1.000.<br />
IM D<br />
INTENSIDAD DE PESADOS EN LA CARRETERA BI-604: DE BILBAO A ASUA POR ENEKURI (BIZKAIA)<br />
10%<br />
9%<br />
8%<br />
7%<br />
6%<br />
5%<br />
4%<br />
3%<br />
2%<br />
1%<br />
Enekuri - Deusto<br />
IMD 2003<br />
% Pesados<br />
Fuente: E<strong>la</strong>boración propia a partir <strong>de</strong> los datos <strong>de</strong> <strong>la</strong>s Diputaciones Forales.<br />
Tan sólo existe un dato <strong>de</strong> IMD para <strong>la</strong> carretera BI-624 en el año 2003. En este año, el volumen <strong>de</strong> tráfico se<br />
sitúa en los 3.400 vehículos, que se registran en el tramo entre Amurrio y Artziniega.<br />
171<br />
Revisión <strong>de</strong>l Segundo P<strong>la</strong>n General <strong>de</strong> Carreteras <strong>de</strong>l País Vasco
INTENSIDAD DE TRÁFICO EN LA CARRETERA BI-624: DE ALTUBE A BALMASEDA (BIZKAIA)<br />
4,000<br />
3,000<br />
2,000<br />
1,000<br />
0<br />
IMD 2003<br />
Amurrio - Artziniega<br />
IMD<br />
Fuente: E<strong>la</strong>boración propia a partir <strong>de</strong> los datos <strong>de</strong> <strong>la</strong>s Diputaciones Forales.<br />
Los pesados alcanzan un porcentaje mo<strong>de</strong>rado <strong>de</strong>l 6,5% <strong>de</strong>l total <strong>de</strong> IMD, con un volumen <strong>de</strong> 220 vehículos<br />
diarios.<br />
INTENSIDAD DE PESADOS EN LA CARRETERA BI-624: DE ALTUBE A BALMASEDA (BIZKAIA)<br />
7.0<br />
6.0<br />
5.0<br />
4.0<br />
3.0<br />
<strong>2.</strong>0<br />
1.0<br />
0.0<br />
IMD 2003<br />
Amurrio - Artziniega<br />
% Pesados<br />
Fuente: E<strong>la</strong>boración propia a partir <strong>de</strong> los datos <strong>de</strong> <strong>la</strong>s Diputaciones Forales.<br />
De Balmaseda al límite <strong>de</strong> <strong>la</strong> provincia con Cantabria el tráfico <strong>de</strong> <strong>la</strong> carretera BI-630 es uniforme, con un valor <strong>de</strong><br />
<strong>la</strong> IMD media en torno a los <strong>2.</strong>000 vehículos / día y un valor <strong>de</strong> IMD <strong>de</strong> pesados en torno a los 180 vehículos<br />
pesados / día, con porcentajes constantes alre<strong>de</strong>dor <strong>de</strong>l 9%.<br />
172<br />
Revisión <strong>de</strong>l Segundo P<strong>la</strong>n General <strong>de</strong> Carreteras <strong>de</strong>l País Vasco
INTENSIDAD DE TRÁFICO EN LA CARRETERA BI-630: BALMASEDA – CARRANZA (BIZKAIA)<br />
2,500<br />
2,000<br />
1,500<br />
1,000<br />
500<br />
0<br />
Balmaseda - Ma<strong>la</strong>brigo<br />
Ma<strong>la</strong>brigo - Herbosa<br />
Herbosa - Artzentales<br />
IM D 2003<br />
Artzentales - Turtzioz<br />
IM D<br />
Turtzioz - Ambasaguas<br />
Fuente: E<strong>la</strong>boración propia a partir <strong>de</strong> los datos <strong>de</strong> <strong>la</strong>s Diputaciones Forales.<br />
Ambasaguas - L.P. (Ramales)<br />
INTENSIDAD DE PESADOS EN LA CARRETERA BI-630: BALMASEDA – CARRANZA (BIZKAIA)<br />
10.0<br />
9.0<br />
8.0<br />
7.0<br />
6.0<br />
5.0<br />
4.0<br />
3.0<br />
<strong>2.</strong>0<br />
1.0<br />
0.0<br />
Balmaseda - Ma<strong>la</strong>brigo<br />
Ma<strong>la</strong>brigo - Herbosa<br />
Herbosa - Artzentales<br />
IM D 2003<br />
Artzentales - Turtzioz<br />
% P esados<br />
Turtzioz - Ambasaguas<br />
Fuente: E<strong>la</strong>boración propia a partir <strong>de</strong> los datos <strong>de</strong> <strong>la</strong>s Diputaciones Forales.<br />
Ambasaguas - L.P. (Ramales)<br />
La BI-631 hace el recorrido entre Derio y Bermeo. Cuenta con una IMD pon<strong>de</strong>rada <strong>de</strong> algo más <strong>de</strong> 14.000<br />
vehículos diarios. La mayor intensidad <strong>de</strong> tráfico se produce entre Derio y Mungia, don<strong>de</strong> se superan los 30.000<br />
vehículos en varios puntos <strong>de</strong> <strong>la</strong> carretera, fundamentalmente entre Orueta y Santo Domingo, don<strong>de</strong><br />
prácticamente se alcanzan los 40.000. A partir <strong>de</strong> Mungia y hasta Bermeo, <strong>la</strong> IMD <strong>de</strong>scien<strong>de</strong> notablemente,<br />
situándose entre los 5.000 y los 7.000 vehículos diarios.<br />
173<br />
Revisión <strong>de</strong>l Segundo P<strong>la</strong>n General <strong>de</strong> Carreteras <strong>de</strong>l País Vasco
40.000<br />
35.000<br />
30.000<br />
25.000<br />
20.000<br />
15.000<br />
10.000<br />
5.000<br />
0<br />
INTENSIDAD DE TRÁFICO EN LA CARRETERA BI-631: BERMEO – DERIO (BIZKAIA)<br />
IMD 2003<br />
Fuente: E<strong>la</strong>boración propia a partir <strong>de</strong> los datos <strong>de</strong> <strong>la</strong>s Diputaciones Forales.<br />
Los porcentajes <strong>de</strong> pesados no presentan gran<strong>de</strong>s variaciones situándose entre el 4 y el 7% en el conjunto <strong>de</strong> <strong>la</strong><br />
vía. En términos absolutos los volúmenes <strong>de</strong> pesados presentan un comportamiento simi<strong>la</strong>r al <strong>de</strong> <strong>la</strong> IMD total, con<br />
unos 1.500 vehículos entre Derio y Mungia, que <strong>de</strong>scien<strong>de</strong>n c<strong>la</strong>ramente por <strong>de</strong>bajo <strong>de</strong> los 1.000 entre esta última<br />
localidad y Bermeo.<br />
IMD<br />
8,00%<br />
7,00%<br />
6,00%<br />
5,00%<br />
4,00%<br />
3,00%<br />
2,00%<br />
1,00%<br />
0,00%<br />
INTENSIDAD DE PESADOS EN LA CARRETERA BI-631: BERMEO – DERIO (BIZKAIA)<br />
IMD 2003<br />
% Pesado s<br />
Fuente: E<strong>la</strong>boración propia a partir <strong>de</strong> los datos <strong>de</strong> <strong>la</strong>s Diputaciones Forales.<br />
La carretera BI-633 hace el recorrido entre Durango y Ondarroa, presentando un tráfico bastante homogéneo a lo<br />
<strong>la</strong>rgo <strong>de</strong> su trazado, situándose entre los 7.000 y los 11.000 vehículos en <strong>la</strong> mayor parte <strong>de</strong> su longitud. La mayor<br />
IMD <strong>de</strong> <strong>la</strong> misma, tiene lugar en <strong>la</strong> localidad <strong>de</strong> Matiena con en torno a 11.000 vehículos / día. A partir <strong>de</strong> este<br />
núcleo y hasta Iruzubieta, el tráfico disminuye hasta alcanzar <strong>la</strong> IMD un valor <strong>de</strong> 7.000 vehículos / día. El menor<br />
tráfico registrado por <strong>la</strong>s estaciones <strong>de</strong> aforo <strong>de</strong> <strong>la</strong> carretera BI-633 es el que tiene lugar en <strong>la</strong> variante <strong>de</strong><br />
Markina, don<strong>de</strong> tan sólo se registran 5.800 vehículos / día. Des<strong>de</strong> aquí y hasta Ondarroa, el tráfico vuelve a<br />
recuperarse y se sitúa <strong>de</strong> nuevo en el entorno <strong>de</strong> los 7.000 vehículos.<br />
174<br />
Revisión <strong>de</strong>l Segundo P<strong>la</strong>n General <strong>de</strong> Carreteras <strong>de</strong>l País Vasco
INTENSIDAD DE TRÁFICO EN LA CARRETERA BI-633: DE DURANGO A ONDARROA POR TRABAKUA<br />
(BIZKAIA)<br />
12,000<br />
10,000<br />
8,000<br />
6,000<br />
4,000<br />
2,000<br />
0<br />
Ormaiztegi - Bi<strong>de</strong>barrieta<br />
Bi<strong>de</strong>barrieta - Gomezeaga<br />
Arrangizgana - Iruzubieta<br />
IM D 2003<br />
IM D<br />
Vte. Markina<br />
Vte. Markina - Urberuaga<br />
Urberuaga - P<strong>la</strong>zako<strong>la</strong><br />
Fuente: E<strong>la</strong>boración propia a partir <strong>de</strong> los datos <strong>de</strong> <strong>la</strong>s Diputaciones Forales.<br />
P<strong>la</strong>zako<strong>la</strong> - Berriatua<br />
Berriatua - Ondarroa<br />
El comportamiento <strong>de</strong>l tráfico pesado es bastante homogéneo en porcentaje, variando entre el 8 y el 12% en toda<br />
<strong>la</strong> carretera, lo que refleja un comportamiento simi<strong>la</strong>r al <strong>de</strong>l tráfico total. En este caso <strong>la</strong>s osci<strong>la</strong>ciones se producen<br />
entre los 1.000 vehículos pesados / día que se registran en el entorno <strong>de</strong> Matiena y Ormaiztegi, y los 500 <strong>de</strong> <strong>la</strong><br />
variante <strong>de</strong> Markina.<br />
INTENSIDAD DE PESADOS EN LA CARRETERA BI-633: DE DURANGO A ONDARROA POR TRABAKUA<br />
(BIZKAIA)<br />
14.0<br />
1<strong>2.</strong>0<br />
10.0<br />
8.0<br />
6.0<br />
4.0<br />
<strong>2.</strong>0<br />
0.0<br />
Ormaiztegi - Bi<strong>de</strong>barrieta<br />
Bi<strong>de</strong>barrieta - Gomezeaga<br />
Arrangizgana - Iruzubieta<br />
IM D 2003<br />
% P esados<br />
Vte. Markina<br />
Vte. Markina - Urberuaga<br />
Urberuaga - P<strong>la</strong>zako<strong>la</strong><br />
Fuente: E<strong>la</strong>boración propia a partir <strong>de</strong> los datos <strong>de</strong> <strong>la</strong>s Diputaciones Forales.<br />
P<strong>la</strong>zako<strong>la</strong> - Berriatua<br />
Berriatua - Ondarroa<br />
La carretera <strong>de</strong> <strong>la</strong> Red Funcional BI-634 hace el recorrido entre Berango y Mungia, en el área <strong>de</strong> influencia <strong>de</strong>l<br />
Bilbao Metropolitano. A lo <strong>la</strong>rgo <strong>de</strong> su trazado el tráfico <strong>de</strong>crece <strong>de</strong>s<strong>de</strong> Berango, don<strong>de</strong> se registran más <strong>de</strong> 30.000<br />
vehículos / día y más 1.000 vehículos pesados / día hasta Mungia, don<strong>de</strong> <strong>la</strong> IMD registra valores en torno a 8.000<br />
vehículos / día y <strong>de</strong> 500 vehículos pesados /día. En el tramo intermedio, entre Mungia y Elortza el tráfico es<br />
incluso menor, <strong>de</strong>scendiendo hasta los 4.000 vehículos.<br />
175<br />
Revisión <strong>de</strong>l Segundo P<strong>la</strong>n General <strong>de</strong> Carreteras <strong>de</strong>l País Vasco
INTENSIDAD DE TRÁFICO EN LA CARRETERA BI-634: BERANGO – MUNGIA (BIZKAIA)<br />
35,000<br />
30,000<br />
25,000<br />
20,000<br />
15,000<br />
10,000<br />
5,000<br />
0<br />
Berango - Larrabasterra<br />
Larrabasteda - Sope<strong>la</strong>na<br />
Sope<strong>la</strong>na - Urduliz<br />
IM D 2003<br />
Urduliz - Elortza<br />
Elortza - Butroe<br />
IM D<br />
Butroe - Gatika<br />
Gatika - Mungia<br />
Fuente: E<strong>la</strong>boración propia a partir <strong>de</strong> los datos <strong>de</strong> <strong>la</strong>s Diputaciones Forales.<br />
Mungia - Gatika<br />
Los porcentajes <strong>de</strong> pesados no registran gran<strong>de</strong>s variaciones, situándose en toda <strong>la</strong> carretera entre el 3 y el 6%.<br />
En valores absolutos se aprecia un comportamiento simi<strong>la</strong>r al <strong>de</strong> <strong>la</strong> IMD global, con volúmenes que osci<strong>la</strong>n entre<br />
los 1.000 vehículos aforados a <strong>la</strong> altura <strong>de</strong> Berango y los 200 en el tramo intermedio entre Mungia y Elortza.<br />
INTENSIDAD DE PESADOS EN LA CARRETERA BI-634: BERANGO – MUNGIA (BIZKAIA)<br />
7.0<br />
6.0<br />
5.0<br />
4.0<br />
3.0<br />
<strong>2.</strong>0<br />
1.0<br />
0.0<br />
Berango - Larrabasterra<br />
Larrabasteda - Sope<strong>la</strong>na<br />
Sope<strong>la</strong>na - Urduliz<br />
IM D 2003<br />
Urduliz - Elortza<br />
Elortza - Butroe<br />
% P esados<br />
Butroe - Gatika<br />
Gatika - Mungia<br />
Fuente: E<strong>la</strong>boración propia a partir <strong>de</strong> los datos <strong>de</strong> <strong>la</strong>s Diputaciones Forales.<br />
Mungia - Gatika<br />
La carretera BI-635 (Gernika-Lumo – Lemoa) presenta un tráfico homogéneo entre Amorebieta y Gernika, <strong>de</strong><br />
alre<strong>de</strong>dor <strong>de</strong> 1<strong>2.</strong>000 a 15.000 vehículos, con un tramo anterior, entre Lemoa y Amorebieta, en que el tráfico es<br />
menor, situándose en los 7.800 vehículos.<br />
176<br />
Revisión <strong>de</strong>l Segundo P<strong>la</strong>n General <strong>de</strong> Carreteras <strong>de</strong>l País Vasco
INTENSIDAD DE TRÁFICO EN LA CARRETERA BI-635: LEMOA - GERNIKA-LUMO (GIPUZKOA)<br />
20,000<br />
15,000<br />
10,000<br />
5,000<br />
0<br />
Lemoa - Amorebieta<br />
Amorebieta - Zugaztieta<br />
IM D 2003<br />
E. Amorebieta - Zugaztieta<br />
Fuente: E<strong>la</strong>boración propia a partir <strong>de</strong> los datos <strong>de</strong> <strong>la</strong>s Diputaciones Forales.<br />
IM D<br />
Vista Alegre - Gernika<br />
Respecto al tráfico <strong>de</strong> pesados, éste se comporta <strong>de</strong> un modo mucho más homogéneo, situándose en todo<br />
momento en el entorno <strong>de</strong> los 1.500 vehículos. En porcentaje se observa que en el tramo en que <strong>la</strong> IMD es<br />
inferior, entre Lemoa y Amorebieta, los pesados representan el 20% <strong>de</strong> <strong>la</strong> IMD total, <strong>de</strong>scendiendo <strong>de</strong>s<strong>de</strong><br />
Amorebieta para situarse <strong>de</strong> manera constante en el entorno <strong>de</strong>l 10%.<br />
PORCENTAJE DE PESADOS EN LA CARRETERA BI-635: LEMOA - GERNIKA-LUMO (GIPUZKOA)<br />
25.00%<br />
20.00%<br />
15.00%<br />
10.00%<br />
5.00%<br />
0.00%<br />
Lemoa - Amorebieta<br />
Amorebieta - Zugaztieta<br />
IM D 2003<br />
E. Amorebieta - Zugaztieta<br />
% P esados<br />
Fuente: E<strong>la</strong>boración propia a partir <strong>de</strong> los datos <strong>de</strong> <strong>la</strong>s Diputaciones Forales.<br />
Vista Alegre - Gernika<br />
La carretera BI-636, que hace el recorrido entre Bilbao y Balmaseda, cuenta con dos tramos bien diferenciados <strong>de</strong><br />
IMD. El primero <strong>de</strong> ellos, el más cercano al Bilbao Metropolitano, cuenta con volúmenes <strong>de</strong> tráfico entre los<br />
18.000 y los 27.000 vehículos diarios, alcanzando su máximo en <strong>la</strong> estación <strong>de</strong> aforo más próxima a Bilbao.<br />
A partir <strong>de</strong> Sodupe <strong>la</strong> IMD <strong>de</strong>scien<strong>de</strong> notablemente para situarse alre<strong>de</strong>dor <strong>de</strong> los 9.000 vehículos entre esta<br />
localidad y Balmaseda, para continuar <strong>de</strong>scendiendo en el tramo final <strong>de</strong> esta carretera, entre Balmaseda y La<br />
Pinil<strong>la</strong>, hasta los 7.000 vehículos.<br />
177<br />
Revisión <strong>de</strong>l Segundo P<strong>la</strong>n General <strong>de</strong> Carreteras <strong>de</strong>l País Vasco
INTENSIDAD DE TRÁFICO EN LA CARRETERA BI-636: DE BILBAO A REINOSA (BIZKAIA)<br />
30,000<br />
25,000<br />
20,000<br />
15,000<br />
10,000<br />
5,000<br />
0<br />
E. AP-8 - Kastrexana<br />
Kastrexana - Alonsotegi<br />
Alonsotegi - Zaramillo<br />
Zaramillo - La Cuadra<br />
IM D 2003<br />
La Cuadra - Sodupe<br />
Sodupe - Artxube<br />
IM D<br />
Artxube - L<strong>la</strong>ntada<br />
L<strong>la</strong>ntada - Balmaseda N.<br />
Fuente: E<strong>la</strong>boración propia a partir <strong>de</strong> los datos <strong>de</strong> <strong>la</strong>s Diputaciones Forales.<br />
Balmaseda - La Pinil<strong>la</strong><br />
La Pinil<strong>la</strong> - Vil<strong>la</strong>sana<br />
Por su parte, los pesados registran su mayor porcentaje entre Kastrexana y Alonsotegi, don<strong>de</strong> se alcanza el 10%,<br />
manteniéndose en general en el entorno <strong>de</strong>l 8%. El menor porcentaje se registra entre La Quadra y Sodupe, en<br />
que <strong>de</strong>scien<strong>de</strong> por <strong>de</strong>bajo <strong>de</strong>l 4%.<br />
En términos absolutos, los volúmenes <strong>de</strong> pesados osci<strong>la</strong>n entre los <strong>2.</strong>500 vehículos que se registran entre Bilbao y<br />
Alonsotegi, y valores por <strong>de</strong>bajo <strong>de</strong> 1.000 <strong>de</strong>s<strong>de</strong> ese punto hasta el final <strong>de</strong> <strong>la</strong> carretera.<br />
INTENSIDAD DE PESADOS EN LA CARRETERA BI-636: DE BILBAO A REINOSA (BIZKAIA)<br />
1<strong>2.</strong>00%<br />
10.00%<br />
8.00%<br />
6.00%<br />
4.00%<br />
<strong>2.</strong>00%<br />
0.00%<br />
E. AP-8 - Kastrexana<br />
Kastrexana - Alonsotegi<br />
Alonsotegi - Zaramillo<br />
Zaramillo - La Cuadra<br />
IM D 2003<br />
La Cuadra - Sodupe<br />
Sodupe - Artxube<br />
% P esados<br />
Artxube - L<strong>la</strong>ntada<br />
L<strong>la</strong>ntada - Balmaseda N.<br />
Balmaseda - La Pinil<strong>la</strong><br />
Fuente: E<strong>la</strong>boración propia a partir <strong>de</strong> los datos <strong>de</strong> <strong>la</strong>s Diputaciones Forales.<br />
La Pinil<strong>la</strong> - Vil<strong>la</strong>sana<br />
La carretera BI-637 (localizada en Bilbao Metropolitano) es <strong>la</strong> que cuenta con mayor nivel <strong>de</strong> IMD pon<strong>de</strong>rada <strong>de</strong><br />
todas <strong>la</strong>s que componen <strong>la</strong> Red Básica. En todo el entorno metropolitano <strong>la</strong> carretera mantiene volúmenes por<br />
encima <strong>de</strong> los 70.000 vehículos, que sólo <strong>de</strong>scien<strong>de</strong>n hasta los 35.000 en el último tramo, ya en <strong>la</strong>s inmediaciones<br />
<strong>de</strong> Berango, en <strong>la</strong> zona más alejada <strong>de</strong> <strong>la</strong> capital bilbaína.<br />
El máximo <strong>de</strong> IMD se alcanza en <strong>la</strong> estación permanente situada en <strong>la</strong>s inmediaciones <strong>de</strong> Erandio, en que llegan a<br />
superarse los 100.000 vehículos / día.<br />
178<br />
Revisión <strong>de</strong>l Segundo P<strong>la</strong>n General <strong>de</strong> Carreteras <strong>de</strong>l País Vasco
INTENSIDAD DE TRÁFICO EN LA CARRETERA BI-637: ERANDIO – BERANGO (BIZKAIA)<br />
120,000<br />
110,000<br />
100,000<br />
90,000<br />
80,000<br />
70,000<br />
60,000<br />
50,000<br />
40,000<br />
30,000<br />
20,000<br />
10,000<br />
0<br />
E. Erandio - Santimami<br />
Santimami - Leioa<br />
IM D 2003<br />
Leioa - Artatza<br />
IM D<br />
Artatza - Bolue<br />
Fuente: E<strong>la</strong>boración propia a partir <strong>de</strong> los datos <strong>de</strong> <strong>la</strong>s Diputaciones Forales.<br />
Los vehículos pesados presentan un comportamiento simi<strong>la</strong>r, manteniéndose en porcentajes constantes y<br />
mo<strong>de</strong>rados <strong>de</strong> alre<strong>de</strong>dor <strong>de</strong>l 6% a lo <strong>la</strong>rgo <strong>de</strong> toda <strong>la</strong> carretera. En términos absolutos el número <strong>de</strong> pesados<br />
osci<strong>la</strong> entre los 7.000 <strong>de</strong>l tramo <strong>de</strong> mayor IMD y los <strong>2.</strong>000 <strong>de</strong> <strong>la</strong> parte final <strong>de</strong> <strong>la</strong> carretera en Berango.<br />
INTENSIDAD DE PESADOS EN LA CARRETERA BI-637: ERANDIO – BERANGO (BIZKAIA)<br />
7.0<br />
6.0<br />
5.0<br />
4.0<br />
3.0<br />
<strong>2.</strong>0<br />
1.0<br />
0.0<br />
E. Erandio - Santimami<br />
Santimami - Leioa<br />
IMD 2003<br />
Leioa - Artatza<br />
% P esado s<br />
Artatza - Bolue<br />
Fuente: E<strong>la</strong>boración propia a partir <strong>de</strong> los datos <strong>de</strong> <strong>la</strong>s Diputaciones Forales.<br />
La carretera BI-623, <strong>de</strong> Bizkaia, y su continuación, <strong>la</strong> carretera A-623 <strong>de</strong> Á<strong>la</strong>va, comunican los núcleos urbanos <strong>de</strong><br />
Durango y Legutiano. Des<strong>de</strong> Durango, que es don<strong>de</strong> el tráfico registrado es el mayor <strong>de</strong> todo el trazado (cerca <strong>de</strong><br />
9.000 vehículos / día y 1.500 vehículos pesados / día), el tráfico <strong>de</strong>crece, siendo en <strong>la</strong> estación <strong>de</strong> aforo ubicada<br />
antes <strong>de</strong> llegar a Otxandio, don<strong>de</strong> el tráfico registrado en ambas carreteras es el menor <strong>de</strong> todos (3.700 vehículos<br />
/ día). Ya <strong>de</strong>ntro <strong>de</strong>l Territorio Histórico <strong>de</strong> Á<strong>la</strong>va el tráfico se recupera ligeramente, para situarse en los 4.800<br />
vehículos.<br />
179<br />
Revisión <strong>de</strong>l Segundo P<strong>la</strong>n General <strong>de</strong> Carreteras <strong>de</strong>l País Vasco
INTENSIDAD DE TRÁFICO EN LAS CARRETERAS BI-623 (BIZKAIA) Y A-623 (ÁLAVA): VITORIA-<br />
GASTEIZ – DURANGO<br />
10,000<br />
5,000<br />
0<br />
IM D 2003<br />
Urkio<strong>la</strong> - Otxandio<br />
IM D<br />
Otxandio - L.P. (Araba)<br />
Fuente: E<strong>la</strong>boración propia a partir <strong>de</strong> los datos <strong>de</strong> <strong>la</strong>s Diputaciones Forales.<br />
Los porcentajes <strong>de</strong> pesados osci<strong>la</strong>n entre el 17% que se registra entre Izurtza y Mañaria y el 6% <strong>de</strong> <strong>la</strong> estación <strong>de</strong><br />
aforo situada en Á<strong>la</strong>va. En términos absolutos <strong>la</strong> osci<strong>la</strong>ción se produce entre los 1.500 vehículos <strong>de</strong> <strong>la</strong> primera<br />
estación y volúmenes <strong>de</strong> alre<strong>de</strong>dor <strong>de</strong> los 400 vehículos que se registran el resto <strong>de</strong> <strong>la</strong> carretera.<br />
PORCENTAJE DE PESADOS EN LAS CARRETERAS BI-623 (BIZKAIA) Y A-623 (ÁLAVA): VITORIA-<br />
GASTEIZ - DURANGO<br />
18.00%<br />
16.00%<br />
14.00%<br />
1<strong>2.</strong>00%<br />
10.00%<br />
8.00%<br />
6.00%<br />
4.00%<br />
<strong>2.</strong>00%<br />
0.00%<br />
IM D 2003<br />
Urkio<strong>la</strong> - Otxandio<br />
% P esados<br />
Otxandio - L.P. (Araba)<br />
Fuente: E<strong>la</strong>boración propia a partir <strong>de</strong> los datos <strong>de</strong> <strong>la</strong>s Diputaciones Forales.<br />
La carretera GI-627, en Gipuzkoa, y su continuación A-627 en Á<strong>la</strong>va, unen Eibar (en el Territorio Histórico <strong>de</strong><br />
Gipuzkoa) con Urbina (Territorio Histórico <strong>de</strong> Á<strong>la</strong>va). En el tramo a<strong>la</strong>vés, y hasta el Alto <strong>de</strong> Ar<strong>la</strong>bán, <strong>la</strong> IMD se<br />
mantiene en el entorno <strong>de</strong> los 9.000 vehículos, produciéndose un fuerte <strong>de</strong>scenso en este puerto, en que <strong>la</strong> IMD<br />
cae hasta los <strong>2.</strong>000 vehículos, indicando <strong>la</strong> búsqueda <strong>de</strong> itinerarios alternativos para evitar dicho puerto. La IMD<br />
se recupera posteriormente, para alcanzar nuevamente los 9.000 vehículos en el entorno <strong>de</strong> Mondragón.<br />
Posteriormente, <strong>la</strong> IMD aumenta consi<strong>de</strong>rablemente hasta alcanzar los 20.000 vehículos pasado Mondragón, para<br />
volver a <strong>de</strong>scen<strong>de</strong>r <strong>de</strong>spués hasta los 1<strong>2.</strong>000 que se registran en <strong>la</strong>s inmediaciones <strong>de</strong> Soraluze / P<strong>la</strong>cencia <strong>de</strong><br />
Armas.<br />
180<br />
Revisión <strong>de</strong>l Segundo P<strong>la</strong>n General <strong>de</strong> Carreteras <strong>de</strong>l País Vasco
INTENSIDAD DE TRÁFICO EN LAS CARRETERAS GI-627 (GUIPUZKOA) Y A-627 (ÁLAVA): VITORIA-<br />
GASTEIZ - EIBAR<br />
25.000<br />
20.000<br />
15.000<br />
10.000<br />
5.000<br />
0<br />
IMD 2003<br />
IMD<br />
Fuente: E<strong>la</strong>boración propia a partir <strong>de</strong> los datos <strong>de</strong> <strong>la</strong>s Diputaciones Forales.<br />
En lo que respecta a los pesados <strong>de</strong>staca <strong>de</strong> manera fundamental el gran porcentaje que se registra en el Alto <strong>de</strong><br />
Ar<strong>la</strong>bán, en que alcanzan el 75% <strong>de</strong> <strong>la</strong> IMD total, lo que indica que el trasvase <strong>de</strong> vehículos a los itinerarios<br />
alternativos es mucho menos importante en lo que se refiere a los pesados. El resto <strong>de</strong> <strong>la</strong> carretera se mantiene,<br />
sin embargo, en porcentajes constantes, y también interesantes, <strong>de</strong> alre<strong>de</strong>dor <strong>de</strong>l 17%.<br />
En términos absolutos el número <strong>de</strong> pesados se mantiene constante <strong>de</strong>s<strong>de</strong> Urbina hasta Mondragón, incluyendo<br />
Ar<strong>la</strong>bán, en el entorno <strong>de</strong> los 1.500 vehículos, aumentando <strong>de</strong>s<strong>de</strong> esta localidad hasta los <strong>2.</strong>000 a 3.000 vehículos.<br />
INTENSIDAD DE PESADOS EN LAS CARRETERAS GI-627 (GUIPUZKOA) Y A-627 (ÁLAVA): VITORIA-<br />
GASTEIZ - EIBAR<br />
80,00%<br />
70,00%<br />
60,00%<br />
50,00%<br />
40,00%<br />
30,00%<br />
20,00%<br />
10,00%<br />
0,00%<br />
IMD 2003<br />
Fuente: E<strong>la</strong>boración propia a partir <strong>de</strong> los datos <strong>de</strong> <strong>la</strong>s Diputaciones Forales.<br />
La carretera BI-625, en el Territorio Histórico <strong>de</strong> Bizkaia, y su continuación, <strong>la</strong> carretera A-625 en el Territorio<br />
Histórico <strong>de</strong> Á<strong>la</strong>va, comunican <strong>la</strong>s localida<strong>de</strong>s a<strong>la</strong>veses <strong>de</strong> Saratxo y Amurrio con el Bilbao Metropolitano. El tráfico<br />
presenta una evolución creciente <strong>de</strong>s<strong>de</strong> el tramo a<strong>la</strong>vés, <strong>de</strong>s<strong>de</strong> los 4.000 vehículos / día <strong>de</strong> Amurrio hasta los casi<br />
15.000 <strong>de</strong> Llodio. Ya en Bizkaia, <strong>la</strong> IMD se mantiene alre<strong>de</strong>dor <strong>de</strong> 1<strong>2.</strong>000 hasta <strong>la</strong> altura <strong>de</strong> Miraballes, punto a<br />
partir <strong>de</strong>l cual vuelve a crecer hasta situarse cerca <strong>de</strong> los 30.000 en <strong>la</strong> estación <strong>de</strong> aforo <strong>de</strong> Arrigorriaga, ya en el<br />
entorno <strong>de</strong>l Bilbao Metropolitano.<br />
181<br />
Revisión <strong>de</strong>l Segundo P<strong>la</strong>n General <strong>de</strong> Carreteras <strong>de</strong>l País Vasco
INTENSIDAD DE TRÁFICO EN LAS CARRETERAS BI-625 (BIZKAIA) Y A-625 (ÁLAVA): ORDUÑA -<br />
BILBAO<br />
35.000<br />
30.000<br />
25.000<br />
20.000<br />
15.000<br />
10.000<br />
5.000<br />
0<br />
IM D 2003<br />
Fuente: E<strong>la</strong>boración propia a partir <strong>de</strong> los datos <strong>de</strong> <strong>la</strong>s Diputaciones Forales.<br />
En <strong>la</strong> categoría <strong>de</strong> pesados el mayor porcentaje se registra en <strong>la</strong>s inmediaciones <strong>de</strong> Llodio, todavía en el Territorio<br />
Histórico <strong>de</strong> Á<strong>la</strong>va, en que se alcanzan un 28% <strong>de</strong> <strong>la</strong> IMD. En términos absolutos, los máximos se encuentran en<br />
Llodio y en Arrigorriaga, con volúmenes cercanos a los 5.000 vehículos. En el resto <strong>de</strong> <strong>la</strong> carretera se osci<strong>la</strong> entre<br />
los 600 y los 1.600 vehículos <strong>de</strong> Á<strong>la</strong>va, con <strong>la</strong> excepción citada <strong>de</strong> Llodio, y los alre<strong>de</strong>dor <strong>de</strong> <strong>2.</strong>000 en Bizkaia, con<br />
excepción <strong>de</strong>l tramo final cercano al Bilbao Metropolitano en que los volúmenes crecen hasta los 4.700 <strong>de</strong><br />
Arrigorriaga.<br />
IM D<br />
INTENSIDAD DE PESADOS EN LAS CARRETERAS BI-625 (BIZKAIA) Y A-625 (ÁLAVA): ORDUÑA -<br />
BILBAO<br />
35,0<br />
30,0<br />
25,0<br />
20,0<br />
15,0<br />
10,0<br />
5,0<br />
0,0<br />
IM D 2003<br />
Fuente: E<strong>la</strong>boración propia a partir <strong>de</strong> los datos <strong>de</strong> <strong>la</strong>s Diputaciones Forales.<br />
La comunicación entre Deba y Ondarroa se lleva a cabo mediante <strong>la</strong>s carreteras GI-638, en Gipuzkoa, y <strong>la</strong> BI-638<br />
en Bizkaia. El tráfico es mo<strong>de</strong>radamente creciente a lo <strong>la</strong>rgo <strong>de</strong> <strong>la</strong>s mismas, osci<strong>la</strong>ndo entre los 5.200 <strong>de</strong> Deba y<br />
los 6.600 <strong>de</strong> Ondarroa, ya en el Territorio Histórico <strong>de</strong> Bizkaia.<br />
No se disponen <strong>de</strong> datos <strong>de</strong> IMD <strong>de</strong> vehículos pesados en <strong>la</strong> GI-638. En <strong>la</strong> BI-638 el porcentaje <strong>de</strong> pesados <strong>de</strong>l<br />
8%, correspondiendo a un volumen <strong>de</strong> 528 vehículos / día.<br />
182<br />
Revisión <strong>de</strong>l Segundo P<strong>la</strong>n General <strong>de</strong> Carreteras <strong>de</strong>l País Vasco
INTENSIDAD DE TRÁFICO EN LAS CARRETERAS GI-638 (GUIPUZKOA) Y BI638 (BIZKAIA): DEBA –<br />
ONDARROA<br />
8.000<br />
6.000<br />
4.000<br />
<strong>2.</strong>000<br />
0<br />
<strong>2.</strong><strong>2.</strong><strong>2.</strong>3. Red Comarcal<br />
IM D 2003<br />
Fuente: E<strong>la</strong>boración propia a partir <strong>de</strong> los datos <strong>de</strong> <strong>la</strong>s Diputaciones Forales.<br />
La Red Funcional está completada por carreteras <strong>de</strong> <strong>la</strong> Red Comarcal. A continuación se presenta el <strong>análisis</strong> <strong>de</strong> <strong>la</strong>s<br />
intensida<strong>de</strong>s <strong>de</strong> tráfico para <strong>la</strong>s carreteras incluidas en esta Red.<br />
IM D<br />
183<br />
Revisión <strong>de</strong>l Segundo P<strong>la</strong>n General <strong>de</strong> Carreteras <strong>de</strong>l País Vasco
Estación Carretera Tipo P.K. Localidad más próxima<br />
CARRETERA A-2126: OYÓN / OION – BERNEDO. ÁLAVA<br />
EVOLUCIÓN DEL TRÁFICO EN LOS CORREDORES REPRESENTATIVOS DE LA RED COMARCAL<br />
IMD<br />
2003 2002 2001 2000 1999 1998 1997<br />
%<br />
Pesados<br />
IMD<br />
%<br />
Pesados<br />
IMD<br />
%<br />
Pesados<br />
IMD<br />
%<br />
Pesados<br />
IMD<br />
%<br />
Pesados<br />
IMD<br />
%<br />
Pesados<br />
IMD<br />
%<br />
Pesados<br />
184<br />
Variación (%) 1997<br />
- 2003<br />
IMD Pesados<br />
470 A-2126 3 42,0 Puerto Bernedo 511 3,0 344 4,0 628 4,0 460 4,0 406 4,4 359 3,9 342 4,1 6,9 0,0<br />
480 A-2126 3 53,5 Yécora 585 4,0 1.247 4,0 1.113 4,0 944 4,0 694 4,4 839 3,9 799 4,0 -5,1 -4,0<br />
490 A-2126 1 59,1 Oyón (L.P. Logroño) 8.419 8,0 8.003 7,2 7.873 6,9 7.487 7,9 7.479 7,1 7.261 9,2 6.675 5,6 3,9 9,6<br />
CARRETERA A-2128: SANTA CRUZ DE KANPEZO – SALVATIERRA. ÁLAVA<br />
380 A-2128 2 27,3 Opacua 1.025 8,0 980 8,0 951 8,0 910 8,0 986 9,5 909 8,0 900 8,0 2,2 1,8<br />
390 A-2128 3 38,0 Puerto Opacua 800 4,0 636 4,0 489 4,0 451 4,0 398 1,7 375 4,0 281 3,9 19,1 19,6<br />
432 A-2128 3 39,4 Santa Cruz 410 5,0 311 5,0 258 5,0 283 5,0 208 5,5 305 4,9 207 4,8 12,1 12,4<br />
400 A-2128 3 55,8 Contrasta 419 4,0 333 4,0 289 4,0 361 4,0 245 1,7 118 4,2 232 4,3 10,4 9,3<br />
CARRETERA A-2124: VITORIA-GASTEIZ – LEZA. ÁLAVA<br />
640 A-2124 3 3,7 Castillo 3.361 11,0 4.180 2,0 3.278 2,0 3.440 2,0 <strong>2.</strong>960 2,5 <strong>2.</strong>972 2,0 <strong>2.</strong>847 2,0 2,8 37,3<br />
160 A-2124 1 9,5 Puerto Vitoria 3.904 10,0 3.493 1,6 3.648 1,9 3.433 1,9 3.262 5,7 3.380 2,1 3.226 1,8 3,2 38,0<br />
630 A-2124 3 15,8 Peñacerrada (a Vitoria) 456 4,0 904 4,0 1.186 4,0 1.310 4,0 1.050 4,9 1.161 4,0 1.229 4,0 -15,2 -17,1<br />
540 A-2124 2 26,0 Puerto Herrera 495 - 847 0,0 760 0,0 787 0,0 776 0,0 887 0,0 850 0,0 -8,6 -<br />
CARRETERA A-2130: ARETXABALETA – ASCARZA (VITORIA-GASTEIZ). ÁLAVA<br />
170 A-2130 1 5,0 Otazu 3.438 6,0 3.184 5,2 3.179 5,1 <strong>2.</strong>811 5,6 <strong>2.</strong>913 5,0 <strong>2.</strong>916 4,25 <strong>2.</strong>225 9,0 7,5 0,3<br />
CARRETERA A-2134: VITORIA-GASTEIZ. ÁLAVA<br />
62 A-2134 1 7,9 Zurbano 4.528 18,0 3.822 20,6 3.324 26,3 3.643 23,3 <strong>2.</strong>594 30,9 <strong>2.</strong>399 26,6 <strong>2.</strong>531 11,0 10,2 19,6<br />
CARRETERA A-2122: ZUBILLAGA – SOBRÓN. ÁLAVA<br />
1170 A-2122 2 34,7 Zubil<strong>la</strong>ga 3.928 21,0 4.016 21,0 3.793 21,0 3.617 21,0 4.067 17,8 3.806 21,0 4.589 8,0 10,2 19,6<br />
920 A-2122 3 42,8 Puente<strong>la</strong>rrá 1.952 16,0 1.794 21,0 1.889 21,0 1.713 21,0 <strong>2.</strong>157 20,2 1.746 21,0 <strong>2.</strong>108 7,0 10,2 19,6<br />
921 A-2122 3 47,3 Sobrón 1.101 16,0 875 21,0 1.147 21,0 838 21,0 1.332 20,2 985 21,0 1.279 7,0 10,2 19,6<br />
CARRETERA A-2622: NANCLARES DE OKA – LÍMITE CON BURGOS (GURENDES). ÁLAVA<br />
670 A-2622 3 12,5 Nanc<strong>la</strong>res <strong>de</strong> <strong>la</strong> Oka 4.494 7,0 6.001 7,0 5.082 6,3 6.479 6,8 5.193 7,5 5.147 8,0 4.123 6,0 1,4 4,1<br />
680 A-2622 1 16,5 Montevite <strong>2.</strong>459 4,0 <strong>2.</strong>265 4,9 <strong>2.</strong>296 5,5 <strong>2.</strong>075 20,7 1.984 4,4 <strong>2.</strong>171 5,2 1.781 3,8 5,5 7,4<br />
700 A-2622 3 22,8 Paúl 903 5,0 1.126 4,9 853 5,0 1.780 20,7 707 4,2 877 5,1 673 3,9 5,0 8,6<br />
1210 A-2622 3 33,5 Tuesta 1.131 5,0 871 7,0 1.248 7,0 769 7,0 875 4,2 783 6,9 698 7,2 8,4 2,7<br />
740 A-2622 3 40,0 Guren<strong>de</strong>s 524 5,0 891 4,9 916 5,5 846 20,7 586 4,8 817 5,1 717 3,8 -5,1 -2,1<br />
750 A-2622 3 51,5 Tobil<strong>la</strong>s 148 5,0 262 4,9 144 5,5 242 20,7 148 4,6 185 4,9 167 3,6 -2,0 2,6<br />
CARRETERA A-2625: BERGÜENDA – ORDUÑA. ÁLAVA<br />
722 A-2625 3 34,0 Cárcamo 133 8,0 228 10,0 185 10,0 430 10,0 221 7,1 133 9,8 147 6,1 -1,7 1,8<br />
923 A-2625 3 318,9 Puente<strong>la</strong>rrá <strong>2.</strong>804 4,0 709 6,0 587 6,0 596 6,0 570 5,7 1.064 5,9 984 6,0 19,1 13,2<br />
922 A-2625 3 321,0 Bergüenda 1.612 4,0 1.622 6,0 1.478 6,0 946 6,0 1.270 5,7 1.521 6,0 1.383 6,0 2,6 -2,3<br />
Revisión <strong>de</strong>l Segundo P<strong>la</strong>n General <strong>de</strong> Carreteras <strong>de</strong>l País Vasco
Estación Carretera Tipo P.K. Localidad más próxima<br />
IMD<br />
2003 2002 2001 2000 1999 1998 1997<br />
%<br />
Pesados<br />
IMD<br />
%<br />
Pesados<br />
IMD<br />
%<br />
Pesados<br />
IMD<br />
%<br />
Pesados<br />
IMD<br />
%<br />
Pesados<br />
IMD<br />
%<br />
Pesados<br />
IMD<br />
%<br />
Pesados<br />
185<br />
Variación (%) 1997<br />
- 2003<br />
IMD Pesados<br />
720 A-2625 1 334,8 Osma 1.221 4,0 1.048 4,8 1.026 5,4 1.163 5,4 750 10,7 697 10,0 722 6,1 9,2 1,8<br />
721 A-2625 3 346,2 Puerto Orduña 808 4,0 1.136 6,0 622 6,0 508 6,0 544 4,9 539 5,9 528 6,1 7,3 1,9<br />
CARRETERA A-2521: ALTUBE – ORDUÑA. ÁLAVA<br />
830 A-2521 2 23,8 Beluntza <strong>2.</strong>415 11,0 <strong>2.</strong>503 11,0 <strong>2.</strong>160 11,0 1.923 11,0 1.636 9,1 1.656 11,0 1.413 10,0 9,3 10,8<br />
760 A-2521 3 30,0 Unzá 780 5,0 773 6,0 636 6,0 622 6,0 563 5,4 613 5,9 966 6,0 -3,5 -6,0<br />
CARRETERA A-2604: GORDELIZ – LÍMITE CON BIZKAIA PASANDO POR ARTZINIEGA. ÁLAVA<br />
900 A-2604 3 1,0 Gordéliz (Artziniega) 1.889 5,0 1.634 6,0 1.519 6,0 1.446 6,0 1.003 5,4 938 6,0 893 6,0 13,3 11,1<br />
902 A-2604 3 4,5 Gordéliz (Peña Angulo) 654 4,0 864 5,0 848 5,0 667 5,0 623 4,5 615 5,0 410 8,0 8,1 -2,0<br />
850 A-2604 1 55,5 Artziniega <strong>2.</strong>960 8,0 <strong>2.</strong>862 8,4 <strong>2.</strong>764 8,4 <strong>2.</strong>545 8,4 <strong>2.</strong>706 7,8 <strong>2.</strong>723 7,4 1.401 4,0 13,3 26,8<br />
CARRETERA BI-2604: SODUPE - LÍMITE CON ÁLAVA –. BIZKAIA<br />
72 C BI-2604 2 - Gor<strong>de</strong>xo<strong>la</strong> – L.P. (Artziniega) <strong>2.</strong>924 6,0 <strong>2.</strong>834 6,0 <strong>2.</strong>881 6,0 <strong>2.</strong>845 6,0 <strong>2.</strong>577 6,0 <strong>2.</strong>605 6,0 <strong>2.</strong>439 6,0 3,1 3,1<br />
72 A BI-2604 3 - Gor<strong>de</strong>xo<strong>la</strong> – Padura (Sodupe) 4.124 8,0 4.016 8,0 3.899 8,0 3.781 8,0 3.702 8,0 3.566 8,0 3.525 8,0 2,7 2,7<br />
57 B BI-2604 3 - Sodupe - Padura 4.914 4,0 5.096 4,0 6.244 4,0 6.542 4,0 6.234 4,0 5.973 4,0 5.889 4,0 -3,0 -3,0<br />
CARRETERA A-252<strong>2.</strong> ZIORRAGA – LÍMITE CON BIZKAIA. ÁLAVA<br />
800 A-2522 3 34,3 Baranbio 1.724 5,0 1.709 10,0 1.613 10,0 1.832 10,0 1.645 4,6 <strong>2.</strong>721 10,0 <strong>2.</strong>569 10,0 -6,4 -17,8<br />
790 A-2522 1 36,6 Ziorraga 1.744 15,0 1.922 13,8 1.953 15,1 <strong>2.</strong>038 16,5 <strong>2.</strong>238 12,4 <strong>2.</strong>727 11,6 1.955 17,6 -1,9 -5,0<br />
791 A-2522 3 47,0 Llodio (Orozco) 6.459 7,0 5.601 10,0 6.212 10,0 5.844 10,0 4.732 4,6 5.321 10,0 5.137 10,0 3,9 -1,3<br />
CARRETERA BI-2522: LLODIO - LÍMITE CON ÁLAVA –. BIZKAIA<br />
177 A BI-2522 2 - Orozko – L.P. (Ziorraga) <strong>2.</strong>065 8,0 <strong>2.</strong>310 8,0 <strong>2.</strong>446 8,0 <strong>2.</strong>608 8,0 <strong>2.</strong>818 8,0 <strong>2.</strong>711 8,0 <strong>2.</strong>322 8,0 -1,9 -1,9<br />
177 C BI-2522 2 - E. Areta Sur - Orozko 5.351 7,0 5.762 7,0 5.532 7,0 5.549 7,0 5.727 7,0 5.540 7,0 4.859 4,0 1,6 11,6<br />
159 A BI-2522 2 - Areta – E. Areta Sur 5.951 10,0 6.392 10,0 6.117 10,0 6.215 10,0 6.676 10,0 6.810 10,0 5.836 10,0 0,3 0,3<br />
CARRETERA A-2620: LEGUTIANO – ARRASATE / MONDRAGÓN. ÁLAVA<br />
320 A-2620 2 17,3 Puerto Cruceta 944 5,0 774 4,0 759 4,0 850 4,0 800 3,1 827 4,0 751 4,0 3,9 6,6<br />
450 A-2620 3 31,2 Ibarra <strong>de</strong> Aramaio <strong>2.</strong>803 5,0 <strong>2.</strong>919 8,0 <strong>2.</strong>823 8,0 <strong>2.</strong>768 8,0 <strong>2.</strong>054 5,6 1.345 8,0 1.720 8,0 8,5 1,2<br />
CARRETERA GI-2120 (Antigua GI-120): ESTELLA - BEASAIN. GIPUZKOA<br />
64 GI-2120 3 49,2 Alto <strong>de</strong> Lizarrusti 343 14,0 761 - 750 - 631 - 1.447 - 495 - 664 - -10,4 -<br />
97 GI-2120 2 62,0 Puente Nuevo Ataun 3.473 8,0 3702 8,0 3.805 9,0 3.813 8,0 3.528 - 3.154 - 3.071 - 2,1 -<br />
1314 GI-2120 3 63,4 Variante <strong>de</strong> Lazkao 7.255 11,0 6.075 - 7.514 - 5.704 - 5.084 - 4.514 - 3.167 - 14,8 -<br />
CARRETERA GI-2620: ARRASATE / MONDRAGÓN – LÍMITE CON ÁLAVA. GIPUZKOA<br />
95 GI-2620 3 16,6 Santa Ageda <strong>2.</strong>223 - 1.926 - <strong>2.</strong>242 - <strong>2.</strong>166 - <strong>2.</strong>481 - 1.549 - 1.241 - 10,2 -<br />
94 GI-2620 3 19 Arrasate / Mondragón 6.961 - 5.458 - 6.937 - 7.082 - 6.258 - 6.368 - 5.826 - 3,0 -<br />
53 GI-2620 3 22,2 Arrasate / Mondragón 14.716 - 13.122 - 15.314 - 15.603 - 13.736 - 13.218 - 1<strong>2.</strong>594 - 2,6 -<br />
CARRETERA GI-2630: ZUMARRAGA – ARRASATE / MONDRAGÓN. GIPUZKOA<br />
9259 GI-2630 3 0,3 Urretxu 11.893 - 11.801 - 11.230 - 11.528 - 15.409 - 10.711 - 8.252 - 6,3 -<br />
Revisión <strong>de</strong>l Segundo P<strong>la</strong>n General <strong>de</strong> Carreteras <strong>de</strong>l País Vasco
Estación Carretera Tipo P.K. Localidad más próxima<br />
IMD<br />
2003 2002 2001 2000 1999 1998 1997<br />
%<br />
Pesados<br />
IMD<br />
%<br />
Pesados<br />
IMD<br />
%<br />
Pesados<br />
IMD<br />
%<br />
Pesados<br />
IMD<br />
%<br />
Pesados<br />
IMD<br />
%<br />
Pesados<br />
IMD<br />
%<br />
Pesados<br />
186<br />
Variación (%) 1997<br />
- 2003<br />
IMD Pesados<br />
88 GI-2630 3 8,5 Alto <strong>de</strong> Udana <strong>2.</strong>514 - <strong>2.</strong>662 - <strong>2.</strong>618 - <strong>2.</strong>586 - <strong>2.</strong>639 - 1.906 - 1.640 - 7,4 -<br />
82 GI-2630 2 14,6 Salida hacía Udana 3.467 13,0 3.712 14,0 3.554 14,0 3.581 15,0 3.292 - <strong>2.</strong>824 - <strong>2.</strong>742 - 4,0 -<br />
56 GI-2630 3 23,6 Cruce <strong>de</strong> San Pru<strong>de</strong>ntzio 8.983 - 10.254 - 9.495 - 10.552 - 13.264 - 8.260 - 7.329 - 3,4 -<br />
CARRETERA GI-213<strong>2.</strong> ASTIGARRA – ERRENTERIA. GIPUZKOA<br />
119 GI-2132 3 0 Ga<strong>la</strong>rreta 21.170 - 20.391 - 19.448 - 19.761 - 21.649 - 17.929 - 16.029 - 4,7 -<br />
71 GI-2132 3 0,1 Errekal<strong>de</strong> 2<strong>2.</strong>623 - 2<strong>2.</strong>964 - 21.853 - 2<strong>2.</strong>346 - 16.120 - 19.882 - 17.572 - 4,3 -<br />
92 GI-2132 3 9,1 Benta – Astigarraga Perurena 9.933 - 9.866 - 9.491 - 9.929 - 10.332 - 8.602 - 8.863 - 1,9 -<br />
93 GI-2132 1 10,2 Benta - Astigarraga 7.420 17,0 6.716 16,0 6.648 17,0 6.728 18,0 6.498 - 6.671 - 7.001 - 1,0 -<br />
9136 GI-2132 3 14,8 Lartzabal - Mamut 26.703 - 24.500 - 24.364 - 2<strong>2.</strong>762 - 23.443 - 19.091 - 20.013 - 4,9 -<br />
CARRETERA GI-2633. ARROA – ZARAUTZ. GIPUZKOA<br />
39 GI-2633 3 4,1 Meaga Gaina 4.350 - 4.188 - 4.076 - 3.458 - <strong>2.</strong>609 - 3.582 - 3.131 - 5,6 -<br />
CARRETERA GI-2135 (Antigua N-130): TOLOSA – L.P NAVARRA. GIPUZKOA<br />
48 GI-2135 0 59,1 Pasada recta Txamara <strong>2.</strong>300 16,0 <strong>2.</strong>410 14,0 <strong>2.</strong>234 15,0 <strong>2.</strong>139 15,0 <strong>2.</strong>262 14,0 <strong>2.</strong>404 17,0 <strong>2.</strong>234 16,0 0,5 0,5<br />
9212 GI-2135 3 61,5 B. Amoroz – Palp. Araxes 4.322 11,0 3.779 - 3.943 - 3.988 - 4.332 - 3.800 - 1.121 - 25,2 -<br />
CARRETERA GI-2130: TOLOSA – LÍMITE CON NAVARRA (PUERTO DE URTO). GIPUZKOA<br />
9312 GI-2130 3 1,7 Ibarra – F. Casa Montes 7.882 - 7.596 - 7.703 - 7.616 - 7.960 - 3.857 - 4.152 - 11,3 -<br />
75 GI-2130 3 8,6 Salida <strong>de</strong> Elduain <strong>2.</strong>015 - 1.894 - 1.844 - 1.855 - <strong>2.</strong>918 - 1.816 - 1.420 - 6,0 -<br />
132 GI-2130 0 11,8 Caserío Sabiñone 1.886 10,0 1.831 10,0 1.803 12,0 1.749 11,0 1.726 - 1.776 - 384 - 30,4 -<br />
CARRETERA GI-2634: TOLOSA – AZPEITIA. GIPUZKOA<br />
60 GI-2634 3 5,7 Cruce <strong>de</strong> Beizama 3.143 - 3.024 - 3.001 - <strong>2.</strong>959 - <strong>2.</strong>962 - 3.640 - <strong>2.</strong>734 - 2,4 -<br />
61 GI-2634 3 14,4 Salida <strong>de</strong> Errezilgo 755 - 901 - 823 - 748 - 738 - 1.134 - 894 - -2,8 -<br />
9258 GI-2634 3 22,9 Cruce <strong>de</strong> Bidania <strong>2.</strong>125 - <strong>2.</strong>239 - <strong>2.</strong>133 - 1.974 - 1.618 - <strong>2.</strong>287 - <strong>2.</strong>408 - -2,1 -<br />
131 GI-2634 2 33,7 Túnel <strong>de</strong> Azkarateko 5.597 16,0 5.655 18,0 5.225 17,0 5.416 18,0 4.840 17,0 4.577 17,0 4.468 17,0 3,8 35,5<br />
CARRETERA GI-2636: ELGOIBAR – LÍMITE CON BIZKAIA (ALTO DE SAN MIGUEL). GIPUZKOA<br />
83 GI-2636 3 1,9 Elgoibar 1.296 - 1.261 - 1.248 - 1.344 - 1.266 - 1.322 - 1.034 - 3,8 -<br />
CARRETERA BI-2636: ELGOIBAR - LÍMITE CON GIPUZKOA. BIZKAIA<br />
146 A BI-2636 2 - L.P. (Elgoibar) – Etxebarria 811 7,0 805 7,0 764 7,0 714 7,0 699 7,0 669 8,0 657 8,0 3,6 1,3<br />
146 C BI-2636 3 - Etxebarria - Markina 4.108 9,0 3.841 9,0 3.646 9,0 3.493 9,0 3.192 9,0 <strong>2.</strong>969 9,0 <strong>2.</strong>870 9,0 6,2 6,2<br />
CARRETERA BI-2224: GERNIKA-LUMO - MARKINA / XEMEIN. BIZKAIA<br />
145 B BI-2224 2 - Bolívar - Iruzubieta 1.197 6,0 1.234 6,0 1.219 6,0 1.102 6,0 1.076 6,0 1.042 6,0 1.055 6,0 2,1 2,1<br />
140 C BI-2224 3 - Arbatzegi - Bolibar 619 6,0 626 6,0 631 6,0 629 6,0 686 6,0 594 6,0 635 6,0 -0,4 -0,4<br />
140 A BI-2224 3 - Ibartxu - Arbatzegi 793 6,0 740 6,0 710 6,0 704 6,0 736 6,0 726 6,0 701 6,0 2,1 2,1<br />
127 C BI-2224 3 - Gernika - Uarka <strong>2.</strong>291 5,0 <strong>2.</strong>517 5,0 <strong>2.</strong>556 5,0 <strong>2.</strong>450 5,0 <strong>2.</strong>493 5,0 <strong>2.</strong>325 5,0 <strong>2.</strong>031 5,0 2,0 2,0<br />
CARRETERA BI-2405: PLAZAKOLA – LEKEITO. BIZKAIA<br />
Revisión <strong>de</strong>l Segundo P<strong>la</strong>n General <strong>de</strong> Carreteras <strong>de</strong>l País Vasco
Estación Carretera Tipo P.K. Localidad más próxima<br />
IMD<br />
2003 2002 2001 2000 1999 1998 1997<br />
%<br />
Pesados<br />
IMD<br />
%<br />
Pesados<br />
IMD<br />
%<br />
Pesados<br />
IMD<br />
%<br />
Pesados<br />
IMD<br />
%<br />
Pesados<br />
IMD<br />
%<br />
Pesados<br />
IMD<br />
%<br />
Pesados<br />
187<br />
Variación (%) 1997<br />
- 2003<br />
IMD Pesados<br />
148 B BI-2405 3 - P<strong>la</strong>zako<strong>la</strong> - Oleta 3.792 6,0 3.576 6,0 3.490 6,0 3.400 6,0 3.111 6,0 <strong>2.</strong>823 6,0 <strong>2.</strong>706 6,0 5,8 5,8<br />
142 B BI-2405 3 - Oleta - Amoroto 5.492 5,0 5.165 5,0 4.375 5,0 4.103 5,0 3.863 5,0 3.577 6,0 3.117 6,0 9,9 6,6<br />
142 C BI-2405 3 - Oleta - Lekeito 5.308 5,0 5.178 5,0 5.144 5,0 4.228 5,0 4.300 5,0 4.039 6,0 3.652 6,0 6,4 3,2<br />
134 B BI-2405 2 - Lekeito - Oleta 4.873 6,0 4.855 6,0 4.742 6,0 4.508 6,0 4.862 6,0 3.175 6,0 3.750 6,0 4,5 4,5<br />
CARRETERA BI-2238: GERNIKA-LUMO - LEKEITO. BIZKAIA<br />
134 A BI-2238 2 - Tres Cruces - Lekeito 3.240 6,0 3.261 6,0 3.192 6,0 3.170 6,0 3.436 4,0 3.175 6,0 <strong>2.</strong>606 6,0 3,7 3,7<br />
133 A BI-2238 3 - Basetxea – Tres Cruces 1.429 6,0 1.511 6,0 1.672 6,0 1.779 6,0 1.905 6,0 1.793 6,0 1.968 6,0 -5,2 -5,2<br />
132 A BI-2238 3 - Atxoste - Basetxea <strong>2.</strong>282 6,0 <strong>2.</strong>051 6,0 <strong>2.</strong>114 6,0 <strong>2.</strong>252 6,0 <strong>2.</strong>406 6,0 <strong>2.</strong>248 6,0 <strong>2.</strong>355 6,0 -0,5 -0,5<br />
131 C BI-2238 3 -<br />
Gauztegiz – Atxoste<br />
(Muruetagana) <strong>2.</strong>043 6,0<br />
<strong>2.</strong>103 6,0 <strong>2.</strong>082 6,0 <strong>2.</strong>114 6,0 <strong>2.</strong>258 6,0 <strong>2.</strong>110 6,0 3.685 6,0<br />
-9,4 -9,4<br />
131 A BI-2238 1 - Kortezubi - Gauztegiz 7.588 5,5 7.485 5,5 7.363 5,5 7.172 5,5 7.432 5,5 6.910 6,0 6.563 6,0 2,4 1,0<br />
127 A BI-2238 3 - Gernika - Kortezubi 8.347 5,5 8.205 5,5 8.039 5,5 8.020 5,5 8.344 5,5 7.937 6,0 7.620 6,0 1,5 0,1<br />
CARRETERA BI-2235: GERNIKA-LUMO – BERMEO. BIZKAIA<br />
104 B BI-2235 3 - Bermeo - Mundaka - - 7.395 7,0 6.893 7,0 7.663 7,0 7.536 7,0 7.247 8,0 6.715 8,0 - -<br />
126 C BI-2235 3 - Gernika - Murueta 10.254 9,0 9.971 9,0 9.770 9,0 9.654 9,0 9.408 9,0 9.148 9,0 8.716 9,0 2,7 2,7<br />
128 A BI-2235 1 - Gernika - Murueta 8.300 7,0 8.136 7,0 8.260 7,0 8.464 7,0 8.247 7,0 7.818 8,0 7.787 8,0 1,1 -1,2<br />
128 B BI-2235 3 - Murueta - Busturia 7.573 7,0 7.450 7,0 7.391 7,0 7.331 7,0 6.751 7,0 6.688 7,0 6.625 8,0 2,3 0,0<br />
129 A BI-2235 3 - Busturia - Sukarrieta 7.539 7,0 7.417 7,0 7.359 7,0 7.091 7,0 6.724 7,0 6.487 7,0 6.448 8,0 2,6 0,4<br />
130 A BI-2235 3 - Sukarrieta - Mundaka 7.450 7,0 7.280 7,0 7.209 7,0 7.188 7,0 7.111 7,0 7.026 7,0 6.547 8,0 2,2 -0,1<br />
130 B BI-2235 2 - Mundaka - Bermeo 8.206 7,0 7.810 7,0 7.718 7,0 7.663 7,0 7.536 7,0 7.247 8,0 6.715 8,0 3,4 1,1<br />
CARRETERA BI-2121: MUNGIA - UGARTE / MUXIKA. BIZKAIA<br />
125 B BI-2121 2 - Vista Alegre - Muxika 3.723 6,0 3.522 6,0 3.412 6,0 <strong>2.</strong>845 6,0 <strong>2.</strong>765 6,0 <strong>2.</strong>663 7,0 <strong>2.</strong>634 7,0 5,9 3,2<br />
121 B BI-2121 3 - Alto <strong>de</strong> Morga - Muxika <strong>2.</strong>376 6,0 <strong>2.</strong>315 6,0 - - <strong>2.</strong>045 6,0 <strong>2.</strong>185 6,0 <strong>2.</strong>044 6,0 1.970 6,0 3,2 3,2<br />
121 A BI-2121 3 - Morga – Alto <strong>de</strong> Morga 1.671 6,0 1.546 6,0 - - 1.379 6.0 1.515 6,0 1.456 6,0 1.431 6,0 2,6 2,6<br />
122 B BI-2121 3 - Errigoitiolea - Morga 1.858 6,0 1.689 6,0 1.458 6,0 1.301 6,0 1.321 6,0 1.305 6,0 1.282 6,0 6,4 6,4<br />
122 A BI-2121 3 - Fruiz - Errigoitiolea <strong>2.</strong>435 6,0 <strong>2.</strong>293 6,0 <strong>2.</strong>366 6,0 1.883 6,0 1.853 6,0 1.712 6,0 1.604 6,0 7,2 7,2<br />
123 C BI-2121 3 - Soietxe - Fruiz 3.652 7,0 3.596 7,0 3.148 7,0 <strong>2.</strong>673 7,0 <strong>2.</strong>625 7,0 <strong>2.</strong>418 7,0 <strong>2.</strong>376 7,0 7,4 7,4<br />
123 A BI-2121 3 - Mungia - Soietxe 4.799 7,0 4.500 7,0 4.353 7,0 3.811 7,0 3.692 7,0 3.864 7,0 3.270 7,0 6,6 6,6<br />
101 E BI-2121 2 - Mungia - Soietxe 8.595 6,0 8.120 6,0 7.851 6,0 7.865 6,0 6.434 6,0 6.562 6,0 6.542 6,0 4,7 4,7<br />
CARRETERA BI-2713: LARRABETZU – ALTO DE GEREKIZ. BIZKAIA<br />
120 A BI-2713 3 - Larrabetzu - Astoreka 3.222 6,0 3.118 6,0 - - 3.836 6,0 3.514 6,0 3.064 6,0 <strong>2.</strong>939 6,0 1,5 1,5<br />
120 C BI-2713 3 - Astoreka – Alto <strong>de</strong> Morga 1.234 6,0 1.278 6,0 - - 1.383 6,0 1.268 6, 1.393 6,0 1.356 6,0 -1,6 -1,6<br />
CARRETERA BI-2704: ASUA – PLENTZIA. BIZKAIA<br />
79 C BI-2704 1 8,4 Asua - Loiu 1<strong>2.</strong>971 6,1 1<strong>2.</strong>139 7,2 11.784 8,1 11.714 6,3 11.661 6,5 10.730 6,0 9.272 10,0 5,8 -2,6<br />
91 A BI-2704 3 - Asua - Loiu - - 1<strong>2.</strong>139 7,2 11.784 7,5 11.714 6,5 11.661 6,5 10.730 6,8 9.272 10,0 - -<br />
Revisión <strong>de</strong>l Segundo P<strong>la</strong>n General <strong>de</strong> Carreteras <strong>de</strong>l País Vasco
Estación Carretera Tipo P.K. Localidad más próxima<br />
IMD<br />
2003 2002 2001 2000 1999 1998 1997<br />
%<br />
Pesados<br />
IMD<br />
%<br />
Pesados<br />
IMD<br />
%<br />
Pesados<br />
IMD<br />
%<br />
Pesados<br />
IMD<br />
%<br />
Pesados<br />
IMD<br />
%<br />
Pesados<br />
IMD<br />
%<br />
Pesados<br />
188<br />
Variación (%) 1997<br />
- 2003<br />
IMD Pesados<br />
92 A BI-2704 2 - Loiu - Unbe 6.525 4,0 6.381 4,0 6.304 4,0 6.312 4,0 5.877 4,0 5.904 5,0 3.841 6,0 9,2 2,1<br />
93 A BI-2704 1 13,1 Unbe – Alto Unbe 5.947 4,0 5.356 4,0 5.732 4,0 6.036 4,0 5.979 4,0 6.405 4,5 5.212 6,5 2,2 -5,7<br />
93 C BI-2704 3 -<br />
Alto Unbe – BI-3724<br />
(Urberuaga) 4.889 4,0<br />
4.673 4,0 5.001 4,0 6.449 4,0 5.334 4,5 5.413 6,0 4.513 6,0<br />
1,3 -5,3<br />
94 A BI-2704 3 - BI-3724 – Elortza (Urduliz) 4.396 4,0 4.175 4,0 4.110 4,0 4.056 4,0 3.845 4,5 4.175 5,0 3.481 6,0 4,0 -2,8<br />
89 B BI-2704 2 - Plentzia – Elortza (Urduliz) 5.309 5,0 5.231 5,0 5.348 5,0 5.781 5,0 5.606 4,0 5.455 6,0 4.543 6,0 2,6 -0,4<br />
CARRETERA BI-2543: IGORRE - OTXANDÍO POR DIMA. BIZKAIA<br />
173 C BI-2543 3 - Dima - Otxandio 531 6,5 539 6,5 494 6,5 508 6,5 498 6,5 424 7,0 403 7,0 4,7 3,4<br />
170 A BI-2543 3 - Igorre - Dima <strong>2.</strong>333 10,0 <strong>2.</strong>377 10,0 <strong>2.</strong>326 10,0 <strong>2.</strong>399 10,0 <strong>2.</strong>217 10,0 <strong>2.</strong>134 10,0 <strong>2.</strong>060 10,0 2,1 2,1<br />
165 B BI-2543 3 - Igorre - Dima <strong>2.</strong>560 8,0 <strong>2.</strong>446 8,0 <strong>2.</strong>494 8,0 <strong>2.</strong>642 8,5 <strong>2.</strong>818 8,5 <strong>2.</strong>349 10,0 <strong>2.</strong>310 10,0 1,7 -2,0<br />
CARRETERA BI-2701: MUSKIZ – MALABRIGO POR SOPUERTA. BIZKAIA<br />
41 C BI-2701 3 - Muskiz – El Arenao 6.447 7,0 6.201 7,0 5.994 7,0 6.338 7,0 5.995 7,0 5.833 8,0 5.573 8,0 2,5 0,2<br />
67 A BI-2701 1 - Muskiz – El Arenao 6.301 6,5 5.908 7,0 5.717 7,0 5.633 7,0 5.561 7,0 5.422 8,0 5.292 8,0 3,0 -0,6<br />
68 A BI-2701 3 -<br />
El Arenao – Merkadillo<br />
(Sopuerta) 5.184 7,0<br />
5.051 7,0 4.822 7,0 4.603 7,0 4.402 7,0 4.328 8,0 3.899 8,0<br />
4,9 2,6<br />
69 A BI-2701 3 - Merkadillo – El Carral 3.520 8,0 3.487 8,0 3.247 8,0 3.257 8,0 3.165 8,0 3.054 8,0 <strong>2.</strong>892 8,0 3,3 3,3<br />
69 C BI-2701 3 - El Carral - Avel<strong>la</strong>neda 3.115 8,0 <strong>2.</strong>836 8,0 <strong>2.</strong>731 8,0 <strong>2.</strong>663 8,0 <strong>2.</strong>786 8,0 <strong>2.</strong>757 8,0 <strong>2.</strong>655 8,0 2,7 2,7<br />
70 A BI-2701 3 - Avel<strong>la</strong>neda - Reto<strong>la</strong> 3.054 8,0 3.044 8,0 <strong>2.</strong>918 8,0 <strong>2.</strong>761 8,0 <strong>2.</strong>689 8,0 <strong>2.</strong>608 8,0 <strong>2.</strong>533 8,0 3,2 3,2<br />
70 B BI-2701 3 - Reto<strong>la</strong> - Ma<strong>la</strong>brigo - - 3.372 8,0 3.359 8,0 3.272 8,0 3.140 8,0 3.007 8,0 <strong>2.</strong>811 8,0 - -<br />
62 B BI-2701 3 - Ma<strong>la</strong>brigo - Reto<strong>la</strong> 3.332 8,0 3.473 8,0 3.145 8,0 3.192 8,0 3.040 8,0 <strong>2.</strong>875 8,0 <strong>2.</strong>628 8,0 4,0 4,0<br />
CARRETERA BI-2617: VILLAVER DE TRUCIOS – AGÜERA. BIZKAIA<br />
64 B BI-2617 3 - Turtioz – L.P. Cantabria 1.198 6,0 1.203 6,0 1.221 6,0 1.143 6,0 1.003 6,0 971 6,0 903 6,0 4,8 4,8<br />
CARRETERA BI-2122: SOPELANA - PLENTZIA. BIZKAIA<br />
88 C BI-2122 3 - Sope<strong>la</strong>na - Barrika 10.180 5,0 10.673 5,0 10.251 5,0 10.108 5,0 9.130 5,0 8.826 5,0 8.443 5,0 3,2 3,2<br />
89 A BI-2122 2 - Barrika - Plentzia 6.793 4,0 6.862 4,0 7.275 4,0 6.938 4,0 6.483 4,0 6.366 4,0 6.014 4,0 2,1 2,1<br />
CARRETERA BI-2521: ORDUÑA - ALTUBE. BIZKAIA<br />
No tiene estaciones <strong>de</strong> aforo.<br />
CARRETERA BI-2625: PANCORBO - ORDUÑA. BIZKAIA<br />
162 B BI-2625 2 - Orduña – L.P. Burgos 1.085 6,0 1.044 6,0 1.132 6,0 1.345 6,0 1.363 6,0 1.357 6,0 1.331 6,0 -3,3 -3,3<br />
Fuente: E<strong>la</strong>boración propia a partir <strong>de</strong> los datos <strong>de</strong> <strong>la</strong>s Diputaciones Forales <strong>de</strong> Á<strong>la</strong>va, Gipuzkoa y Bizkaia.<br />
Revisión <strong>de</strong>l Segundo P<strong>la</strong>n General <strong>de</strong> Carreteras <strong>de</strong>l País Vasco
En el siguiente gráfico, figura <strong>la</strong> tasa <strong>de</strong> crecimiento medio acumu<strong>la</strong>tivo anual en el período 1997 – 2003 en<br />
<strong>la</strong>s carreteras <strong>de</strong> <strong>la</strong> Red Comarcal que forman parte <strong>de</strong> <strong>la</strong> Red Funcional.<br />
14,0<br />
12,0<br />
10,0<br />
8,0<br />
6,0<br />
4,0<br />
2,0<br />
0,0<br />
-2,0<br />
-4,0<br />
-6,0<br />
VARIACIÓN DE LA INTENSIDAD DE TRÁFICO (%) EN LA RED COMARCAL<br />
PERÍODO 1997 – 2003<br />
IMD<br />
IMD<br />
Fuente: E<strong>la</strong>boración propia a partir <strong>de</strong> los datos <strong>de</strong> <strong>la</strong>s Diputaciones Forales.<br />
En el período 1997 – 2003, <strong>la</strong>s carreteras A-2604 (Gor<strong>de</strong>liz – Límite con Bizkaia pasando por Artziniega), <strong>la</strong><br />
GI-2130 (<strong>de</strong> Tolosa al límite <strong>de</strong> <strong>la</strong> provincia <strong>de</strong> Navarra pasando por el puerto <strong>de</strong> Urto) y <strong>la</strong> A-2128 (Santa<br />
Cruz <strong>de</strong> Kanpezo – Salvatierra) son <strong>la</strong>s que mayor crecimiento han experimentado con porcentajes que,<br />
respectivamente, superan el 12%, 10% y 9%.<br />
Tan solo el 12% <strong>de</strong> <strong>la</strong>s carreteras <strong>de</strong> <strong>la</strong> Red Comarcal que forman parte <strong>de</strong> <strong>la</strong> Red Funcional, tienen una<br />
variación negativa <strong>de</strong>l tráfico en el período <strong>de</strong> estudio consi<strong>de</strong>rado. Son <strong>la</strong>s carreteras BI-2238 (Gernika-<br />
Lumo – Lekeito), A-2124 (Vitoria-Gasteiz – Leza), A-2122 (Zubil<strong>la</strong>ga – Sobrón y BI-2625 (Pancorbo –<br />
Orduña), siendo esta última carretera don<strong>de</strong> dicho <strong>de</strong>crecimiento ha sido el mayor <strong>de</strong> todos (-4%).<br />
30,0<br />
25,0<br />
20,0<br />
15,0<br />
10,0<br />
5,0<br />
0,0<br />
-5,0<br />
-10,0<br />
VARIACIÓN DE LA INTENSIDAD DE PESADOS (%) EN LA RED COMARCAL<br />
PERÍODO 1997 – 2003<br />
Pesados<br />
Pesados<br />
Fuente: E<strong>la</strong>boración propia a partir <strong>de</strong> los datos <strong>de</strong> <strong>la</strong>s Diputaciones Forales.<br />
Por su parte, con respecto a aquel<strong>la</strong>s carreteras <strong>de</strong> <strong>la</strong>s que se dispone <strong>de</strong> datos, <strong>la</strong> variación <strong>de</strong> vehículos<br />
pesados es mucho mayor que <strong>la</strong> variación <strong>de</strong>l tráfico total, <strong>de</strong>stacando <strong>la</strong> carretera A-2124 en <strong>la</strong> que el<br />
tráfico total <strong>de</strong>crece un –1.1% y el tráfico <strong>de</strong> pesados aumenta con una tasa anual <strong>de</strong>l 25,8%. Hay a<strong>de</strong>más,<br />
tres carreteras más con tasas <strong>de</strong> crecimiento acumu<strong>la</strong>tivo anual superiores al 14%, son <strong>la</strong>s A-2604 (Gor<strong>de</strong>liz<br />
– Límite con Bizkaia pasando por Artziniega), A-2134 (en Vitoria-Gasteiz) y A-2122 (Zubil<strong>la</strong>ga - Sobrón).<br />
<strong>2.</strong><strong>2.</strong><strong>2.</strong>4. Flujos <strong>de</strong> tráfico en los años 2002 y 2003<br />
Flujo total<br />
En <strong>la</strong> siguiente tab<strong>la</strong> figuran <strong>la</strong>s carreteras <strong>de</strong> <strong>la</strong> Red Funcional c<strong>la</strong>sificadas en función <strong>de</strong> los flujos totales <strong>de</strong><br />
tráfico canalizados (IMD en el año 2002), tanto <strong>de</strong> <strong>la</strong> Red <strong>de</strong> Interés Preferente como <strong>de</strong> <strong>la</strong> Red Básica y <strong>de</strong><br />
<strong>la</strong> Red Comarcal. Los rangos <strong>de</strong> tráfico consi<strong>de</strong>rados son los mismos que figuran en el P<strong>la</strong>n <strong>de</strong> Carreteras<br />
vigente (superior a 80.000 vehículos / día, entre 40.000 y 80.000 vehículos / día, entre 20.000 y 40.000<br />
vehículos / día, entre 10.000 y 20.000 vehículos / día, entre 5.000 y 10.000 vehículos / día, entre <strong>2.</strong>000 y<br />
5.000 vehículos / día y por último inferior a <strong>2.</strong>000 vehículos / día).<br />
189<br />
Revisión <strong>de</strong>l Segundo P<strong>la</strong>n General <strong>de</strong> Carreteras <strong>de</strong>l País Vasco
FLUJOS TOTALES DE TRÁFICO EN LA RED FUNCIONAL<br />
AÑO 2002<br />
Estación Carretera P.K. Localidad más próxima IMD<br />
IMD superior a 80.000 vehículos / día<br />
22 A A-8 118,3 E. Kastrexana - E. Sabino A. 134.010<br />
21 A A-8 120,0 E. Cruces - E. Kastrexana 13<strong>2.</strong>403<br />
43 A N-637 8,7 E. Cruces - E. Barakaldo 130.782<br />
178 A A-8 129,1 E. Cruces - E. Sestao 124.462<br />
45 A N-637 9,7 Barakaldo - Lutxana / Asua 117.657<br />
24 A A-8 116,7 E. Sabino A.- E. Juan Garai 109.374<br />
179 A A-8 126,5 E. Sestao - E. Portugalete 106.595<br />
117 A-8 18,8 Túnel <strong>de</strong> Intxaurrondo 105.879<br />
116 A-8 22,7 Túnel <strong>de</strong> Aiete 104.801<br />
81 A BI-637 9,3 E. Erandio – Santimami 103.269<br />
46 A BI-637 - E. Kuku<strong>la</strong>rra – R. Erandio 96.769<br />
26 A A-8 - E. Juan Garai – Buia 96.527<br />
83 A BI-637 11,1 Santimami – Leioa 9<strong>2.</strong>921<br />
180 A A-8 128,0 E. Portugalete - E. Santurtzi 81.263<br />
IMD entre 40.000 vehículos / día y 80.000 vehículos / día<br />
84 A BI-637 - Leioa – Artatza 76.687<br />
250 A-8 24,0 Aritzeta – Ariete 74.466<br />
23 A Acceso A-8 - En<strong>la</strong>ce Sabino Arana 71.198<br />
33 N-I 448,8 Andoain 70.770<br />
27 A A-8 112,9 Buia - E. Basauri 67.557<br />
84 D BI-637 13,9 Artatza – Bolue 67.414<br />
16 A-8 20,7 X <strong>de</strong> <strong>la</strong> Misericordia 6<strong>2.</strong>744<br />
181 A A-8 131,7 E. Perto - E. S. Fuentes 58.220<br />
247 Acceso N-I 2 En<strong>la</strong>ce <strong>de</strong> Aritzeta 55.993<br />
96 N-I 445,1 Sorabil<strong>la</strong> 55.105<br />
101 N-I 466,2 Kaputxinos 51.163<br />
1 N-I 454,6 Frente a Coca – Co<strong>la</strong> 50.258<br />
45 C N-637 11,6 E. Kuku<strong>la</strong>rra - Enekuri (BI-604) 50.102<br />
9302 N-I 463 Herrera – Escaleril<strong>la</strong>s 49.379<br />
277 A-8 16 Pasaia / San Sebastián Este 46.792<br />
Estación Carretera P.K. Localidad más próxima IMD<br />
99 C N-637 - Túneles Artxanda - E. Larrondo 46.153<br />
12 N-I 437,8 Irura 45.773<br />
1 A N-634 107,4 Ibarsusi – Etxebarri 45.741<br />
99 A N-637 12,8 E. Asua (BI-604) - TT. Artxanda 44.983<br />
182 A A-8 135,2 E. San Fuentes - E. La Arena 44.250<br />
108 A N-634 103,5 Irubi<strong>de</strong> – Galdakao 4<strong>2.</strong>680<br />
278 A-8 12 Oiartzun / Pasaia 4<strong>2.</strong>559<br />
107 N-I 428,5 Variante Ikaztegieta 41.940<br />
100 N-I 434,3 Variante <strong>de</strong> Tolosa 41.864<br />
99 E N-637 - E. Larrondo - E. Derio (N-633) 41.615<br />
183 A A-8 139,1 E. La Arena - E. La Haya (L.P.) 41.338<br />
253 N-I 466,5 Variante Errenteria 40.576<br />
109 A N-634 100,2 Galdakao - El Gallo 40.190<br />
IMD entre 20.000 vehículos / día y 40.000 vehículos / día<br />
111 N-I 424 Itsasondo 37.301<br />
97 A BI-631 3,1 Orueta – Santo Domingo 37.131<br />
107 A N-634 104,0 Etxebarri – Irubi<strong>de</strong> 36.567<br />
279 A-8 9 Irun / Oiartzun 35.869<br />
269 A-8 7,3 Barrera Irun 35.869<br />
660 N-I 337 Boquete <strong>de</strong> Lapueb<strong>la</strong> 34.654<br />
- A-8 108,5 Circunva<strong>la</strong>ción a Galdakao 34.508<br />
- AP-68 10,3 Ugao / Miraballes – Arakaldo 34.497<br />
6 A BI-631 - S. Sur (A-8) – Miraflores 34.256<br />
98 C N-633 - Derio – Al<strong>de</strong>kone (Aeropuerto) 33.990<br />
- A-8 103,7 Erletxe – Boroa 33.453<br />
252 N-I 468 Variante Errenteria 33.450<br />
84 N-I 476,5 Irun Cruce – Hospital 33.016<br />
86 B BI-637 16,5 Bolue – Kurtxes (Berango) 3<strong>2.</strong>884<br />
9101 N-I 453,9 Alto <strong>de</strong> Lasarte Oria 3<strong>2.</strong>878<br />
3 N-I 473 Final Gaintxurizketa 3<strong>2.</strong>683<br />
36 N-I 469,1 Recta <strong>de</strong> Lintzirin 3<strong>2.</strong>675<br />
120 N-I 326,3 ETD 3 – Armiñón 3<strong>2.</strong>150<br />
98 A BI-631 4,4 Santo Domingo – N-633 (Galbarriatu) 31.978<br />
2 N-I 3 A. De Miracruz Atego 31.784<br />
190<br />
Revisión <strong>de</strong>l Segundo P<strong>la</strong>n General <strong>de</strong> Carreteras <strong>de</strong>l País Vasco
Estación Carretera P.K. Localidad más próxima IMD<br />
78 C BI-604 6,0 Enekuri – Kuku<strong>la</strong>rra / Txoriherri 31.598<br />
- AP-68 12,5 Arakaldo / Murueta 31.541<br />
249 A-8 25,9 Tramo <strong>de</strong> Aritzeta 31.034<br />
87 A BI-634 19,3 Berango – Larrabasterra 30.872<br />
840 N-622 7 ETD 1 - En<strong>la</strong>ce <strong>de</strong> Etxabarri Viña 30.731<br />
4 B N-634 - Bolueta – Miraflores 30.117<br />
34 Acceso N-I 0 Zapatari - Avda. Tolosa 29.858<br />
51 N-622 4,5 Puente Zadorra 29.799<br />
276 A-8 30 San Sebastián O. – Zarautz 29.705<br />
- AP-68 - Ziorroga – Altube 29.568<br />
50 N-I 354,3 ETD 4 – Abetxuko 29.553<br />
- A-8 105,1 Galdakao – Erletxe 29.276<br />
32 A N-634 116,8 Burtzeña – Zorrotza 29.060<br />
28 A AP-68 1,7 Buia – Arrigorriaga 28.971<br />
- AP-68 - Llodio – Ziorroga 28.527<br />
- AP-68 15,7 Murueta / L.P. Á<strong>la</strong>va 28.526<br />
113 B N-634 - E. Iurreta – Durango 28.185<br />
30 N-I 346,7 Crispijana / Krispiñana 27.689<br />
113 A N-634 82,9 La Pi<strong>la</strong>stra - E. Iurreta 27.630<br />
103 N-I 479,5 Behobia 27.595<br />
- A-8 95,8 Etxano – Iurreta 27.545<br />
110 A N-634 98,5 El Gallo – Erletxe 27.427<br />
40 N-I 348,9 Yurre 27.300<br />
- A-8 98,9 Amorebieta / Etxano 26.412<br />
98 D N-637 19,7 Derio – Zamudio 26.251<br />
14 A BI-604 - Deusto – Enekuri 25.896<br />
78 A BI-604 4,8 Enekuri – Deusto 25.896<br />
154 A BI-625 384,9 E. Basauri - Moyordín (Arrigorriaga) 25.861<br />
21 B BI-636 4,2 E. A-8 – Kastrexana 25.743<br />
248 A-8 25,2 En<strong>la</strong>ce <strong>de</strong> Aritzeta 24.755<br />
60 N-I 356,4 Durana 24.545<br />
32 C N-634 117,2 Burtzeña – Cruces 24.517<br />
9136 GI-2132 14,8 Lartzabal – Mamut 24.500<br />
101 G BI-631 17,4 Variante Mungia 24.379<br />
Estación Carretera P.K. Localidad más próxima IMD<br />
90 N-I 371,6 Arrieta 24.285<br />
20 N-I 344 Aríñez 24.273<br />
275 A-8 45 Zestoa / Zarautz 24.196<br />
163 A N-240 11,8 El Gallo – Bedia 24.008<br />
112 A N-634 83,7 Amorebieta - E. La Pi<strong>la</strong>stra 23.987<br />
140 N-I 379,3 Mezkia 23.949<br />
844 N-622 8,6 Kas 23.873<br />
118 N-638 1,6 Entre Amute y Aeropuerto 23.578<br />
111 A N-634 93,9 Erletxe - Amorebieta O. 23.161<br />
45 B N-637 11,2 E. Lutxana / Asua 23.050<br />
71 GI-2132 0,1 Errekal<strong>de</strong> 2<strong>2.</strong>964<br />
61 N-240 4,7 Gamarra Mayor 2<strong>2.</strong>801<br />
80 N-I 365,8 Venta <strong>de</strong>l Patio 2<strong>2.</strong>747<br />
104 N-634 1,5 Cruce Txikierdi 2<strong>2.</strong>375<br />
55 A BI-636 7,2 Kastrexana – Alonsotegi 2<strong>2.</strong>371<br />
168 N-I 416,4 Beasain 2<strong>2.</strong>086<br />
31 A N-634 - Zorrotza – Basurto 21.908<br />
19 A N-634 115,5 Basurto – Kastrexana 21.908<br />
274 A-8 52 Zestoa / Itziar 21.698<br />
230 N-I 387,5 ETD 5 – Egino 21.543<br />
100 N-622 12,9 Letona 21.478<br />
281 A-8 4 Behobia / Ventas Irun 21.367<br />
220 N-I 382,7 Urabain 21.118<br />
265 A-8 20 Barrera Este 20.800<br />
89 GI-627 39,4 Cruce <strong>de</strong> San Pru<strong>de</strong>ntzio 20.727<br />
273 A-8 60 Itziar / Elgoibar 20.661<br />
114 A N-634 79,2 Durango – Matiena 20.546<br />
88 A BI-634 20,9 Larrabasterra – Sope<strong>la</strong>na 20.516<br />
119 GI-2132 0,0 Ga<strong>la</strong>rreta 20.391<br />
55 C BI-636 - Solución Sur (A-8) – Kastrexana 20.331<br />
11 N-634 61,5 Eibar 20.300<br />
180 B Acceso A-8 - E. Santurtzi – Kabietzes 20.189<br />
200 N-I 378,7 Salvatierra o Agurain 20.129<br />
- A-8 87,4 Iurreta – Zaldibar 20.027<br />
191<br />
Revisión <strong>de</strong>l Segundo P<strong>la</strong>n General <strong>de</strong> Carreteras <strong>de</strong>l País Vasco
Estación Carretera P.K. Localidad más próxima IMD<br />
IMD entre 10.000 vehículos / día y 20.000 vehículos / día<br />
1 B BI-631 - Ibarsusi – Santo Domingo 19.934<br />
251 A-8 69,5 Eibar – Elgoibar 19.915<br />
280 A-8 7 Ventas <strong>de</strong> Irun / Irun 19.816<br />
272 A-8 66 Elgoibar / Azitain 19.688<br />
102 N-I 479,9 Behobia 19.614<br />
70 N-I 359,8 Lubiano 19.548<br />
2 A N-634 108,1 Ibarsusi – Bolueta 19.339<br />
46 N-634 57,9 Sigma (Elgoibar) 19.335<br />
258 Acceso N-I 0,7 Puente <strong>de</strong> Santiago 19.264<br />
155 A BI-625 383,6 Moyordín - E. Arrigorriaga 19.105<br />
271 A-8 72 Azitain / Ermua 18.972<br />
36 A N-634 119,7 Ugarte – Retuerto 18.945<br />
79 GI-131 10,7 Astigarraga 18.800<br />
56 A BI-636 - Alonsotegi – Zaramillo 18.726<br />
9359 N-636 9,3 Cruce <strong>de</strong> Ezkio 18.678<br />
47 N-634 66 Eibar (Muga) 18.659<br />
110 B N-637 - Erletxe – Larrabetzu 18.362<br />
106 N-634 59,9 Puente bajo autopista 18.122<br />
127 GI-627 40,4 San Pru<strong>de</strong>ntzio 18.081<br />
56 B BI-636 - Zaramillo - La Cuadra 17.927<br />
156 A BI-625 - BI-712 - Ugao (Miraballes) 17.822<br />
44 B Acceso N-637 - E. Barakaldo (Barakaldo – BI) 17.729<br />
57 A BI-636 13,8 La Cuadra – Sodupe 17.715<br />
257 A-8 A 0 Puente <strong>de</strong> Behobia 17.690<br />
81 GI-131 13,5 Donostia (Loio<strong>la</strong>) 17.574<br />
79 A BI-604 - Asua – E. Kuku<strong>la</strong>rra 17.438<br />
118 A N-637 22,6 Zamudio – Lezama 17.407<br />
157 A BI-625 380,6 Arrigorriaga - Miraballes (Ugao) 17.019<br />
69 GI-131 9 Parada Bus Carabel 16.952<br />
87 N-636 7 Cruce <strong>de</strong> Ezkio 16.800<br />
164 A N-240 - Bedia – Lemoa 16.572<br />
170 N-636 4 Ormaiztegi 16.530<br />
158 GI-631 15,9 Loyo<strong>la</strong> 16.438<br />
Estación Carretera P.K. Localidad más próxima IMD<br />
126 A BI-635 34,6 Vista Alegre – Gernika 16.396<br />
117 D N-634 65,7 Ermua - L.P. Gipuzkoa 16.312<br />
44 A Acceso N-637 - E. Barakaldo (BI – Barakaldo) 16.284<br />
- AP-1 - Intercambio <strong>de</strong> Miranda – Armiñón 16.281<br />
35 A N-634 118,9 Retuerto – Cruces 15.974<br />
120 GI-131 5,6 Urnieta 15.671<br />
118 B N-637 - Lezama - Vte. Larrabetzu 15.656<br />
35 GI-131 10,6 Astigar - C. Garziateg 15.454<br />
10169 N-636 2,1 Ormaiztegi 15.375<br />
181 B N-644 - A-8 – Puerto Santurtzi 15.310<br />
180 N-I 321,7 Límite Miranda <strong>de</strong> Ebro 15.024<br />
282 A-8 0,3 Behobia / Francia 14.932<br />
5 A N-634 - Miraflores – Arenal 14.865<br />
134 N-I5 147,8 Túnel <strong>de</strong> Be<strong>la</strong>bieta 14.759<br />
121 N-I 325,5 Puente Nuevo 14.467<br />
36 B N-634 - Ugarte – Zabal<strong>la</strong> 14.453<br />
40 A N-634 127,1 El Casal – Nocedal 14.378<br />
- AP-68 - Altube – Subijana 14.220<br />
- AP-68 - Subijana – AP-1 14.181<br />
40 C N-634 128,8 El Casal - Las Carreras 13.823<br />
176 A N-636 - Apatamonasterio - Vte. Elorrio 13.791<br />
165 A N-240 20,6 Lemoa – Igorre 13.751<br />
175 A N-636 35,1 Abadiño – Apatamonasterio 13.696<br />
102 N-622 23,3 ETD 2 - Peaje AP-68 Altube 13.299<br />
41 A N-634 - Muskiz – Las Carreras 13.243<br />
68 GI-131 2 Andoain - A. Irurain 13.193<br />
9113 GI-627 49,2 Meko<strong>la</strong>l<strong>de</strong> 13.144<br />
53 GI-2620 22,2 Arrasate / Mondragón 13.122<br />
111 B BI-635 - Amorebieta – Zugaztieta 13.090<br />
125 A BI-635 - Zugaztieta – Vista Alegre 13.078<br />
111 N-240 15 Legutiano 13.038<br />
256 N-I 481,5 Behobia 1<strong>2.</strong>980<br />
124 A BI-635 - E. Amorebieta – Zugaztieta 1<strong>2.</strong>948<br />
115 A N-634 - Matiena – O<strong>la</strong>kueta 1<strong>2.</strong>876<br />
192<br />
Revisión <strong>de</strong>l Segundo P<strong>la</strong>n General <strong>de</strong> Carreteras <strong>de</strong>l País Vasco
Estación Carretera P.K. Localidad más próxima IMD<br />
1070 A-625 371 Llodio (Bilbao) 1<strong>2.</strong>772<br />
158 B BI-625 - E. Areta Norte – Areta 1<strong>2.</strong>617<br />
30 N-I 404,4 Puerto <strong>de</strong> Etxegarate 1<strong>2.</strong>569<br />
9211 GI-627 52,3<br />
Antes entrada variante a Soraluze / P<strong>la</strong>cencia<br />
<strong>de</strong> Armas<br />
1<strong>2.</strong>563<br />
160 A BI-625 - Laudio – Luxaondo 1<strong>2.</strong>538<br />
59 A BI-636 - Artxube – L<strong>la</strong>ntada 1<strong>2.</strong>297<br />
79 C BI-2704 8,4 Asua – Loiu 1<strong>2.</strong>139<br />
91 A BI-2704 - Asua – Loiu 1<strong>2.</strong>139<br />
128 N-638 0,2 Hondarribia 1<strong>2.</strong>101<br />
157 C BI-625 - Miraballes (Ugao) – Arrankudiaga 1<strong>2.</strong>078<br />
174 A N-636 - Durango – Abadiño 11.973<br />
44 D Acceso N-637 - E. Barakaldo (Rontegi – Barakaldo) 11.969<br />
9259 GI-2630 0,3 Urretxu 11.801<br />
1071 A-625 369 Llodio (Amurrio) 11.773<br />
58 GI-631 12,2 Azpeitia (Gasolinera) 11.746<br />
123 N-634 29,6 Salida hacía Okina 11.724<br />
119 A N-637 27,3 Vte. Larrabetzu 11.658<br />
44 C N-637 - E. Barakaldo (Barakaldo – Rontegi) 11.533<br />
11 N-104 355,5 Arkaute 11.484<br />
15 N-636 22,6 Salida hacia Deskarga 11.449<br />
1060 A-625 360,2 Amurrio (Llodio) 11.395<br />
37 N-634 7,6 Aginaga 10.979<br />
158 A BI-625 - Arrankudiaga - E. Areta Norte 10.956<br />
114 B BI-633 - Matiena – Bi<strong>de</strong>barrieta (Berriz) 10.920<br />
88 C BI-2122 - Sope<strong>la</strong>na - Barrika 10.673<br />
45 N-634 54,4 Salida <strong>de</strong> Altzo<strong>la</strong> 10.548<br />
9157 GI-631 3,8 Cruce <strong>de</strong> <strong>la</strong> Variante 10.525<br />
143 A BI-633 - Ormaiztegi – Bi<strong>de</strong>barrieta 10.461<br />
80 C N-633 - BI-631 – Aeropuerto 10.382<br />
38 A N-634 - Trapagarán – Ortuel<strong>la</strong> 10.376<br />
56 GI-2630 23,6 Cruce <strong>de</strong> San Pru<strong>de</strong>ntzio 10.254<br />
590 N-124 35,2 Salinil<strong>la</strong>s <strong>de</strong> Buradón 10.205<br />
161 A BI-625 - Luxaondo – Amurrio 10.132<br />
Estación Carretera P.K. Localidad más próxima IMD<br />
55 N-634 29,9 Arrona 10.131<br />
88 B BI-634 - Sope<strong>la</strong>na – Urduliz 10.131<br />
122 N-124 26,5 Cadiñanos 10.083<br />
115 D N-634 73,6 O<strong>la</strong>kueta – Zaldibar 10.066<br />
IMD entre 5.000 vehículos / día y 10.000 vehículos / día<br />
37 A N-634 122,2 Trapagarán - San Andrés 9.998<br />
126 C BI-2235 - Gernika – Murueta 9.971<br />
592 N-124 30,7 Zambrana 9.935<br />
92 GI-2132 9,1 Benta – Astigarraga Perurena 9.866<br />
112 GI-627 33,2 Fagor (Mondragón) 9.649<br />
9159 N-636 3 Alto <strong>de</strong> Deskarga 9.547<br />
57 C BI-636 - Sodupe – Artxube 9.473<br />
122 N-634 21,4 Getaria - Casa Caminer 9.469<br />
259 GI-131 8 Variante <strong>de</strong> Hernani 9.425<br />
165 C N-240 - Igorre – Arantzazu 9.392<br />
9213 N-636 19,7 Salida a Deskarga 9.104<br />
166 A N-240 - Arantzazu - Bildoso<strong>la</strong> (BI-3530) 9.025<br />
171 A BI-623 - Durango – Izurtza 9.008<br />
266 Acceso A-8 0 Zarautz Este 8.906<br />
1051 A-627 13,1 Urbina 8.834<br />
51 GI-627 19 Alto <strong>de</strong> Ar<strong>la</strong>bán 8.763<br />
39 A N-634 - Nocedal – Ortuel<strong>la</strong> 8.752<br />
172 A BI-623 31,1 Izurtza – Mañaria 8.706<br />
147 B BI-633 - Iruzubieta – Vte. Markina 8.627<br />
1050 A-627 17,7 Landa 8.580<br />
145 C BI-633 - Iruzubieta – Vte. Markina 8.374<br />
60 A BI-636 - L<strong>la</strong>ntada - Balmaseda N. 8.290<br />
127 A BI-2238 - Gernika – Kortezubi 8.205<br />
101 D BI-631 - Mungia – Larrauri 8.152<br />
128 A BI-2235 - Gernika – Murueta 8.136<br />
101 E BI-2121 - Mungia – Soietxe 8.120<br />
268 Acceso A-8 11,5 Oiartzun – Oeste 8.045<br />
- AP-68 - AP-1 – Miranda <strong>de</strong> Ebro 8.012<br />
490 A-2126 59,1 Oyón (L.P. Logroño) 8.003<br />
193<br />
Revisión <strong>de</strong>l Segundo P<strong>la</strong>n General <strong>de</strong> Carreteras <strong>de</strong>l País Vasco
Estación Carretera P.K. Localidad más próxima IMD<br />
147 A BI-633 - Vte. Markina – Urberuaga 7.992<br />
117 A N-634 - Areitio – Ermua 7.963<br />
130 B BI-2235 - Mundaka – Bermeo 7.810<br />
164 B BI-635 - Lemoa – Amorebieta 7.776<br />
143 C BI-633 35,1 Bi<strong>de</strong>barrieta – Gomezeaga 7.660<br />
95 B BI-634 - Gatika – Mungia 7.641<br />
101 B BI-634 - Mungia – Gatika 7.641<br />
9312 GI-2130 1,7 Ibarra – F. Casa Montes 7.569<br />
149 A BI-633 - Berriatua – Ondarroa 7.561<br />
94 B BI-634 - Urduliz – Elortza 7.522<br />
131 A BI-2238 - Kortezubi – Gauzteiz 7.485<br />
128 B BI-2235 - Murueta – Busturia 7.450<br />
9210 GI-631 0,2 Cruce <strong>de</strong> Arieta 7.433<br />
129 A BI-2235 - Busturia – Sukarrieta 7.417<br />
104 B BI-2235 - Bermeo – Mundaka 7.395<br />
116 A N-634 70,1 Zaldibar – Areitio 7.368<br />
54 N-636 34,7 Alto Kanpazar 7.323<br />
130 A BI-2235 - Sukarrieta – Mundaka 7.280<br />
40 N-634 24,7 Getaria 7.192<br />
145 A BI-633 - Arrangizgana – Iruzubieta 7.030<br />
89 A BI-2122 - Barrika - Plentzia 6.862<br />
102 A BI-631 - Larrauri – Int. BI-3101 6.821<br />
148 A BI-633 - Urberuaga – P<strong>la</strong>zako<strong>la</strong> 6.796<br />
144 A BI-633 - Gomezeaga – Pto. Trabakua 6.740<br />
93 GI-2132 10,2 Benta – Astigarraga 6.716<br />
61 C BI-636 - La Pinil<strong>la</strong> – Vil<strong>la</strong>sana 6.691<br />
149 C BI-638 - Ondarroa – L.P. (Deba) 6.601<br />
50 GI-638 7,2 Saturrarán 6.452<br />
43 N-634 45,4 Deba 6.408<br />
159 A BI-2522 - Areta – E. Areta Sur 6.392<br />
92 A BI-2704 - Loiu – Unbe 6.381<br />
176 C N-636 - Elorrio O. - L.P. (Pto. Kanpazar) 6.344<br />
148 C BI-633 - P<strong>la</strong>zako<strong>la</strong> – Berriatua 6.269<br />
41 C BI-2701 - Muskiz – El Arenao 6.201<br />
Estación Carretera P.K. Localidad más próxima IMD<br />
350 N-104 358,8 Matauco 6.193<br />
166 B N-240 - Int. BI-3530 – Zeanuri 6.126<br />
9314 GI-2120 63,4 Variante <strong>de</strong> Lazkao 6.075<br />
263 A-8 (peaje) 48,8 Peaje <strong>de</strong> Zestoa 6.056<br />
670 A-2622 12,5 Nanc<strong>la</strong>res <strong>de</strong> Oka 6.001<br />
67 A BI-2701 - Muskiz – El Arenao 5.908<br />
168 A N-240 - Int. BI-3530 – Zeanuri 5.906<br />
176 E N-636 - Vte. Elorrio - E. Elorrio 5.769<br />
177 C BI-2522 - E. Areta Sur – Orozko 5.762<br />
267 Acceso A-8 14,9 Pasaia – Oeste 5.759<br />
131 GI-2634 33,7 Túnel <strong>de</strong> Azkarateko 5.655<br />
1064 A-625 360 Circunva<strong>la</strong>ción <strong>de</strong> Amurrio 5.637<br />
791 A-2522 47,0 Llodio (Orozco) 5.601<br />
260 A-8 (peaje) 70,9 Peaje <strong>de</strong> Eibar 5.599<br />
147 C BI-633 - Vte. Markina 5.582<br />
105 N-634 31,1 Cruce <strong>de</strong> Iraeta 5.476<br />
94 GI-2620 19,0 Arrasate / Mondragón 5.458<br />
261 A-8 (peaje) 64,4 Peaje <strong>de</strong> Elgoibar 5.363<br />
93 A BI-2704 13,1 Unbe – Alto Unbe 5.356<br />
117 C BI-2301 - Ermua - Arrangizgana 5.340<br />
94 C BI-634 - Elortza – Butroe 5.271<br />
89 B BI-2704 - Plentzia – Elorza (Urduliz) 5.231<br />
49 GI-638 3,5 Entrada Mutriku 5.218<br />
142 C BI-2405 - Oleta – Lekeito 5.178<br />
142 B BI-2405 - Oleta – Amoroto 5.165<br />
57 B BI-2604 - Sodupe – Padura 5.096<br />
68 A BI-2701 - El Arenao – Merkadillo (Sopuerta) 5.051<br />
176 F N-636 - E. Elorrio – Elorrio 5.032<br />
168 C N-240 - Zeanuri – Barazar 5.029<br />
IMD entre <strong>2.</strong>000 vehículos / día y 5.000 vehículos / día<br />
91 GI-638 1,3 Deba 4.976<br />
61 A BI-636 - Balmaseda - La Pinil<strong>la</strong> 4.972<br />
134 B BI-2405 - Lekeito – Oleta 4.855<br />
93 C BI-2704 - Alto Unbe – BI-3724 (Ugeraga) 4.673<br />
194<br />
Revisión <strong>de</strong>l Segundo P<strong>la</strong>n General <strong>de</strong> Carreteras <strong>de</strong>l País Vasco
Estación Carretera P.K. Localidad más próxima IMD<br />
54 C N-639 - La Cuesta - El Casal 4.620<br />
12 N-I32 4,9 Ascarza 4.558<br />
172 B BI-623 - Mañaria – Urkio<strong>la</strong> 4.534<br />
123 A BI-2121 - Mungia – Soietxe 4.500<br />
103 A BI-631 - Larrauri - Sollube 4.500<br />
104 A BI-631 - Sollube – Bermeo 4.471<br />
169 A N-240 - Barazar – Zubizabal 4.449<br />
162 A BI-625 - Amurrio – Orduña 4.329<br />
41 N-634 34,4 Itziar (Chatarreria) 4.312<br />
169 B N-240 40,5 Zubizabal - L.P. (Ubi<strong>de</strong>a) 4.295<br />
310 A-623 18,3 Límite Otxandio 4.278<br />
42 A N-634 136,1 Muskiz - L.P. Cantabria 4.259<br />
300 N-240 21,5 Ubi<strong>de</strong>a 4.230<br />
39 GI-2633 4,1 Meaga Gaina 4.188<br />
640 A-2124 3,7 Castillo 4.180<br />
94 A BI-2704 - BI-3724 – Elortza (Urduliz) 4.175<br />
59 GI-631 31,5 Cruce <strong>de</strong> Agiñeta 4.159<br />
161 B BI-625 - Amurrio – Vitoria-Gasteiz 4.115<br />
95 A BI-634 - Butroe – Gatika 4.110<br />
821 A-624 30,9 Cruce <strong>de</strong> Urquillo 4.042<br />
1200 N-I32 8,7 Andollu 4.031<br />
1170 A-2122 34,7 Zubil<strong>la</strong>ga 4.016<br />
72 A BI-2604 - Gor<strong>de</strong>xo<strong>la</strong> – Padua(Sodupe) 4.016<br />
155 C Acceso AP-68 - Salida <strong>de</strong> AP-68 (BI-625) 3.864<br />
146 A BI-2636 - Etxebarria – Markina 3.841<br />
173 B BI-623 - Otxandio - L.P. (Á<strong>la</strong>va) 3.836<br />
125 GI-631 20,8 Azkoitia 3.835<br />
62 A-2134 7,9 Zurbano 3.822<br />
155 B Acceso AP-68 - Entrada a AP-68 (BI-625) 3.817<br />
9212 GI-2135 61,5 B. Amorós – P. Araxes 3.779<br />
1063 A-625 358,2 Amurrio 3.766<br />
173 A BI-623 - Urkio<strong>la</strong> – Otxandio 3.715<br />
82 GI-2630 14,6 Salida hacia Udana 3.712<br />
97 GI-2120 62,0 Puente Nuevo Ataun 3.702<br />
Estación Carretera P.K. Localidad más próxima IMD<br />
1061 A-625 356 Saratxo 3.613<br />
123 C BI-2121 - Soetxe – Fruiz 3.596<br />
148 B BI-2405 - P<strong>la</strong>zako<strong>la</strong> – Oleta 3.576<br />
133 N-636 33,9 Epele – Kanpazar 3.556<br />
125 B BI-2121 - Vista Alegre – Muxika 3.522<br />
160 A-2124 9,5 Puerto Vitoria 3.493<br />
69 A BI-2701 - Merkadillo – El Carral 3.487<br />
62 B BI-2701 - Ma<strong>la</strong>brigo – Reto<strong>la</strong> 3.473<br />
500 N-124 75,5 Laserna 3.461<br />
264 Acceso A-8 38,2 Zarautz Oeste 3.396<br />
150 N-I32 22,3 Azatzeta 3.387<br />
70 B BI-2701 - Reto<strong>la</strong> – Ma<strong>la</strong>brigo 3.372<br />
161 C BI-624 - Amurrio - Artziniega 3.335<br />
134 A BI-2238 - Tres Cruces – Lekeito 3.261<br />
170 A-2130 5,0 Otazu 3.184<br />
13 GI-627 0 Altos Hornos <strong>de</strong> Bergara 3.142<br />
120 A BI-2713 - Larrabetzu – Astorezka 3.118<br />
910 A-624 45,7 Respaldiza 3.065<br />
70 A BI-2701 - Avel<strong>la</strong>neda – Reto<strong>la</strong> 3.044<br />
820 A-624 25 Altube 3.042<br />
60 GI-2634 5,7 Beizamako Bi<strong>de</strong>g. 3.024<br />
262 A-8 (peaje) 54,6 Peaje <strong>de</strong> Itziar <strong>2.</strong>975<br />
450 A-2620 31,5 Ibarra <strong>de</strong> Aramaio <strong>2.</strong>919<br />
850 A-2604 55,5 Artziniega <strong>2.</strong>862<br />
69 C BI-2701 - El Carral – Avel<strong>la</strong>neda <strong>2.</strong>836<br />
72 C BI-2604 - Gor<strong>de</strong>xo<strong>la</strong> – L.P. (Artziniega) <strong>2.</strong>834<br />
770 A-624 40 Larrimbe <strong>2.</strong>789<br />
1062 A-624 42,9 Amurrio <strong>2.</strong>762<br />
88 GI-2630 8,5 Alto <strong>de</strong> Udana <strong>2.</strong>662<br />
420 N-I32 34,5 Antoñana <strong>2.</strong>654<br />
54 B N-639 - Zierbana - El Puerto (Zierbana) <strong>2.</strong>621<br />
127 C BI-2224 - Gernika – Uarka <strong>2.</strong>517<br />
510 N-124 61,1 Páganos <strong>2.</strong>508<br />
830 A-2521 23,8 Beluntza <strong>2.</strong>503<br />
195<br />
Revisión <strong>de</strong>l Segundo P<strong>la</strong>n General <strong>de</strong> Carreteras <strong>de</strong>l País Vasco
Estación Carretera P.K. Localidad más próxima IMD<br />
165 B BI-2543 - Igorre – Dima <strong>2.</strong>446<br />
48 GI-2135 59,1 Pasada recta Txamara <strong>2.</strong>410<br />
170 A BI-2543 - Igorre – Dima <strong>2.</strong>377<br />
121 B BI-2121 - Alto <strong>de</strong> Morga – Muxika <strong>2.</strong>315<br />
177 A BI-2522 - Orozko – L.P. (Ziorraga) <strong>2.</strong>310<br />
122 A BI-2121 - Fruiz – Errigoitiolea <strong>2.</strong>293<br />
430 N-132 41,5 Sta. Cruz (Límite Navarra) <strong>2.</strong>273<br />
680 A-2622 16,5 Montevite <strong>2.</strong>265<br />
9258 GI-2634 22,9 Bidaniako Bi<strong>de</strong>g. <strong>2.</strong>239<br />
62 A BI-630 - Balmaseda – Ma<strong>la</strong>brigo <strong>2.</strong>229<br />
62 C BI-630 - Ma<strong>la</strong>brigo – Herbosa <strong>2.</strong>202<br />
131 C BI-2238 - Gauztegiz – Atxoste (Muruetagana) <strong>2.</strong>103<br />
911 A-624 49 Menagaray <strong>2.</strong>072<br />
520 N-124 52,8 Ábalos <strong>2.</strong>059<br />
52 GI-627 22,3 Puerto <strong>de</strong> Ar<strong>la</strong>bán <strong>2.</strong>058<br />
132 A BI-2238 - Atxoste – Basetxea <strong>2.</strong>051<br />
64 A BI-630 - Artzentales – Turtzioz <strong>2.</strong>049<br />
65 A BI-630 - Turtzioz – Ambasaguas <strong>2.</strong>038<br />
IMD inferior a <strong>2.</strong>000 vehículos / día<br />
580 N-24 42,5 Labastida 1.964<br />
95 GI-2620 16,6 Santa Ageda 1.926<br />
790 A-2522 36,6 Ziorraga 1.922<br />
75 GI-2130 8,6 Salida <strong>de</strong> Elduain 1.894<br />
63 A BI-630 35,0 Herbosa – Artzentales 1.833<br />
132 GI-2130 11,8 Caserío Sabiñone 1.831<br />
920 A-2122 42,8 Puente<strong>la</strong>rrá 1.794<br />
800 A-2522 34,3 Baranbio 1.709<br />
122 B BI-2121 - Errigoitiolea – Morga 1.689<br />
900 A-2604 1 Gordéliz (Artziniega) 1.634<br />
922 A-2625 321 Bergüenda 1.622<br />
270 Acceso A-8 6,7 Ventas <strong>de</strong> Irun 1.552<br />
121 A BI-2121 - Morga – Alto <strong>de</strong> Morga 1.546<br />
133 A BI-2238 - Basetxea – Tres Cruces 1.511<br />
65 B BI-630 - Ambasaguas - L.P. (Ramales) 1.482<br />
Estación Carretera P.K. Localidad más próxima IMD<br />
662 N-126 18,5 Añastro (Condado <strong>de</strong> Treviño) 1.417<br />
66 C N-629 - Lanestosa – L.P. (Ramales) 1.361<br />
120 C BI-2713 - Astoreka – Alto Morga 1.278<br />
841 N-624 8,5 Foronda 1.267<br />
83 GI-2636 1,9 Elgoibar 1.261<br />
480 A-2126 53,5 Yécora 1.247<br />
145 B BI-2224 - Bolívar – Iruzubieta 1.234<br />
64 B BI-2617 - Turtioz – L.P. Cantabria 1.203<br />
66 B N-629 - Lanestosa – L.P. (Bercedo) 1.155<br />
721 A-2625 346,2 Puerto Orduña 1.136<br />
700 A-2622 22,8 Paúl 1.126<br />
720 A-2625 334,8 Osma 1.048<br />
162 B BI-2625 - Orduña – L.P. Burgos 1.044<br />
20 B Acceso A-8 - Kastrena – A-8 1.022<br />
380 A-2128 27,3 Opacua 980<br />
630 A-2124 15,8 Peñacerrada (a Vitoria) 904<br />
61 GI-2634 14,4 Errezilgo Irteera 901<br />
740 A-2622 40 Guren<strong>de</strong>s 891<br />
921 A-2122 47,3 Sobrón 875<br />
1210 A-2622 33,5 Tuesta 871<br />
902 A-2604 4,5 Gordéliz (Peña Angulo) 864<br />
440 N-126 39 Genevil<strong>la</strong> 848<br />
540 A-2124 26 Puerto Herrera 847<br />
146 A BI-2636 - L.P. (Elgoibar) – Etxebarria 805<br />
320 A-2620 17,3 Puerto Cruceta 774<br />
760 A-2521 30 Unzá 773<br />
64 GI-2120 49,2 Alto <strong>de</strong> Lizarrusti 761<br />
140 A BI-2224 - Ibartxu – Arbatzegi 740<br />
923 A-2625 318,9 Puente<strong>la</strong>rrá 709<br />
462 N-126 36 Navarrete 691<br />
61 B BI-624 - La Pinil<strong>la</strong> - Artziniega 671<br />
390 A-2128 38 Puerto Opacua 636<br />
140 C BI-2224 - Arbatzegi – Bolibar 626<br />
173 C BI-2543 - Dima – Otxandio 539<br />
196<br />
Revisión <strong>de</strong>l Segundo P<strong>la</strong>n General <strong>de</strong> Carreteras <strong>de</strong>l País Vasco
Estación Carretera P.K. Localidad más próxima IMD<br />
471 N-126 39,5 Bernedo (Límite Navarra) 446<br />
903 A-624 57 Artziniega (Balmaseda) 443<br />
470 A-2126 42 Puerto Bernedo 344<br />
400 A-2128 55,8 Contrasta 333<br />
432 A-2128 39,4 Santa Cruz 311<br />
750 A-2622 51,5 Tobil<strong>la</strong>s 262<br />
722 A-2625 34 Cárcamo 228<br />
473 N-126 41,8 Angostina 219<br />
Fuente: E<strong>la</strong>boración propia a partir <strong>de</strong> los datos <strong>de</strong> <strong>la</strong>s Diputaciones Forales <strong>de</strong> Á<strong>la</strong>va, Gipuzkoa y Bizkaia.<br />
Nota: Las estaciones <strong>de</strong> aforo tipo ETD en Á<strong>la</strong>va, son estaciones <strong>de</strong>nominadas “Estaciones <strong>de</strong> Toma <strong>de</strong> Datos”,<br />
correspondiendo <strong>la</strong> recopi<strong>la</strong>ción <strong>de</strong> los datos a <strong>la</strong> Jefatura <strong>de</strong> Tráfico.<br />
Al analizar <strong>la</strong> tab<strong>la</strong> anterior, <strong>la</strong>s conclusiones obtenidas son <strong>la</strong>s que se enuncian a continuación:<br />
√ Las carreteras que registran los mayores tráficos <strong>de</strong> todo el País Vasco, superando los 80.000<br />
vehículos / día son <strong>de</strong> <strong>la</strong> Red <strong>de</strong> Interés Preferente, <strong>la</strong> Autopista A-8 (Autopista <strong>de</strong>l Cantábrico) a su paso<br />
por dos <strong>de</strong> <strong>la</strong>s tres capitales vascas (Bilbao y Donostia-San Sebastián), don<strong>de</strong> se superan incluso los<br />
100.000 vehículos / día, y <strong>la</strong> carretera nacional N-637 (Cor<strong>red</strong>or Rontegi). De <strong>la</strong> Red Básica, una única<br />
carretera supera este valor <strong>de</strong> IMD, es <strong>la</strong> BI-637 (en Bilbao Metropolitano), continuación <strong>de</strong>l Cor<strong>red</strong>or<br />
Rontegi hasta <strong>la</strong> localidad <strong>de</strong> Leioa.<br />
√ Entre 80.000 vehículos / día y 40.000 vehículos / día, a<strong>de</strong>más <strong>de</strong> <strong>la</strong>s tres carreteras citadas<br />
anteriormente, se encuentran <strong>de</strong> <strong>la</strong> Red <strong>de</strong> Interés Preferente, <strong>la</strong> Autovía <strong>de</strong>l Norte N-I y <strong>la</strong> carretera<br />
nacional N-634 (Donostia-San Sebastián – Santan<strong>de</strong>r – A Coruña). De estas dos carreteras, los tramos<br />
que tienen una IMD en el intervalo mencionado, son los correspondientes al Bilbao Metropolitano, al<br />
entorno <strong>de</strong> Donostia-San Sebastián y a <strong>la</strong>s proximida<strong>de</strong>s <strong>de</strong> Andoain.<br />
√ El tercer grupo consi<strong>de</strong>rado, es aquél cuya IMD varía entre 40.000 vehículos / día y 20.000 vehículos /<br />
día. Con más <strong>de</strong> 30.000 vehículos / día están <strong>la</strong>s carreteras <strong>de</strong> <strong>la</strong> Red <strong>de</strong> Interés Preferente N-I, N-634,<br />
A-8, AP-68, N-633 y N-62<strong>2.</strong> En el caso <strong>de</strong> <strong>la</strong> Autovía <strong>de</strong>l Norte N-I los tramos con más <strong>de</strong> 30.000<br />
vehículos / día comprendidos en este grupo, son los localizados entorno a Donostia-San Sebastián (cerca<br />
<strong>de</strong> Errenteria, Irun y Lasarte / Oria) y también en <strong>la</strong>s proximida<strong>de</strong>s <strong>de</strong> Beasain (en Itsasondo). En el caso<br />
<strong>de</strong> <strong>la</strong> carretera N-634 a su paso por Bilbao. En <strong>la</strong> Autopista A-8 en Irun y entre Basauri y Amorebieta /<br />
Etxano. En <strong>la</strong> Autopista <strong>de</strong> Peaje Vasco Aragonesa AP-68 entre Ugao / Miraballes y Murueta y por último<br />
en <strong>la</strong> carretera N-622 (Vitoria-Gasteiz – A-8) a su paso por Etxebarri.<br />
Y con más <strong>de</strong> 30.000 vehículos / día pero en <strong>la</strong>s carreteras <strong>de</strong> <strong>la</strong> Red Básica se sitúan tramos <strong>de</strong> <strong>la</strong>s<br />
carreteras BI-631 y BI-604 (a su paso por Bilbao Metropolitano), y <strong>de</strong> <strong>la</strong>s carreteras BI-637 y BI-634<br />
(entre Bilbao y Sope<strong>la</strong>na).<br />
Con menos <strong>de</strong> 30.000 vehículos / día, se encuentran tanto carreteras <strong>de</strong> <strong>la</strong> Red <strong>de</strong> Interés Preferente,<br />
como <strong>de</strong> <strong>la</strong> Red Básica y <strong>de</strong> <strong>la</strong> Red Comarcal. Son <strong>la</strong> N-I, A-8, AP-68, N-634, N-637, N-638 (que da<br />
acceso al Aeropuerto <strong>de</strong> Hondarribia), N-622, N-240 (<strong>de</strong> Lemoa al Límite <strong>de</strong>l Territorio Histórico <strong>de</strong><br />
Á<strong>la</strong>va) <strong>de</strong> <strong>la</strong> Red <strong>de</strong> Interés Preferente. Las carreteras BI-604 (Bilbao – Asua), BI-625 (Areta – Bilbao),<br />
BI-636 (Bilbao – Balmaseda), BI-631 (Bermeo – A-8), y <strong>la</strong> GI-627 (<strong>de</strong> Eibar al Límite <strong>de</strong>l Territorio<br />
Histórico <strong>de</strong> Á<strong>la</strong>va) <strong>de</strong> <strong>la</strong> Red Básica y <strong>la</strong> carretera GI-2132 (Astigarraga – Errenteria) en torno a <strong>la</strong><br />
capital Guipuzcoana <strong>de</strong> <strong>la</strong> Red Comarcal.<br />
√ Finalmente, se consi<strong>de</strong>ra el último grupo <strong>de</strong> flujos <strong>de</strong> tráfico, aquellos con una IMD inferior a los <strong>2.</strong>000<br />
vehículos / día. Se observa que son una minoría, pues tan sólo se incluyen el 12% <strong>de</strong> <strong>la</strong>s estaciones <strong>de</strong><br />
aforo <strong>de</strong> todas <strong>la</strong>s consi<strong>de</strong>radas en <strong>la</strong> Red Funcional (cincuenta y siete <strong>de</strong> <strong>la</strong>s cuatrocientas setenta y tres<br />
<strong>de</strong> <strong>la</strong>s que se disponen <strong>de</strong> datos <strong>de</strong> tráfico en el año 2002). Correspon<strong>de</strong>n estas estaciones a <strong>la</strong>s<br />
carreteras <strong>de</strong> <strong>la</strong> Red <strong>de</strong> Interés Preferente N-624 (carretera <strong>de</strong> acceso al Aeropuerto <strong>de</strong> Foronda en<br />
Vitoria-Gasteiz) y N-629 (en su pequeño tramo a su paso por el Término Municipal <strong>de</strong> Lanestosa, al Oeste<br />
en el Territorio Histórico <strong>de</strong> Bizkaia).<br />
De <strong>la</strong> Red Básica se encuentran con una IMD por <strong>de</strong>bajo <strong>de</strong> este valor <strong>la</strong>s carreteras BI-630<br />
(Balmaseda – Carranza) en Arzentales y en el límite con <strong>la</strong> provincia <strong>de</strong> Cantabria y <strong>la</strong> BI-624 (Altube<br />
– Balmaseda) en Balmaseda <strong>de</strong>l Territorio Histórico <strong>de</strong> Bizkaia. Del Territorio Histórico <strong>de</strong> Á<strong>la</strong>va, <strong>la</strong>s<br />
carreteras N-124 (<strong>de</strong> Briñas a Logroño por Laguardia) en <strong>la</strong> localidad <strong>de</strong> <strong>la</strong> Labastida, A-624 (Altube -<br />
Balmaseda) en Balmaseda y <strong>la</strong> N-126 (<strong>de</strong>l límite con Navarra al límite con el condado <strong>de</strong> Treviño).<br />
Por último, <strong>de</strong> <strong>la</strong> Red Comarcal <strong>la</strong>s carreteras que en algunos <strong>de</strong> sus tramos tienen una IMD menor a<br />
<strong>2.</strong>000 vehículos / día son: GI-2636 (Elgoibar – Límite con Bizkaia por el Alto <strong>de</strong> San Miguel), GI-2620<br />
(Arrasate / Mondragón – Límite con Á<strong>la</strong>va) y GI-2130 (Tolosa – Límite con Navarra por el puerto <strong>de</strong><br />
Urto) en Gipuzkoa, BI-2713 (Larrabetzu – Alto <strong>de</strong> Gerekiz), BI-2636 (Elgoibar – Límite con Gipuzkoa),<br />
BI-2617 (Vil<strong>la</strong>ver<strong>de</strong> <strong>de</strong> Trucios - Agüera), BI-2543 (Igorre - Otxandio por Dima), BI-2238 (Gernika-<br />
Lumo - Lekeito), BI-2224 (Gernika-Lumo - Markina / Xemein), BI-2121 (Mungia - Ugarte / Muxika) y<br />
BI-2625 (Pancorbo – Orduña) en Bizkaia y A-2625 (Bergüenda – Orduña), A-2622 (Nanc<strong>la</strong>res <strong>de</strong> Oka<br />
– Límite con Burgos), A-2620 (Legutiano – Arrasate / Mondragón), A-2604 (Gor<strong>de</strong>liz – Límite con<br />
Bizkaia), A-2522 (Ziorraga – Límite con Bizkaia), A-2521 (Altube – Orduña), A-2128 (Santa Cruz <strong>de</strong><br />
Kanpezo – Salvatierra), A-2126 (Oyón / Oion - Bernedo), A-2124 (Vitoria-Gasteiz – Leza) y A-2122<br />
(Zubil<strong>la</strong>ga – Sobrón) en Á<strong>la</strong>va.<br />
197<br />
Revisión <strong>de</strong>l Segundo P<strong>la</strong>n General <strong>de</strong> Carreteras <strong>de</strong>l País Vasco
De manera análoga al <strong>análisis</strong> anterior, se han estudiado los flujos en el año 2003 teniendo en cuenta que<br />
no se ha dispuesto <strong>de</strong> los datos <strong>de</strong> todas <strong>la</strong>s estaciones <strong>de</strong> aforo.<br />
FLUJOS TOTALES DE TRÁFICO EN LA RED FUNCIONAL<br />
AÑO 2003<br />
Estación Carretera P.K. Localidad más próxima IMD<br />
IMD superior a 80.000 vehículos / día<br />
21 A A-8 120,0 E. Cruces - E. Kastrexana 13<strong>2.</strong>885<br />
43 A N-637 8,7 E. Cruces - E. Barakaldo 13<strong>2.</strong>001<br />
22 A A-8 118,3 E. Kastrexana - E. Sabino A. 130.788<br />
178 A A-8 129,1 E. Cruces - E. Sestao 128.265<br />
117 A-8 18,8 Túnel <strong>de</strong> Intxaurrondo 119.711<br />
45 A N-637 9,7 Barakaldo - Lutxana / Asua 118.754<br />
179 A A-8 126,5 E. Sestao - E. Portugalete 111.912<br />
24 A A-8 116,7 E. Sabino A.- E. Juan Garai 111.707<br />
116 A-8 22,7 Túnel <strong>de</strong> Aiete 106.498<br />
81 A BI-637 9,3 E. Erandio - Santimami 106.314<br />
26 A A-8 - E. Juan Garai - Buia 100.920<br />
46 A BI-637 - E. Kuku<strong>la</strong>rra – R. Erandio 99.308<br />
83 A BI-637 11,1 Santimami - Leioa 96.147<br />
180 A A-8 128,0 E. Portugalete - E. Santurtzi 84.351<br />
IMD entre 40.000 vehículos / día y 80.000 vehículos / día<br />
84 A BI-637 - Leioa - Artatza 79.447<br />
250 A-8 24,0 Aritzeta - Ariete 77.891<br />
45 C N-637 11,6 E. Kuku<strong>la</strong>rra - Enekuri (BI-604) 7<strong>2.</strong>373<br />
27 A A-8 112,9 Buia - E. Basauri 71.283<br />
84 D BI-637 13,9 Artatza - Bolue 70.829<br />
33 N-I 448,8 Andoain 68.847<br />
16 A-8 20,7 X <strong>de</strong> <strong>la</strong> Misericordia 65.161<br />
181 A A-8 131,7 E. Perto - E. S. Fuentes 61.555<br />
96 N-I 445,1 Sorabil<strong>la</strong> 54.579<br />
101 N-I 466,2 Kaputxinos 53.473<br />
1 N-I 454,6 Frente a Coca – Co<strong>la</strong> 51.954<br />
99 C N-637 - Túneles Artxanda - E. Larrondo 51.155<br />
277 A-8 16,0 Pasaia / San Sebastián Este 50.157<br />
9302 N-I 463,0 Herrera - Escaleril<strong>la</strong>s 49.891<br />
12 N-I 437,8 Irura 49.814<br />
Estación Carretera P.K. Localidad más próxima IMD<br />
99 A N-637 12,8 E. Asua (BI-604) - TT. Artxanda 48.244<br />
1 A N-634 107,4 Ibarsusi - Etxebarri 46.654<br />
182 A A-8 135,2 E. San Fuentes - E. La Arena 46.474<br />
99 E N-637 - E. Larrondo - E. Derio (N-633) 45.815<br />
100 N-I 434,3 Variante <strong>de</strong> Tolosa 45.196<br />
183 A A-8 139,1 E. La Arena - E. La Haya (L.P.) 44.864<br />
278 A-8 12,0 Oiartzun / Pasaia 44.182<br />
253 N-I 466,5 Variante Errenteria 43.487<br />
108 A N-634 103,5 Irubi<strong>de</strong> - Galdakao 41.150<br />
IMD entre 20.000 vehículos / día y 40.000 vehículos / día<br />
111 N-I 424,0 Itsasondo 39.802<br />
78 C BI-604 6,0 Enekuri – Kuku<strong>la</strong>rra / Txoriherri 39.660<br />
107 N-I 428,5 Variante Ikaztegieta 39.623<br />
97 A BI-631 3,1 Orueta – Santo Domingo 39.109<br />
109 A N-634 100,2 Galdakao - El Gallo 39.019<br />
98 C N-633 - Derio – Al<strong>de</strong>kone (Aeropuerto) 37.780<br />
279 A-8 9,0 Irun / Oiartzun 37.313<br />
84 N-I 476,5 Irun Cruce – Hospital 36.805<br />
6 A BI-631 - S. Sur (A-8) - Miraflores 36.745<br />
- A-8 108,5 Circunva<strong>la</strong>ción a Galdakao 36.725<br />
50 N-I 354,3 ETD 4 – Abetxuko 36.657<br />
107 A N-634 104,0 Etxebarri - Irubi<strong>de</strong> 36.295<br />
- A-8 103,7 Erletxe - Boroa 36.192<br />
- AP-68 10,3 Ugao / Miraballes - Arakaldo 35.711<br />
240 N-I 341,0 Subijana <strong>de</strong> Á<strong>la</strong>va 35.627<br />
840 N-622 7,0 ETD 1 - En<strong>la</strong>ce <strong>de</strong> Etxabarri Viña 35.586<br />
86 B BI-637 16,5 Bolue – Kurtxes (Berango) 35.175<br />
252 N-I 468,0 Variante Errenteria 35.095<br />
51 N-622 4,5 Puente Zadorra 34.756<br />
3 N-I 473,0 Final Gaintxurizketa 34.136<br />
36 N-I 469,1 Recta <strong>de</strong> Lintzirin 34.038<br />
120 N-I 326,3 ETD 3 – Armiñón 33.207<br />
9101 N-I 453,9 Alto <strong>de</strong> Lasarte Oria 33.187<br />
78 A BI-604 4,8 Enekuri - Deusto 33.156<br />
249 A-8 27,0 Tramo <strong>de</strong> Aritzeta 33.107<br />
- AP-68 12,5 Arakaldo / Murueta 3<strong>2.</strong>632<br />
198<br />
Revisión <strong>de</strong>l Segundo P<strong>la</strong>n General <strong>de</strong> Carreteras <strong>de</strong>l País Vasco
Estación Carretera P.K. Localidad más próxima IMD<br />
281 A-8 4,0 Behobia / Ventas Irun 3<strong>2.</strong>594<br />
87 A BI-634 19,3 Berango - Larrabasterra 31.959<br />
98 A BI-631 4,4 Santo Domingo – N-633 (Galbarriatu) 31.784<br />
- A-8 105,1 Galdakao - Erletxe 31.615<br />
276 A-8 30,0 San Sebastián O. - Zarautz 31.506<br />
2 N-I 461,0 A. De Miracruz Atego 31.364<br />
40 N-I 348,9 Yurre 30.838<br />
280 A-8 7,0 Ventas <strong>de</strong> Irun / Irun 30.582<br />
30 N-I 346,7 Crispijana/Krispiñana 30.370<br />
282 A-8 0,3 Behobia / Francia 29.842<br />
154 A BI-625 384,9 E. Basauri - Moyordín (Arrigorriaga) 29.829<br />
28 A AP-68 1,7 Buia - Arrigorriaga 29.637<br />
- A-8 95,8 Etxano – Iurreta 29.597<br />
- AP-68 15,7 Murueta / L.P. Á<strong>la</strong>va 29.543<br />
4 B N-634 - Bolueta - Miraflores 29.389<br />
32 A N-634 116,8 Burtzeña - Zorrotza 28.493<br />
- A-8 98,9 Amorebieta / Etxano 28.292<br />
103 N-I 479,5 Behobia 28.083<br />
21 B BI-636 4,2 E. A-8 - Kastrexana 27.406<br />
110 A N-634 98,5 El Gallo - Erletxe 27.373<br />
113 B N-634 - E. Iurreta - Durango 27.364<br />
101 G BI-631 17,4 Variante Mungia 26.929<br />
9136 GI-2132 14,8 Lartzabal - Mamut 26.703<br />
90 N-I 371,6 Arrieta 26.478<br />
113 A N-634 82,9 La Pi<strong>la</strong>stra - E. Iurreta 26.415<br />
32 C N-634 117,2 Burtzeña - Cruces 26.320<br />
110 N-240 6,3 Durana 26.060<br />
248 A-8 25,2 En<strong>la</strong>ce <strong>de</strong> Aritzeta 26.030<br />
112 A N-634 83,7 Amorebieta - E. La Pi<strong>la</strong>stra 25.374<br />
118 N-638 1,6 Entre Amute y Aeropuerto 25.355<br />
275 A-8 45,0 Zestoa / Zarautz 25.220<br />
844 N-622 8,6 Kas 25.136<br />
60 N-I 356,4 Durana 24.881<br />
98 D N-637 19,7 Derio - Zamudio 24.863<br />
168 N-I 416,4 Beasain 24.562<br />
140 N-I 379,3 Mezkia 24.188<br />
Estación Carretera P.K. Localidad más próxima IMD<br />
163 A N-240 11,8 El Gallo - Bedia 24.130<br />
55 A BI-636 7,2 Kastrexana - Alonsotegi 23.575<br />
220 N-I 382,7 Urabain 23.496<br />
230 N-I 387,5 ETD 5 – Egino 23.488<br />
104 N-634 1,5 Cruce Txikierdi 23.053<br />
70 N-I 359,8 Lubiano 2<strong>2.</strong>831<br />
100 N-622 12,9 Letona 2<strong>2.</strong>813<br />
61 N-240 4,9 Gamarra Mayor 2<strong>2.</strong>801<br />
200 N-I 378,7 Salvatierra o Agurain 2<strong>2.</strong>739<br />
71 GI-2132 0,1 Errekal<strong>de</strong> 2<strong>2.</strong>623<br />
155 A BI-625 383,6 Moyordín - E. Arrigorriaga 2<strong>2.</strong>557<br />
274 A-8 52,0 Zestoa / Itziar 2<strong>2.</strong>150<br />
111 A N-634 93,9 Erletxe - Amorebieta O. 2<strong>2.</strong>105<br />
55 C BI-636 - Solución Sur (A-8) - Kastrexana 2<strong>2.</strong>061<br />
119 GI-2132 0 Ga<strong>la</strong>rreta 21.170<br />
114 A N-634 79,2 Durango - Matiena 21.141<br />
- A-8 87,1 Iurreta - Zaldibar 20.945<br />
273 A-8 60,0 Itziar / Elgoibar 20.901<br />
1 B BI-631 - Ibarsusi – Santo Domingo 20.589<br />
156 A BI-625 - BI-712 - Ugao (Miraballes) 20.512<br />
102 N-I 479,9 Behobia 20.416<br />
89 GI-627 39,4 Cruce <strong>de</strong> San Pru<strong>de</strong>ntzio 20.380<br />
88 A BI-634 20,9 Larrabasterra - Sope<strong>la</strong>na 20.261<br />
2 A N-634 108,1 Ibarsusi - Bolueta 20.205<br />
111 N-I 424,0 Itsasondo 39.802<br />
78 C BI-604 6,0 Enekuri – Kuku<strong>la</strong>rra / Txoriherri 39.660<br />
107 N-I 428,5 Variante Ikaztegieta 39.623<br />
97 A BI-631 3,1 Orueta – Santo Domingo 39.109<br />
109 A N-634 100,2 Galdakao - El Gallo 39.019<br />
98 C N-633 - Derio – Al<strong>de</strong>kone (Aeropuerto) 37.780<br />
279 A-8 9,0 Irun / Oiartzun 37.313<br />
84 N-I 476,5 Irun Cruce – Hospital 36.805<br />
6 A BI-631 - S. Sur (A-8) - Miraflores 36.745<br />
- A-8 108,5 Circunva<strong>la</strong>ción a Galdakao 36.725<br />
50 N-I 354,3 ETD 4 – Abetxuko 36.657<br />
107 A N-634 104,0 Etxebarri - Irubi<strong>de</strong> 36.295<br />
199<br />
Revisión <strong>de</strong>l Segundo P<strong>la</strong>n General <strong>de</strong> Carreteras <strong>de</strong>l País Vasco
Estación Carretera P.K. Localidad más próxima IMD<br />
- A-8 103,7 Erletxe - Boroa 36.192<br />
- AP-68 10,3 Ugao / Miraballes - Arakaldo 35.711<br />
240 N-I 341,0 Subijana <strong>de</strong> Á<strong>la</strong>va 35.627<br />
840 N-622 7,0 ETD 1 - En<strong>la</strong>ce <strong>de</strong> Etxabarri Viña 35.586<br />
86 B BI-637 16,5 Bolue – Kurtxes (Berango) 35.175<br />
252 N-I 468,0 Variante Errenteria 35.095<br />
51 N-622 4,5 Puente Zadorra 34.756<br />
3 N-I 473,0 Final Gaintxurizketa 34.136<br />
36 N-I 469,1 Recta <strong>de</strong> Lintzirin 34.038<br />
120 N-I 326,3 ETD 3 – Armiñón 33.207<br />
9101 N-I 453,9 Alto <strong>de</strong> Lasarte Oria 33.187<br />
78 A BI-604 4,8 Enekuri - Deusto 33.156<br />
249 A-8 27,0 Tramo <strong>de</strong> Aritzeta 33.107<br />
- AP-68 12,5 Arakaldo / Murueta 3<strong>2.</strong>632<br />
281 A-8 4,0 Behobia / Ventas Irun 3<strong>2.</strong>594<br />
87 A BI-634 19,3 Berango - Larrabasterra 31.959<br />
98 A BI-631 4,4 Santo Domingo – N-633 (Galbarriatu) 31.784<br />
- A-8 105,1 Galdakao - Erletxe 31.615<br />
276 A-8 30,0 San Sebastián O. - Zarautz 31.506<br />
2 N-I 461,0 A. De Miracruz Atego 31.364<br />
40 N-I 348,9 Yurre 30.838<br />
280 A-8 7,0 Ventas <strong>de</strong> Irun / Irun 30.582<br />
30 N-I 346,7 Crispijana/Krispiñana 30.370<br />
282 A-8 0,3 Behobia / Francia 29.842<br />
154 A BI-625 384,9 E. Basauri - Moyordín (Arrigorriaga) 29.829<br />
28 A AP-68 1,7 Buia - Arrigorriaga 29.637<br />
- A-8 95,8 Etxano – Iurreta 29.597<br />
- AP-68 15,7 Murueta / L.P. Á<strong>la</strong>va 29.543<br />
4 B N-634 - Bolueta - Miraflores 29.389<br />
32 A N-634 116,8 Burtzeña - Zorrotza 28.493<br />
- A-8 98,9 Amorebieta / Etxano 28.292<br />
103 N-I 479,5 Behobia 28.083<br />
21 B BI-636 4,2 E. A-8 - Kastrexana 27.406<br />
110 A N-634 98,5 El Gallo - Erletxe 27.373<br />
113 B N-634 - E. Iurreta - Durango 27.364<br />
101 G BI-631 17,4 Variante Mungia 26.929<br />
Estación Carretera P.K. Localidad más próxima IMD<br />
9136 GI-2132 14,8 Lartzabal - Mamut 26.703<br />
90 N-I 371,6 Arrieta 26.478<br />
113 A N-634 82,9 La Pi<strong>la</strong>stra - E. Iurreta 26.415<br />
32 C N-634 117,2 Burtzeña - Cruces 26.320<br />
110 N-240 6,3 Durana 26.060<br />
248 A-8 25,2 En<strong>la</strong>ce <strong>de</strong> Aritzeta 26.030<br />
112 A N-634 83,7 Amorebieta - E. La Pi<strong>la</strong>stra 25.374<br />
118 N-638 1,6 Entre Amute y Aeropuerto 25.355<br />
275 A-8 45,0 Zestoa / Zarautz 25.220<br />
844 N-622 8,6 Kas 25.136<br />
60 N-I 356,4 Durana 24.881<br />
98 D N-637 19,7 Derio - Zamudio 24.863<br />
168 N-I 416,4 Beasain 24.562<br />
140 N-I 379,3 Mezkia 24.188<br />
163 A N-240 11,8 El Gallo - Bedia 24.130<br />
55 A BI-636 7,2 Kastrexana - Alonsotegi 23.575<br />
220 N-I 382,7 Urabain 23.496<br />
230 N-I 387,5 ETD 5 – Egino 23.488<br />
104 N-634 1,5 Cruce Txikierdi 23.053<br />
70 N-I 359,8 Lubiano 2<strong>2.</strong>831<br />
100 N-622 12,9 Letona 2<strong>2.</strong>813<br />
61 N-240 4,9 Gamarra Mayor 2<strong>2.</strong>801<br />
200 N-I 378,7 Salvatierra o Agurain 2<strong>2.</strong>739<br />
71 GI-2132 0,1 Errekal<strong>de</strong> 2<strong>2.</strong>623<br />
155 A BI-625 383,6 Moyordín - E. Arrigorriaga 2<strong>2.</strong>557<br />
274 A-8 52,0 Zestoa / Itziar 2<strong>2.</strong>150<br />
111 A N-634 93,9 Erletxe - Amorebieta O. 2<strong>2.</strong>105<br />
55 C BI-636 - Solución Sur (A-8) - Kastrexana 2<strong>2.</strong>061<br />
119 GI-2132 0 Ga<strong>la</strong>rreta 21.170<br />
114 A N-634 79,2 Durango - Matiena 21.141<br />
- A-8 87,1 Iurreta - Zaldibar 20.945<br />
273 A-8 60,0 Itziar / Elgoibar 20.901<br />
1 B BI-631 - Ibarsusi – Santo Domingo 20.589<br />
156 A BI-625 - BI-712 - Ugao (Miraballes) 20.512<br />
102 N-I 479,9 Behobia 20.416<br />
89 GI-627 39,4 Cruce <strong>de</strong> San Pru<strong>de</strong>ntzio 20.380<br />
200<br />
Revisión <strong>de</strong>l Segundo P<strong>la</strong>n General <strong>de</strong> Carreteras <strong>de</strong>l País Vasco
Estación Carretera P.K. Localidad más próxima IMD<br />
88 A BI-634 20,9 Larrabasterra - Sope<strong>la</strong>na 20.261<br />
2 A N-634 108,1 Ibarsusi - Bolueta 20.205<br />
IMD entre 10.000 vehículos / día y 20.000 vehículos / día<br />
272 A-8 70,9 Elgoibar / Azitain 19.958<br />
80 N-I 365,8 Venta <strong>de</strong>l Patio 19.780<br />
19 A N-634 115,5 Basurto - Kastrexana 19.661<br />
9359 N-636 9,3 Cruce <strong>de</strong> Ezkio 19.621<br />
271 A-8 72,0 Azitain / Ermua 19.287<br />
11 N-634 61,5 Eibar 19.083<br />
56 A BI-636 - Alonsotegi - Zaramillo 19.048<br />
79 GI-131 10,7 Astigarraga 18.830<br />
157 A BI-625 380,6 Arrigorriaga - Miraballes (Ugao) 18.561<br />
56 B BI-636 - Zaramillo - La Cuadra 18.466<br />
257 A-8 A 0,0 Puente <strong>de</strong> Behobia 18.323<br />
57 A BI-636 13,8 La Cuadra - Sodupe 18.247<br />
36 A N-634 119,7 Ugarte - Retuerto 17.883<br />
110 B N-637 - Erletxe - Larrabetzu 17.846<br />
47 N-634 66,0 Eibar (Muga) 17.789<br />
106 N-634 59,9 Puente bajo autopista 17.506<br />
46 N-634 57,9 Sigma (Elgoibar) 17.391<br />
117 D N-634 65,7 Ermua - L.P. Gipuzkoa 17.109<br />
35 A N-634 118,9 Retuerto - Cruces 17.062<br />
10169 N-636 2,1 Ormaiztegi 17.059<br />
170 N-636 4,0 Ormaiztegi 17.045<br />
81 GI-131 13,5 Donostia (Loio<strong>la</strong>) 16.870<br />
164 A N-240 - Bedia - Lemoa 16.835<br />
69 GI-131 9,0 Parada Bus Carabel 16.721<br />
79 A BI-604 - Asua – E. Kuku<strong>la</strong>rra 16.594<br />
87 N-636 7,0 Cruce <strong>de</strong> Ezkio 16.463<br />
127 GI-627 40,4 San Pru<strong>de</strong>ntzio 16.454<br />
102 N-622 23,3 ETD 2 - Peaje AP-68 Altube 16.110<br />
30 N-I 405,3 Puerto <strong>de</strong> Etxegarate 16.098<br />
35 GI-131 10,6 Astigar - C. Garziateg 16.048<br />
120 GI-131 5,6 Urnieta 15.934<br />
176 A N-636 - Apatamonasterio - Vte. Elorrio 15.860<br />
180 N-I 321,7 Límite Miranda <strong>de</strong> Ebro 15.635<br />
Estación Carretera P.K. Localidad más próxima IMD<br />
126 A BI-635 34,6 Vista Alegre - Gernika 15.564<br />
158 GI-631 15,9 Loyo<strong>la</strong> 15.365<br />
130 N-102 345,1 Gomecha 15.239<br />
121 N-I 325,5 Puente Nuevo 15.045<br />
118 A N-637 22,6 Zamudio - Lezama 14.961<br />
53 GI-2620 22,2 Arrasate / Mondragón 14.716<br />
40 C N-634 128,8 El Casal - Las Carreras 14.590<br />
1070 A-625 371,0 Llodio (Bilbao) 14.487<br />
5 A N-634 - Miraflores - Arenal 14.463<br />
175 A N-636 35,1 Abadiño - Apatamonasterio 14.322<br />
256 N-I 481,5 Behobia 14.154<br />
40 A N-634 127,1 El Casal - Nocedal 13.907<br />
41 A N-634 - Muskiz – Las Carreras 13.886<br />
165 A N-240 20,0 Lemoa - Igorre 13.705<br />
36 B N-634 - Ugarte - Zabal<strong>la</strong> 13.642<br />
160 A A-625 - Laudio - Luxaondo 13.527<br />
158 B BI-625 - E. Areta Norte - Areta 13.462<br />
118 B N-637 - Lezama - Vte. Larrabetzu 13.441<br />
9113 GI-627 49,2 Meko<strong>la</strong>l<strong>de</strong> 13.373<br />
125 A BI-635 - Zugaztieta – Vista Alegre 13.301<br />
124 A BI-635 - E. Amorebieta - Zugaztieta 13.294<br />
134 A-15 147,8 Túnel <strong>de</strong> Be<strong>la</strong>bieta 13.248<br />
79 C BI-2704 8,4 Asua - Loiu 1<strong>2.</strong>971<br />
68 GI-131 2,0 Andoain - A. Irurain 1<strong>2.</strong>966<br />
111 B BI-635 - Amorebieta - Zugaztieta 1<strong>2.</strong>771<br />
9211 GI-627 52,3<br />
Antes entrada variante a Soraluze / P<strong>la</strong>cencia<br />
<strong>de</strong> Armas 1<strong>2.</strong>659<br />
59 A BI-636 - Artxube - L<strong>la</strong>ntada 1<strong>2.</strong>549<br />
128 N-638 0,2 Hondarribia 1<strong>2.</strong>520<br />
157 C BI-625 - Miraballes (Ugao) - Arrankudiaga 1<strong>2.</strong>470<br />
115 A N-634 - Matiena - O<strong>la</strong>kueta 1<strong>2.</strong>452<br />
11 N-104 355,5 Arkaute 1<strong>2.</strong>329<br />
174 A N-636 - Durango - Abadiño 1<strong>2.</strong>319<br />
9259 GI-2630 0,3 Urretxu 11.893<br />
58 GI-631 12,2 Azpeitia (Gasolinera) 11.802<br />
15 N-636 22,6 Salida hacia Deskarga 11.685<br />
123 N-634 29,6 Salida hacía Okina 11.416<br />
201<br />
Revisión <strong>de</strong>l Segundo P<strong>la</strong>n General <strong>de</strong> Carreteras <strong>de</strong>l País Vasco
Estación Carretera P.K. Localidad más próxima IMD<br />
158 A BI-625 - Arrankudiaga - E. Areta Norte 11.383<br />
1060 A-625 360,2 Amurrio (Llodio) 11.236<br />
1071 A-625 369,0 Llodio (Amurrio) 11.222<br />
80 C N-633 - BI-631 - Aeropuerto 11.079<br />
111 N-240 15,0 Legutiano 11.047<br />
9157 GI-631 3,8 Cruce <strong>de</strong> <strong>la</strong> Variante 10.937<br />
119 A N-637 27,3 Vte. Larrabetzu 10.890<br />
590 N-124 35,2 Salinil<strong>la</strong>s <strong>de</strong> Buradón 10.655<br />
592 N-124 30,7 Zambrana 10.584<br />
122 N-124 26,5 Cadiñanos 10.502<br />
88 B BI-634 - Sope<strong>la</strong>na - Urduliz 10.318<br />
126 C BI-2235 - Gernika - Murueta 10.254<br />
161 A A-625 - Luxaondo – Amurrio 10251<br />
88 C BI-2122 - Sope<strong>la</strong>na - Barrika 10.180<br />
55 N-634 29,9 Arrona 10.176<br />
37 A N-634 122,2 Trapagarán - San Andrés 10.144<br />
38 A N-634 - Trapagarán - Ortuel<strong>la</strong> 10.085<br />
IMD entre 5.000 vehículos / día y 10.000 vehículos / día<br />
115 D N-634 73,6 O<strong>la</strong>kueta - Zaldibar 9.985<br />
259 GI-131 8,0 Variante <strong>de</strong> Hernani 9.952<br />
92 GI-2132 9,1 Benta – Astigarraga Perurena 9.933<br />
37 N-634 7,6 Aginaga 9.909<br />
45 N-634 54,4 Salida <strong>de</strong> Altzo<strong>la</strong> 9.866<br />
57 C BI-636 - Sodupe - Artxube 9.721<br />
1050 A-627 17,7 Landa 9.316<br />
9213 N-636 19,7 Salida a Deskarga 9.233<br />
9159 N-636 16,3 Alto <strong>de</strong> Deskarga 9.197<br />
165 C N-240 - Igorre - Arantzazu 9.133<br />
112 GI-627 33,2 Fagor (Mondragón) 9.126<br />
56 GI-2630 23,6 Cruce <strong>de</strong> San Pru<strong>de</strong>ntzio 8.983<br />
1051 A-627 13,1 Urbina 8.916<br />
166 A N-240 - Arantzazu - Bildoso<strong>la</strong> (BI-3530) 8.776<br />
60 A BI-636 - L<strong>la</strong>ntada - Balmaseda N. 8.597<br />
101 E BI-2121 - Mungia - Soietxe 8.595<br />
39 A N-634 - Nocedal - Ortuel<strong>la</strong> 8.554<br />
172 A BI-623 31,1 Izurtza - Mañaria 8.543<br />
Estación Carretera P.K. Localidad más próxima IMD<br />
51 GI-627 19,0 Alto <strong>de</strong> Ar<strong>la</strong>bán 8.476<br />
490 A-2126 59,1 Oyón (L.P. Logroño) 8.419<br />
101 B BI-634 - Mungia - Gatika 8.404<br />
122 N-634 21,4 Getaria - Casa Caminer 8.362<br />
127 A BI-2238 - Gernika - Kortezubi 8.347<br />
128 A BI-2235 - Gernika - Murueta 8.300<br />
130 B BI-2235 - Mundaka - Bermeo 8.206<br />
101 D BI-631 - Mungia - Larrauri 7.963<br />
9210 GI-631 0,2 Cruce <strong>de</strong> Arieta 7.913<br />
164 B BI-635 - Lemoa - Amorebieta 7.884<br />
9312 GI-2130 1,7 Ibarra – F. Casa Montes 7.882<br />
117 A N-634 - Areitio - Ermua 7.754<br />
131 A BI-2238 - Kortezubi - Gauztegiz 7.588<br />
128 B BI-2235 - Murueta - Busturia 7.573<br />
129 A BI-2235 - Busturia - Sukarrieta 7.539<br />
94 B BI-634 - Urduliz - Elortza 7.528<br />
130 A BI-2235 - Sukarrieta - Mundaka 7.450<br />
93 GI-2132 10,2 Benta - Astigarraga 7.420<br />
9314 GI-2120 63,4 Variante <strong>de</strong> Lazkao 7.255<br />
116 A N-634 70,1 Zaldibar - Areitio 7.220<br />
94 GI-2620 19 Arrasate / Mondragón 6.961<br />
102 A BI-631 - Larrauri – Int. BI-3101 6.957<br />
54 N-636 34,7 Alto Kanpazar 6.897<br />
61 C BI-636 - La Pinil<strong>la</strong> - Vil<strong>la</strong>sana 6.863<br />
89 A BI-2122 - Barrika - Plentzia 6.793<br />
50 GI-638 7,2 Saturrarán 6.705<br />
350 N-104 358,8 Matauco 6.617<br />
92 A BI-2704 - Loiu - Unbe 6.525<br />
176 C N-636 - Elorrio O. - L.P. (Pto. Kanpazar) 6.464<br />
791 A-2522 47 Llodio (Orozco) 6.459<br />
41 C BI-2701 - Muskiz – El Arenao 6.447<br />
67 A BI-2701 - Muskiz – El Arenao 6.301<br />
40 N-634 24,7 Getaria 6.265<br />
43 N-634 45,4 Deba 6.101<br />
166 B N-240 - Int. BI-3530 - Zeanuri 5.967<br />
159 A BI-2522 - Areta – E. Areta Sur 5.951<br />
202<br />
Revisión <strong>de</strong>l Segundo P<strong>la</strong>n General <strong>de</strong> Carreteras <strong>de</strong>l País Vasco
Estación Carretera P.K. Localidad más próxima IMD<br />
93 A BI-2704 13,1 Unbe – Alto Unbe 5.947<br />
176 E N-636 - Vte. Elorrio - E. Elorrio 5.727<br />
168 A N-240 - Int. BI-3530 - Zeanuri 5.624<br />
131 GI-2634 33,7 Túnel <strong>de</strong> Azkarateko 5.597<br />
117 C BI-2301 - Ermua - Arrangizgana 5.537<br />
142 B BI-2405 - Oleta - Amoroto 5.492<br />
94 C BI-634 - Elortza - Butroe 5.448<br />
49 GI-638 3,5 Entrada Mutriku 5.372<br />
105 N-634 31,1 Cruce <strong>de</strong> Iraeta 5.369<br />
177 C BI-2522 - E. Areta Sur - Orozko 5.351<br />
89 B BI-2704 - Plentzia – Elortza (Urduliz) 5.309<br />
142 C BI-2405 - Oleta - Lekeito 5.308<br />
91 GI-638 1,3 Deba 5.225<br />
68 A BI-2701 - El Arenao – Merkadillo (Sopuerta) 5.184<br />
1064 A-625 360,0 Circunva<strong>la</strong>ción <strong>de</strong> Amurrio 5.169<br />
54 C N-639 - La Cuesta - El Casal 5.007<br />
IMD entre <strong>2.</strong>000 vehículos / día y 5.000 vehículos / día<br />
176 F N-636 - E. Elorrio - Elorrio 4.995<br />
61 A BI-636 - Balmaseda - La Pinil<strong>la</strong> 4.990<br />
57 B BI-2604 - Sodupe - Padura 4.914<br />
93 C BI-2704 - Alto Unbe – BI-3724 (Ugeraga) 4.889<br />
134 B BI-2405 - Lekeito - Oleta 4.873<br />
123 A BI-2121 - Mungia - Soietxe 4.799<br />
1061 A-625 356,0 Saratxo 4.798<br />
310 A-623 18,3 Límite Otxandio 4.787<br />
12 N-I32 4,9 Ascarza 4.785<br />
161 B A-625 - Amurrio – Vitoria-Gasteiz 4.761<br />
1063 A-625 358,2 Amurrio 4.749<br />
168 C N-240 - Zeanuri - Barazar 4.738<br />
103 A BI-631 - Larrauri - Sollube 4.659<br />
104 A BI-631 - Sollube - Bermeo 4.609<br />
62 A-2134 7,9 Zurbano 4.528<br />
59 GI-631 31,5 Cruce <strong>de</strong> Agiñeta 4.513<br />
670 A-2622 12,5 Nanc<strong>la</strong>res <strong>de</strong> <strong>la</strong> Oka 4.494<br />
1200 N-I32 8,7 Andollu 4.415<br />
162 A BI-625 - Amurrio - Orduña 4.414<br />
Estación Carretera P.K. Localidad más próxima IMD<br />
94 A BI-2704 - BI-3724 – Elortza (Urduliz) 4.396<br />
95 A BI-634 - Butroe - Gatika 4.390<br />
39 GI-2633 4,1 Meaga Gaina 4.350<br />
169 A N-240 - Barazar - Zubizabal 4.335<br />
9212 GI-2135 60,8 B. Amoroz – Palp. Araxes 4.322<br />
821 A-624 30,9 Cruce <strong>de</strong> Urquillo 4.314<br />
302 N-240 20,0 Ollerías 4.301<br />
172 B BI-623 - Mañaria - Urkio<strong>la</strong> 4.283<br />
169 B N-240 40,5 Zubizabal - L.P. (Ubi<strong>de</strong>a) 4.184<br />
72 A BI-2604 - Gor<strong>de</strong>xo<strong>la</strong> – Padura (Sodupe) 4.124<br />
146 C BI-2636 - Etxebarria - Markina 4.108<br />
146 C BI-2636 - Etxebarria - Markina 4.108<br />
42 A N-634 136,1 Muskiz - L.P. Cantabria 3.986<br />
125 GI-631 20,8 Azkoitia 3.967<br />
300 N-240 21,5 Ubi<strong>de</strong>a 3.929<br />
41 N-634 34,4 Itziar (Chatarreria) 3.928<br />
1170 A-2122 34,7 Zubil<strong>la</strong>ga 3.928<br />
160 A-2124 9,5 Puerto Vitoria 3.904<br />
148 B BI-2405 - P<strong>la</strong>zako<strong>la</strong> - Oleta 3.792<br />
173 B BI-623 - Otxandio - L.P. (Á<strong>la</strong>va) 3.755<br />
1062 A-624 42,9 Amurrio 3.731<br />
125 B BI-2121 - Vista Alegre - Muxika 3.723<br />
500 N-124 75,5 Laserna 3.677<br />
173 A BI-623 - Urkio<strong>la</strong> - Otxandio 3.676<br />
123 C BI-2121 - Soietxe - Fruiz 3.652<br />
510 N-124 61,1 Páganos 3.633<br />
133 N-636 33,9 Epele - Kanpazar 3.556<br />
69 A BI-2701 - Merkadillo – El Carral 3.520<br />
150 N-I32 22,3 Azatzeta 3.477<br />
97 GI-2120 62,0 Puente Nuevo Ataun 3.473<br />
82 GI-2630 14,6 Salida hacía Udana 3.467<br />
170 A-2130 5 Otazu 3.438<br />
161 C BI-624 - Amurrio - Artziniega 3.400<br />
640 A-2124 3,7 Castillo 3.361<br />
820 A-624 25,0 Altube 3.335<br />
62 B BI-2701 - Ma<strong>la</strong>brigo - Reto<strong>la</strong> 3.332<br />
203<br />
Revisión <strong>de</strong>l Segundo P<strong>la</strong>n General <strong>de</strong> Carreteras <strong>de</strong>l País Vasco
Estación Carretera P.K. Localidad más próxima IMD<br />
134 A BI-2238 - Tres Cruces - Lekeito 3.240<br />
120 A BI-2713 - Larrabetzu - Astoreka 3.222<br />
910 A-624 45,7 Respaldiza 3.166<br />
60 GI-2634 5,7 Beizamako Bi<strong>de</strong>g. 3.143<br />
770 A-624 40,0 Larrimbe 3.140<br />
69 C BI-2701 - El Carral - Avel<strong>la</strong>neda 3.115<br />
70 A BI-2701 - Avel<strong>la</strong>neda - Reto<strong>la</strong> 3.054<br />
850 A-2604 55,5 Artziniega <strong>2.</strong>960<br />
72 C BI-2604 - Gor<strong>de</strong>xo<strong>la</strong> – L.P. (Artziniega) <strong>2.</strong>924<br />
923 A-2625 318,9 Puente<strong>la</strong>rrá <strong>2.</strong>804<br />
450 A-2620 31,2 Ibarra <strong>de</strong> Aramaio <strong>2.</strong>803<br />
54 B N-639 - Zierbana - El Puerto (Zierbana) <strong>2.</strong>761<br />
13 GI-627 0,0 Altos Hornos <strong>de</strong> Bergara <strong>2.</strong>716<br />
430 N-I32 41,5 Sta. Cruz (Límite Navarra) <strong>2.</strong>676<br />
165 B BI-2543 - Igorre - Dima <strong>2.</strong>560<br />
88 GI-2630 8,5 Alto <strong>de</strong> Udana <strong>2.</strong>514<br />
420 N-I32 34,5 Antoñana <strong>2.</strong>493<br />
680 A-2622 16,5 Montevite <strong>2.</strong>459<br />
122 A BI-2121 - Fruiz - Errigoitiolea <strong>2.</strong>435<br />
830 A-2521 23,8 Beluntza <strong>2.</strong>415<br />
121 B BI-2121 - Alto <strong>de</strong> Morga - Muxika <strong>2.</strong>376<br />
170 A BI-2543 - Igorre - Dima <strong>2.</strong>333<br />
48 GI-2135 59,1 Pasada recta Txamara <strong>2.</strong>300<br />
127 C BI-2224 - Gernika - Uarka <strong>2.</strong>291<br />
132 A BI-2238 - Atxoste - Basetxea <strong>2.</strong>282<br />
62 C BI-630 - Ma<strong>la</strong>brigo - Herbosa <strong>2.</strong>278<br />
911 A-624 49,0 Menagaray <strong>2.</strong>264<br />
62 A BI-630 - Balmaseda - Ma<strong>la</strong>brigo <strong>2.</strong>262<br />
95 GI-2620 16,6 Santa Ageda <strong>2.</strong>223<br />
64 A BI-630 - Artzentales - Turtzioz <strong>2.</strong>138<br />
9258 GI-2634 22,9 Bidaniako Bi<strong>de</strong>g. <strong>2.</strong>125<br />
580 N-124 42,5 Labastida <strong>2.</strong>080<br />
177 A BI-2522 - Orozko – L.P. (Ziorraga) <strong>2.</strong>065<br />
65 A BI-630 - Turtzioz - Ambasaguas <strong>2.</strong>045<br />
131 C BI-2238 - Gauztegiz – Atxoste (Muruetagana) <strong>2.</strong>043<br />
75 GI-2130 8,6 Salida <strong>de</strong> Elduain <strong>2.</strong>015<br />
Estación Carretera P.K. Localidad más próxima IMD<br />
IMD inferior a <strong>2.</strong>000 vehículos / día<br />
52 GI-627 22,3 Puerto <strong>de</strong> Ar<strong>la</strong>bán 1.983<br />
63 A BI-630 35,0 Herbosa - Artzentales 1.966<br />
920 A-2122 42,8 Puente<strong>la</strong>rrá 1.952<br />
520 N-124 52,8 Ábalos 1.899<br />
900 A-2604 (1) 1 Gordéliz (Artziniega) 1.889<br />
132 GI-2130 11,8 Caserío Sabiñone 1.886<br />
122 B BI-2121 - Errigoitiolea - Morga 1.858<br />
790 A-2522 36,6 Ziorraga 1.744<br />
800 A-2522 34,3 Baranbio 1.724<br />
121 A BI-2121 - Morga – Alto <strong>de</strong> Morga 1.671<br />
922 A-2625 321 Bergüenda 1.612<br />
65 B BI-630 - Ambasaguas - L.P. (Ramales) 1.524<br />
133 A BI-2238 - Basetxea – Tres Cruces 1.429<br />
66 C N-629 - Lanestosa – L.P. (Ramales) 1.398<br />
83 GI-2636 1,9 Elgoibar 1.296<br />
841 N-624 8,5 Foronda 1.239<br />
120 C BI-2713 - Astoreka – Alto <strong>de</strong> Morga 1.234<br />
720 A-2625 334,8 Osma 1.221<br />
64 B BI-2617 - Turtioz – L.P. Cantabria 1.198<br />
145 B BI-2224 - Bolívar - Iruzubieta 1.197<br />
1210 A-2622 33,5 Tuesta 1.131<br />
66 B N-629 - Lanestosa – L.P. (Bercedo) 1.106<br />
921 A-2122 47,3 Sobrón 1.101<br />
162 B BI-2625 - Orduña – L.P. Burgos 1.085<br />
380 A-2128 27,3 Opacua 1.025<br />
320 A-2620 17,3 Puerto Cruceta 944<br />
700 A-2622 22,8 Paúl 903<br />
440 N-126 39,0 Genevil<strong>la</strong> 871<br />
146 A BI-2636 - L.P. (Elgoibar) – Etxebarria 811<br />
146 A BI-2636 - L.P. Elgoibar - Etxebarria 811<br />
721 A-2625 346,2 Puerto Orduña 808<br />
390 A-2128 38 Puerto Opacua 800<br />
140 A BI-2224 - Ibartxu - Arbatzegi 793<br />
760 A-2521 30 Unzá 780<br />
462 N-126 36,0 Navarrete 777<br />
204<br />
Revisión <strong>de</strong>l Segundo P<strong>la</strong>n General <strong>de</strong> Carreteras <strong>de</strong>l País Vasco
Estación Carretera P.K. Localidad más próxima IMD<br />
61 GI-2634 14,4 Errezilgo Irteera 755<br />
902 A-2604 (1) 4,5 Gordéliz (Peña Angulo) 654<br />
140 C BI-2224 - Arbatzegi - Bolibar 619<br />
480 A-2126 53,5 Yécora 585<br />
471 N-126 39,5 Bernedo (Límite Navarra) 561<br />
173 C BI-2543 - Dima - Otxandio 531<br />
740 A-2622 40 Guren<strong>de</strong>s 524<br />
470 A-2126 42 Puerto Bernedo 511<br />
540 A-2124 26 Puerto Herrera 495<br />
903 A-624 57,0 Artziniega (Balmaseda) 463<br />
630 A-2124 15,8 Peñacerrada (a Vitoria) 456<br />
400 A-2128 55,8 Contrasta 419<br />
432 A-2128 39,4 Santa Cruz 410<br />
64 GI-2120 49,2 Alto <strong>de</strong> Lizarrusti 343<br />
473 N-126 41,8 Angostina 275<br />
662 N-126 18,5 Añastro (Condado <strong>de</strong> Treviño) 188<br />
750 A-2622 51,5 Tobil<strong>la</strong>s 148<br />
722 A-2625 34 Cárcamo 133<br />
Fuente: E<strong>la</strong>boración propia a partir <strong>de</strong> los datos <strong>de</strong> <strong>la</strong>s Diputaciones Forales <strong>de</strong> Á<strong>la</strong>va, Gipuzkoa y Bizkaia.<br />
Las conclusiones <strong>de</strong>rivadas <strong>de</strong> <strong>la</strong> tab<strong>la</strong> anterior son <strong>la</strong>s siguientes:<br />
√ Las carreteras que registran los mayores tráficos <strong>de</strong> todo el País Vasco, superando los 80.000<br />
vehículos / día son como en el año 2002 <strong>de</strong> <strong>la</strong> Red <strong>de</strong> Interés Preferente, <strong>la</strong> Autopista A-8 (Autopista <strong>de</strong>l<br />
Cantábrico) a su paso por Bilbao Metropolitano y por Donostia-San Sebastián (se superan incluso los<br />
100.000 vehículos / día), y <strong>la</strong> carretera nacional N-637 (Cor<strong>red</strong>or Rontegi). A<strong>de</strong>más, en <strong>la</strong> Red <strong>de</strong> Básica,<br />
una <strong>de</strong> <strong>la</strong>s carreteras que lo constituye también registra tráficos importantes, es <strong>la</strong> BI-637 (Erandio -<br />
Berango) continuación <strong>de</strong>l Cor<strong>red</strong>or Rontegi hasta <strong>la</strong> localidad <strong>de</strong> Leioa.<br />
√ Entre 80.000 vehículos / día y 40.000 vehículos / día, a<strong>de</strong>más <strong>de</strong> <strong>la</strong>s tres carreteras citadas<br />
anteriormente, se encuentran <strong>de</strong> <strong>la</strong> Red <strong>de</strong> Interés Preferente, <strong>la</strong> Autovía <strong>de</strong>l Norte N-I y <strong>la</strong> carretera<br />
nacional N-634 (Donostia-San Sebastián – Santan<strong>de</strong>r – A Coruña). De estas dos carreteras, los tramos<br />
que tienen una IMD en el intervalo mencionado son al igual que en el año 2002 los correspondientes al<br />
Bilbao Metropolitano, al entorno <strong>de</strong> Donostia-San Sebastián y a <strong>la</strong>s proximida<strong>de</strong>s <strong>de</strong> Andoain.<br />
√ El tercer grupo consi<strong>de</strong>rado, es aquél cuya IMD varía entre 40.000 vehículos / día y 20.000 vehículos /<br />
día. Con más <strong>de</strong> 30.000 vehículos / día están <strong>la</strong>s carreteras <strong>de</strong> <strong>la</strong> Red <strong>de</strong> Interés Preferente N-I, N-634,<br />
A-8, AP-68, N-633 y N-62<strong>2.</strong> En el caso <strong>de</strong> <strong>la</strong> Autovía <strong>de</strong>l Norte N-I los tramos con más <strong>de</strong> 30.000<br />
vehículos / día son los mismos que en el año anterior, es <strong>de</strong>cir, en el entorno <strong>de</strong> Donostia-San Sebastián<br />
(cerca <strong>de</strong> Errenteria, Irun y Lasarte / Oria) y también en <strong>la</strong>s proximida<strong>de</strong>s <strong>de</strong> Beasain (en Itsasondo). En<br />
el caso <strong>de</strong> <strong>la</strong> carretera N-634, a su paso por Bilbao. En <strong>la</strong> Autopista <strong>de</strong> Peaje A-8 en Irun, en el en<strong>la</strong>ce <strong>de</strong><br />
Aritzeta y en el entorno <strong>de</strong> <strong>la</strong> circunva<strong>la</strong>ción <strong>de</strong> Galdakao. En <strong>la</strong> Autopista <strong>de</strong> Peaje Vasco Aragonesa AP-<br />
68 entre Ugao / Miraballes y Murueta y por último en <strong>la</strong> carretera N-622 (<strong>de</strong> Vitoria-Gasteiz a Bilbao por<br />
<strong>la</strong> autopista AP-68) a su paso por Etxebarri.<br />
En <strong>la</strong> Red Básica únicamente carreteras <strong>de</strong>l Territorio Histórico <strong>de</strong> Bizkaia tienen una IMD entre<br />
40.000 vehículos / día y 30.000 vehículos / día. Son <strong>la</strong> BI-637, BI-631 y BI-604, sitas todas el<strong>la</strong>s en<br />
Bilbao Metropolitano y <strong>la</strong> carretera BI-634 en Sope<strong>la</strong>na.<br />
Carreteras que tengan un tráfico menor a 30.000 vehículos / día son tanto <strong>de</strong> <strong>la</strong> Red <strong>de</strong> Interés<br />
Preferente, como <strong>de</strong> <strong>la</strong> Red Básica y <strong>de</strong> <strong>la</strong> Red Comarcal, siendo <strong>la</strong> mayor parte <strong>de</strong> el<strong>la</strong>s <strong>la</strong>s mismas<br />
que en el año 200<strong>2.</strong> De <strong>la</strong> Red <strong>de</strong> Interés Preferente, <strong>la</strong>s carreteras con una IMD entre los valores<br />
consi<strong>de</strong>rados son <strong>la</strong> N-I, A-8, AP-68, N-634, N-637, N-638 (que da acceso al Aeropuerto <strong>de</strong><br />
Hondarribia), N-622 y <strong>la</strong> N-240 (<strong>de</strong> Tarragona a Bilbao por el Puerto <strong>de</strong> Barazar). De <strong>la</strong> Red Básica <strong>la</strong><br />
BI-636 (Bilbao – Balmaseda) en <strong>la</strong> salida <strong>de</strong> Bilbao, <strong>la</strong> BI-634 en Sope<strong>la</strong>na, <strong>la</strong> BI-631 en <strong>la</strong> variante <strong>de</strong><br />
Mungia y en <strong>la</strong> salida <strong>de</strong> Bilbao, <strong>la</strong> BI-625 (Areta – Bilbao) en <strong>la</strong>s cercanías <strong>de</strong> <strong>la</strong> conexión con <strong>la</strong> A-8 y<br />
por último <strong>la</strong> GI-627 (<strong>de</strong>s<strong>de</strong> Vitoria-Gasteiz a Eibar) entre Arrasate / Mondragón y Bergara.<br />
√ Finalmente, se consi<strong>de</strong>ra el último grupo <strong>de</strong> flujos <strong>de</strong> tráfico, aquellos con una IMD inferior a los <strong>2.</strong>000<br />
vehículos / día. Se observa que son una minoría, pues tan sólo se incluyen el 10,3% <strong>de</strong> <strong>la</strong>s estaciones <strong>de</strong><br />
aforo <strong>de</strong> todas <strong>la</strong>s consi<strong>de</strong>radas en <strong>la</strong> Red Funcional (cincuenta y tres <strong>de</strong> <strong>la</strong>s quinientas diez <strong>de</strong> <strong>la</strong>s que se<br />
disponen <strong>de</strong> datos <strong>de</strong> tráfico en el año 2003). Las carreteras con IMD inferior a este valor son <strong>la</strong>s mismas<br />
que en año anterior.<br />
Correspon<strong>de</strong>n estas estaciones, y tal y como pasaba el año anterior, a <strong>la</strong>s carreteras <strong>de</strong> <strong>la</strong> Red <strong>de</strong><br />
Interés Preferente N-624 (carretera <strong>de</strong> acceso al Aeropuerto <strong>de</strong> Foronda en Vitoria-Gasteiz) y N-629<br />
(en su pequeño tramo a su paso por el Oeste en el Territorio Histórico <strong>de</strong> Bizkaia).<br />
De <strong>la</strong> Red Básica se encuentran con una IMD por <strong>de</strong>bajo <strong>de</strong> este valor <strong>la</strong>s carreteras BI-630<br />
(Balmaseda – Carranza) en Arzentales y en el límite con <strong>la</strong> provincia <strong>de</strong> Cantabria y <strong>la</strong> BI-624 (Altube<br />
– Balmaseda) en Balmaseda <strong>de</strong>l Territorio Histórico <strong>de</strong> Bizkaia. Del Territorio Histórico <strong>de</strong> Á<strong>la</strong>va, <strong>la</strong>s<br />
carreteras N-124 (<strong>de</strong> Briñas a Logroño por Laguardia) en <strong>la</strong> localidad <strong>de</strong> <strong>la</strong> Ábalos, A-624 (Altube a-<br />
Balmaseda) en Balmaseda y a lo <strong>la</strong>rgo <strong>de</strong> toda <strong>la</strong> N-126 (<strong>de</strong>l límite con Navarra al límite con el<br />
Condado <strong>de</strong> Treviño). Por último, <strong>la</strong> GI-627 (<strong>de</strong> Vitoria-Gasteiz z Eibar) en el Puerto <strong>de</strong> Ar<strong>la</strong>bán, en el<br />
Territorio Histórico <strong>de</strong> Gipuzkoa.<br />
205<br />
Revisión <strong>de</strong>l Segundo P<strong>la</strong>n General <strong>de</strong> Carreteras <strong>de</strong>l País Vasco
Por último, <strong>de</strong> <strong>la</strong> Red Comarcal <strong>la</strong>s carreteras que en algunos <strong>de</strong> sus tramos tienen una IMD menor a<br />
<strong>2.</strong>000 vehículos / día son: GI-2636 (Elgoibar – Límite con Bizkaia), GI-2634 (Tolosa - Azpeitia) y GI-<br />
2130 (Tolosa – Límite con Navarra en el puerto <strong>de</strong> Urto) en Gipuzkoa; BI-2713 (Larrabetzu – Alto <strong>de</strong><br />
Gerekiz), BI-2636 (Elgoibar – Límite con Gipuzkoa), BI-2625 (Pancorbo – Orduña), BI-2617 (Vil<strong>la</strong>ver<strong>de</strong><br />
<strong>de</strong> Trucios - Agüera), BI-2543 (Igorre - Otxandio por Dima), BI-2238 (Gernika-Lumo - Lekeito), BI-<br />
2224 (Gernika-Lumo - Markina / Xemein) y BI-2121 (Mungia - Ugarte / Muxika) en Bizkaia y A-2625<br />
(Bergüenda – Orduña), A-2622 (Nanc<strong>la</strong>res <strong>de</strong> Oka – Límite con Burgos), A-2620 (Legutiano – Arrasate<br />
/ Mondragón), A-2604 (Gor<strong>de</strong>liz – Límite con Bizkaia), A-2522 (Ziorraga – Límite con Bizkaia), A-2521<br />
(Altube – Orduña), A-2128 (Santa Cruz <strong>de</strong> Kanpezo – Salvatierra), A-2126 (Oyón / Oion - Bernedo), A-<br />
2124 (Vitoria-Gasteiz – Leza) y A-2122 (Zubil<strong>la</strong>ga – Sobrón) en Á<strong>la</strong>va.<br />
En <strong>de</strong>finitiva, los mayores volúmenes <strong>de</strong> tráfico tienen lugar en Bilbao Metropolitano y en Donostia-San<br />
Sebastián don<strong>de</strong> se superan en el año 2002 y 2003 los 80.000 vehículos / día. En torno a Vitoria-Gasteiz, los<br />
tráficos son menores, variando entre 40.000 vehículos / día y 80.000 vehículos / día.<br />
Flujos <strong>de</strong> pesados<br />
De igual modo que en el caso anterior, se han agrupado <strong>la</strong>s estaciones <strong>de</strong> aforo según <strong>la</strong> intensidad <strong>de</strong><br />
tráfico <strong>de</strong> vehículos pesados en el año 2002 en primer lugar y en el 2003 a continuación, con objeto <strong>de</strong><br />
conocer aquellos cor<strong>red</strong>ores que soportan una mayor concentración <strong>de</strong> esta categoría <strong>de</strong> tráfico.<br />
FLUJOS DE TRÁFICO DE PESADOS EN LA RED FUNCIONAL<br />
AÑO 2002<br />
Estación Carretera P.K. Localidad más próxima<br />
IMD<br />
Pesados<br />
IMD entre 20.000 y 10.000 vehículos / día<br />
16 A-8 20,7 X <strong>de</strong> <strong>la</strong> Misericordia 14.431<br />
26 A A-8 - E. Juan Garai – Buia 1<strong>2.</strong>452<br />
178 A A-8 129,1 E. Cruces - E. Sestao 1<strong>2.</strong>322<br />
660 N-I 337 Boquete <strong>de</strong> Lapueb<strong>la</strong> 1<strong>2.</strong>164<br />
22 A A-8 188,3 E. Kastrexana - E. Sabino A. 1<strong>2.</strong>061<br />
21 A A-8 120,0 E. Cruces - E. Kastrexana 1<strong>2.</strong>049<br />
24 A A-8 116,7 E. Sabino A.- E. Juan Garai 11.922<br />
179 A A-8 126,5 E. Sestao - E. Portugalete 11.725<br />
40 N-I 348,9 Yurre 10.865<br />
180 A A-8 128 E. Portugalete - E. Santurtzi 10.808<br />
30 N-I 346,7 Crispijana / Krispiñana 10.550<br />
50 N-I 354,3 ETD 4 – Abetxuko 10.344<br />
IMD entre 10.000 y 5.000 vehículos / día<br />
12 N-I 437,8 Irura 9.612<br />
120 N-I 326,3 ETD 3 – Armiñón 9.356<br />
20 N-I 344 Aríñez 9.248<br />
257 A-8 A 0 Puente <strong>de</strong> Behobia 9.199<br />
60 N-I 356,4 Durana 8.713<br />
27 A A-8 112,9 Buia - E. Basauri 8.445<br />
247 Acceso N-I 2 En<strong>la</strong>ce <strong>de</strong> Aritzeta 8.399<br />
1 N-I 454,6 Frente a Coca – Co<strong>la</strong> 8.041<br />
230 N-I 387,5 ETD 5 – Egino 7.992<br />
220 N-I 382,7 Urabain 7.666<br />
70 N-I 359,8 Lubiano 7.663<br />
140 N-I 379,3 Mezkia 7.592<br />
43 A N-637 8,7 E. Cruces - E. Barakaldo 7.585<br />
168 N-I 416,4 Beasain 7.509<br />
90 N-I 371,6 Arrieta 7.431<br />
45 A N-637 9,7 Barakaldo - Lutxana / Asua 7.295<br />
80 N-I 365,8 Venta <strong>de</strong>l Patio 7.006<br />
206<br />
Revisión <strong>de</strong>l Segundo P<strong>la</strong>n General <strong>de</strong> Carreteras <strong>de</strong>l País Vasco
Estación Carretera P.K. Localidad más próxima<br />
IMD<br />
Pesados<br />
30 N-I 404,4 Puerto <strong>de</strong> Etxegarate 6.913<br />
200 N-I 378,7 Salvatierra o Agurain 6.783<br />
181 A A-8 131,7 E. Perto - E. S. Fuentes 6.695<br />
81 A BI-637 9,3 E. Erandio – Santimami 6.093<br />
46 A BI-637 - E. Kuku<strong>la</strong>rra – R. Erandio 5.806<br />
180 N-I 321,7 Límite Miranda <strong>de</strong> Ebro 5.349<br />
- AP-68 - Ziorroga – Altube 5.322<br />
182 A A-8 135,2 E. San Fuentes - E. La Arena 5.310<br />
- AP-68 10,3 Ugao / Miraballes – Arakaldo 5.140<br />
83 A BI-637 11,1 Santimami – Leioa 5.111<br />
IMD entre 5.000 y <strong>2.</strong>000 vehículos / día<br />
- AP-68 12,5 Arakaldo / Murueta 4.763<br />
- AP-68 - Llodio – Ziorroga 4.621<br />
- AP-68 15,7 Murueta / L.P. Á<strong>la</strong>va 4.621<br />
- A-8 108,5 Circunva<strong>la</strong>ción a Galdakao 4.555<br />
- AP-1 - Intercambiador <strong>de</strong> Miranda – Armiñón 4.552<br />
183 A A-8 139,1 E. La Arena - E. La Haya (L.P.) 4.547<br />
181 B N-644 - A-8 – Puerto Santurtzi 4.501<br />
- A-8 103,7 Erletxe – Boroa 4.349<br />
113 A N-634 82,9 La Pi<strong>la</strong>stra - E. Iurreta 4.283<br />
121 N-I 325,5 Puente Nuevo 4.282<br />
3 N-I 473 Final Gaintxurizketa 4.249<br />
248 A-8 25,2 En<strong>la</strong>ce <strong>de</strong> Aritzeta 4.208<br />
251 A-8 69,5 Eibar – Elgoibar 4.182<br />
154 A BI-625 384,9 E. Basauri - Moyordín (Arrigorriaga) 4.138<br />
134 N-I5 147,8 Túnel <strong>de</strong> Be<strong>la</strong>bieta 4.133<br />
28 A AP-68 1,7 Buia – Arrigorriaga 4.027<br />
84 A BI-637 - Leioa – Artatza 3.988<br />
36 N-I 469,1 Recta <strong>de</strong> Lintzirin 3.921<br />
23 A Acceso A-8 - En<strong>la</strong>ce Sabino Arana 3.845<br />
108 A N-634 103,5 Irubi<strong>de</strong> – Galdakao 3.841<br />
45 C N-637 11,6 E. Kuku<strong>la</strong>rra - Enekuri (BI-604) 3.808<br />
- A-8 105,1 Galdakao – Erletxe 3.777<br />
Estación Carretera P.K. Localidad más próxima<br />
IMD<br />
Pesados<br />
87 N-636 7 Cruce <strong>de</strong> Ezkio 3.696<br />
109 A N-634 100,2 Galdakao - El Gallo 3.657<br />
844 N-622 8,6 Kas 3.605<br />
112 A N-634 83,7 Amorebieta - E. La Pi<strong>la</strong>stra 3.598<br />
110 A N-634 98,5 El Gallo – Erletxe 3.566<br />
10169 N-636 2,1 Ormaiztegi 3.536<br />
- A-8 95,8 Etxano – Iurreta 3.526<br />
89 GI-627 39,4 Cruce <strong>de</strong> San Pru<strong>de</strong>ntzio 3.524<br />
163 A N-240 11,8 El Gallo – Bedia 3.505<br />
100 N-622 12,9 Letona 3.479<br />
271 A-8 72 Azitain / Ermua 3.434<br />
111 A N-634 93,9 Erletxe - Amorebieta O. 3.358<br />
- A-8 98,9 Amorebieta / Etxano 3.354<br />
155 A BI-625 383,6 Moyordín - E. Arrigorriaga 3.343<br />
164 A N-240 - Bedia – Lemoa 3.314<br />
- A-8 87,4 Iurreta – Zaldibar 3.264<br />
61 N-240 4,7 Gamarra Mayor 3.169<br />
840 N-622 7 ETD 1 - En<strong>la</strong>ce <strong>de</strong> Etxabarri Viña 3.165<br />
107 A N-634 104 Etxebarri – Irubi<strong>de</strong> 3.108<br />
98 D N-637 19,7 Derio – Zamudio <strong>2.</strong>993<br />
11 N-634 61,5 Eibar <strong>2.</strong>842<br />
99 A N-637 12,8 E. Asua (BI-604) - TT. Artxanda <strong>2.</strong>834<br />
165 A N-240 20,6 Lemoa – Igorre <strong>2.</strong>819<br />
113 B N-634 - E. Iurreta – Durango <strong>2.</strong>819<br />
99 C N-637 - Túneles Artxanda - E. Larrondo <strong>2.</strong>815<br />
110 B N-637 - Erletxe – Larrabetzu <strong>2.</strong>754<br />
69 GI-131 9 Parada Bus Carabel <strong>2.</strong>712<br />
99 E N-637 - E. Larrondo - E. Derio (N-633) <strong>2.</strong>705<br />
32 A N-634 116,8 Burtzeña – Zorrotza <strong>2.</strong>615<br />
590 N-124 35,2 Salinil<strong>la</strong>s <strong>de</strong> Buradón <strong>2.</strong>612<br />
592 N-124 30,7 Zambrana <strong>2.</strong>593<br />
84 D BI-637 13,9 Artatza – Bolue <strong>2.</strong>562<br />
1 A N-634 - Ibarsusi – Etxebarri <strong>2.</strong>516<br />
207<br />
Revisión <strong>de</strong>l Segundo P<strong>la</strong>n General <strong>de</strong> Carreteras <strong>de</strong>l País Vasco
Estación Carretera P.K. Localidad más próxima<br />
IMD<br />
Pesados<br />
1070 A-625 371 Llodio (Bilbao) <strong>2.</strong>452<br />
165 C N-240 - Igorre – Arantzazu <strong>2.</strong>442<br />
118 A N-637 22,6 Zamudio – Lezama <strong>2.</strong>437<br />
31 A N-634 - Zorrotza – Basurto <strong>2.</strong>388<br />
19 A N-634 115,5 Basurto – Kastrexana <strong>2.</strong>388<br />
166 A N-240 - Arantzazu - Bildoso<strong>la</strong> (BI-3530) <strong>2.</strong>347<br />
111 N-240 15 Legutiano <strong>2.</strong>282<br />
118 B N-637 - Lezama - Vte. Larrabetzu <strong>2.</strong>270<br />
119 A N-637 29,3 Vte. Larrabetzu <strong>2.</strong>250<br />
122 N-124 26,5 Cadiñanos <strong>2.</strong>249<br />
1060 A-625 360,2 Amurrio (Llodio) <strong>2.</strong>188<br />
55 A BI-636 7,2 Kastrexana – Alonsotegi <strong>2.</strong>170<br />
114 A N-634 79,2 Durango – Matiena <strong>2.</strong>157<br />
51 N-622 4,5 Puente Zadorra <strong>2.</strong>056<br />
156 A BI-625 - BI-712 - Ugao (Miraballes) <strong>2.</strong>050<br />
102 N-622 23,3 ETD 2 - Peaje AP-68 Altube <strong>2.</strong>048<br />
36 A N-634 119,7 Ugarte – Retuerto <strong>2.</strong>046<br />
98 C N-633 - Derio – Al<strong>de</strong>kone (Aeropuerto) <strong>2.</strong>039<br />
IMD inferior a <strong>2.</strong>000 vehículos / día<br />
32 C N-634 117,2 Burtzeña – Cruces 1.986<br />
157 A BI-625 380,6 Arrigorriaga - Miraballes (Ugao) 1.974<br />
86 B BI-637 16,5 Bolue – Kurtxes (Berango) 1.973<br />
158 GI-631 15,9 Loyo<strong>la</strong> 1.973<br />
166 B N-240 - Int. BI-3530 – Zeanuri 1.960<br />
21 B BI-636 4,2 E. A-8 – Kastrexana 1.956<br />
158 B BI-625 - E. Areta Norte – Areta 1.956<br />
158 A BI-625 - Arrankudiaga - E. Areta Norte 1.917<br />
157 C BI-625 - Miraballes (Ugao) – Arrankudiaga 1.872<br />
45 B Acceso N-637 11,2 E. Lutxana / Asua 1.844<br />
168 C N-240 - Zeanuri – Barazar 1.836<br />
55 C BI-636 - Solución Sur (A-8) – Kastrexana 1.830<br />
- AP-68 - Altube – Subijana 1.820<br />
- AP-68 - Subijana – AP-1 1.815<br />
Estación Carretera P.K. Localidad más próxima<br />
IMD<br />
Pesados<br />
175 A N-636 35,1 Abadiño – Apatamonasterio 1.794<br />
169 B N-240 40,5 Zubizabal - L.P. (Ubi<strong>de</strong>a) 1.787<br />
168 A N-240 - Int. BI-3530 – Zeanuri 1.772<br />
169 A N-240 - Barazar – Zubizabal 1.757<br />
176 A N-636 - Apatamonasterio - Vte. Elorrio 1.724<br />
300 N-240 21,5 Ubi<strong>de</strong>a 1.637<br />
126 A BI-635 34,6 Vista Alegre – Gernika 1.590<br />
36 B N-634 - Ugarte – Zabal<strong>la</strong> 1.590<br />
78 C BI-604 6 Enekuri – Kuku<strong>la</strong>rra / Txoriherri 1.580<br />
97 A BI-631 3,1 Orueta – Santo Domingo 1.560<br />
164 B BI-635 - Lemoa – Amorebieta 1.555<br />
2 A N-634 - Ibarsusi – Bolueta 1.547<br />
52 GI-627 22,3 Puerto <strong>de</strong> Ar<strong>la</strong>bán 1.544<br />
6 A BI-631 - S. Sur (A-8) – Miraflores 1.542<br />
1051 A-627 13,1 Urbina 1.519<br />
35 A N-634 118,9 Retuerto – Cruces 1.518<br />
4 B N-634 - Bolueta – Miraflores 1.506<br />
160 A BI-625 - Laudio – Luxaondo 1.505<br />
40 C N-634 128,8 El Casal - Las Carreras 1.451<br />
55 N-634 29,9 Arrona 1.418<br />
115 A N-634 - Matiena – O<strong>la</strong>kueta 1.416<br />
41 A N-634 - Muskiz – Las Carreras 1.391<br />
101 G BI-631 17,4 Variante Mungia 1.365<br />
133 N-636 33,9 Epele – Kanpazar 1.351<br />
171 A BI-623 - Durango – Izurtza 1.351<br />
40 A N-634 127,1 El Casal – Nocedal 1.323<br />
172 A BI-623 31,1 Izurtza – Mañaria 1.315<br />
111 B BI-635 - Amorebieta – Zugaztieta 1.309<br />
125 A BI-635 - Zugaztieta – Vista Alegre 1.308<br />
256 N-I 481,5 Behobia 1.298<br />
124 A BI-635 - E. Amorebieta – Zugaztieta 1.295<br />
14 A BI-604 - Deusto – Enekuri 1.295<br />
78 A BI-604 4,8 Enekuri – Deusto 1.295<br />
208<br />
Revisión <strong>de</strong>l Segundo P<strong>la</strong>n General <strong>de</strong> Carreteras <strong>de</strong>l País Vasco
Estación Carretera P.K. Localidad más próxima<br />
IMD<br />
Pesados<br />
161 A BI-625 - Luxaondo – Amurrio 1.216<br />
180 B Acceso A-8 - E. Santurtzi – Kabietzes 1.211<br />
115 D N-634 73,6 O<strong>la</strong>kueta – Zaldibar 1.208<br />
1071 A-625 369 Llodio (Amurrio) 1.201<br />
174 A N-636 - Durango – Abadiño 1.197<br />
11 N-104 355,5 Arkaute 1.183<br />
45 N-634 54,4 Salida <strong>de</strong> Altzo<strong>la</strong> 1.160<br />
98 A BI-631 4,4 Santo Domingo – N-633 (Galbarriatu) 1.151<br />
117 D N-634 65,7 Ermua - L.P. Gipuzkoa 1.142<br />
1050 A-627 17,7 Landa 1.124<br />
117 A N-634 - Areitio – Ermua 1.115<br />
116 A N-634 70,1 Zaldibar – Areitio 1.090<br />
93 GI-2132 10,2 Benta – Astigarraga 1.075<br />
- AP-68 - AP-1 – Miranda <strong>de</strong> Ebro 1.058<br />
87 A BI-634 19,3 Berango – Larrabasterra 1.050<br />
143 A BI-633 - Ormaiztegi – Bi<strong>de</strong>barrieta 1.046<br />
56 A BI-636 - Alonsotegi – Zaramillo 1.030<br />
131 GI-2634 33,7 Túnel <strong>de</strong> Azkarateko 1.018<br />
176 C N-636 - Elorrio O. - L.P. (Pto. Kanpazar) 1.015<br />
44 B Acceso N-637 - E. Barakaldo (Barakaldo – BI) 975<br />
143 C BI-633 35,1 Bi<strong>de</strong>barrieta – Gomezeaga 973<br />
258 Acceso N-I 0,7 Puente <strong>de</strong> Santiago 963<br />
38 A N-634 - Trapagarán – Ortuel<strong>la</strong> 934<br />
114 B BI-633 - Matiena – Bi<strong>de</strong>barrieta (Berriz) 928<br />
126 C BI-2235 - Gernika – Murueta 897<br />
56 B BI-636 - Zaramillo - La Cuadra 896<br />
44 A Acceso N-637 - E. Barakaldo (BI – Barakaldo) 896<br />
1064 A-625 360 Circunva<strong>la</strong>ción <strong>de</strong> Amurrio 891<br />
39 A N-634 - Nocedal – Ortuel<strong>la</strong> 875<br />
79 C BI-2704 8,4 Asua – Loiu 874<br />
91 A BI-2704 - Asua – Loiu 874<br />
79 A BI-604 - Asua – E. Kuku<strong>la</strong>rra 872<br />
40 N-634 24,7 Getaria 863<br />
Estación Carretera P.K. Localidad más próxima<br />
IMD<br />
Pesados<br />
59 A BI-636 - Artxube – L<strong>la</strong>ntada 861<br />
1170 A-2122 34,7 Zubil<strong>la</strong>ga 843<br />
88 A BI-634 20,9 Larrabasterra – Sope<strong>la</strong>na 821<br />
155 C Acceso AP-68 - Salida <strong>de</strong> AP-68 (BI-625) 811<br />
1 B BI-631 - Ibarsusi – Santo Domingo 797<br />
145 C BI-633 - Iruzubieta – Vte. Markina 796<br />
62 A-2134 7,9 Zurbano 787<br />
176 E N-636 - Vte. Elorrio - E. Elorrio 779<br />
144 A BI-633 - Gomezeaga – Pto. Trabakua 775<br />
176 F N-636 - E. Elorrio – Elorrio 755<br />
5 A N-634 - Miraflores – Arenal 743<br />
145 A BI-633 - Arrangizgana – Iruzubieta 738<br />
155 B Acceso AP-68 - Entrada a AP-68 (BI-625) 725<br />
1063 A-625 358,2 Amurrio 723<br />
821 A-624 30,9 Cruce <strong>de</strong> Urquillo 715<br />
37 A N-634 122,2 Trapagarán - San Andrés 700<br />
1061 A-625 356 Saratxo 694<br />
147 B BI-633 - Iruzubieta – Vte. Markina 690<br />
44 D Acceso N-637 - E. Barakaldo (Rontegi – Barakaldo) 658<br />
57 A BI-636 13,8 La Cuadra – Sodupe 655<br />
147 A BI-633 - Vte. Markina – Urberuaga 639<br />
159 A BI-2522 - Areta – E. Areta Sur 639<br />
44 C Acceso N-637 - E. Barakaldo (Barakaldo – Rontegi) 634<br />
80 C N-633 - BI-631 – Aeropuerto 623<br />
60 A BI-636 - L<strong>la</strong>ntada - Balmaseda N. 622<br />
148 A BI-633 - Urberuaga – P<strong>la</strong>zako<strong>la</strong> 612<br />
149 A BI-633 - Berriatua – Ondarroa 605<br />
57 C BI-636 - Sodupe – Artxube 578<br />
490 A-2126 59,1 Oyón (L.P. Logroño) 576<br />
101 D BI-631 - Mungia – Larrauri 571<br />
128 A BI-2235 - Gernika – Murueta 570<br />
12 N-I32 4,9 Ascarza 561<br />
791 A-2522 47 Llodio (Orozco) 560<br />
209<br />
Revisión <strong>de</strong>l Segundo P<strong>la</strong>n General <strong>de</strong> Carreteras <strong>de</strong>l País Vasco
Estación Carretera P.K. Localidad más próxima<br />
IMD<br />
Pesados<br />
130 B BI-2235 - Mundaka – Bermeo 547<br />
88 C BI-2122 - Sope<strong>la</strong>na - Barrika 534<br />
148 C BI-633 - P<strong>la</strong>zako<strong>la</strong> – Berriatua 533<br />
42 A N-634 136,1 Muskiz - L.P. Cantabria 532<br />
149 C BI-638 - Ondarroa – L.P. (Deba) 528<br />
128 B BI-2235 - Murueta – Busturia 522<br />
82 GI-2630 14,6 Salida hacía Udana 520<br />
129 A BI-2235 - Busturia – Sukarrieta 519<br />
104 B BI-2235 - Bermeo – Mundaka 518<br />
130 A BI-2235 - Sukarrieta – Mundaka 510<br />
88 B BI-634 - Sope<strong>la</strong>na – Urduliz 507<br />
770 A-624 40 Larrimbe 491<br />
101 E BI-2121 - Mungia – Soietxe 487<br />
61 C BI-636 - La Pinil<strong>la</strong> – Vil<strong>la</strong>sana 468<br />
95 B BI-634 - Gatika – Mungia 458<br />
101 B BI-634 - Mungia – Gatika 458<br />
172 B BI-623 - Mañaria – Urkio<strong>la</strong> 453<br />
161 B BI-625 - Amurrio – Vitoria-Gasteiz 453<br />
127 A BI-2238 - Gernika – Kortezubi 451<br />
147 C BI-633 - Vte. Markina 447<br />
350 N-104 358,8 Matauco 440<br />
1200 N-I32 8,7 Andollu 435<br />
41 C BI-2701 - Muskiz – El Arenao 434<br />
670 A-2622 12,5 Nanc<strong>la</strong>res <strong>de</strong> <strong>la</strong> Oka 420<br />
67 A BI-2701 - Muskiz – El Arenao 414<br />
131 A BI-2238 - Kortezubi – Gauztegiz 412<br />
177 C BI-2522 - E. Areta Sur – Orozko 403<br />
61 A BI-636 - Balmaseda - La Pinil<strong>la</strong> 398<br />
162 A BI-625 - Amurrio – Orduña 390<br />
173 B BI-623 - Otxandio - L.P. (Á<strong>la</strong>va) 384<br />
920 A-2122 42,8 Puente<strong>la</strong>rrá 377<br />
94 B BI-634 - Urduliz – Elortza 376<br />
173 A BI-623 - Urkio<strong>la</strong> – Otxandio 372<br />
Estación Carretera P.K. Localidad más próxima<br />
IMD<br />
Pesados<br />
54 C N-639 - La Cuesta - El Casal 370<br />
150 N-I32 22,3 Azatzeta 366<br />
68 A BI-2701 - El Arenao – Merkadillo (Sopuerta) 354<br />
146 C BI-2636 - Etxebarria – Markina 346<br />
102 A BI-631 - Larrauri – Int. BI-3101 341<br />
48 GI-2135 59,1 Pasada recta Txamara 337<br />
72 A BI-2604 - Gor<strong>de</strong>xo<strong>la</strong> – Padura (Sodupe) 321<br />
117 C BI-2301 - Ermua - Arrangizgana 320<br />
123 A BI-2121 - Mungia – Soietxe 315<br />
97 GI-2120 62 Puente Nuevo Ataun 296<br />
134 B BI-2405 - Lekeito – Oleta 291<br />
420 N-I32 34,5 Antoñana 287<br />
69 A BI-2701 - Merkadillo – El Carral 279<br />
62 B BI-2701 - Ma<strong>la</strong>brigo – Reto<strong>la</strong> 278<br />
830 A-2521 23,8 Beluntza 275<br />
89 A BI-2122 - Barrika - Plentzia 274<br />
70 B BI-2701 - Reto<strong>la</strong> – Ma<strong>la</strong>brigo 270<br />
790 A-2522 36,6 Ziorraga 265<br />
94 C BI-634 - Elortza – Butroe 264<br />
89 B BI-2704 - Plentzia – Elortza (Urduliz) 262<br />
310 A-623 18,3 Límite Otxandio 261<br />
142 C BI-2405 - Oleta – Lekeito 259<br />
142 B BI-2405 - Oleta – Amoroto 258<br />
92 A BI-2704 - Loiu – Unbe 255<br />
500 N-124 75,5 Laserna 253<br />
123 C BI2121 - Soetxe – Fruiz 252<br />
430 N-I32 41,5 Sta. Cruz (Límite Navarra) 245<br />
70 A BI-2701 - Avel<strong>la</strong>neda – Reto<strong>la</strong> 244<br />
850 A-2604 55,5 Artziniega 240<br />
170 A BI-2543 - Igorre – Dima 238<br />
54 B N-639 - Zierbana - El Puerto (Zierbana) 236<br />
450 A-2620 31,2 Ibarra <strong>de</strong> Aramaio 234<br />
69 C BI-2701 - El Carral – Avel<strong>la</strong>neda 227<br />
210<br />
Revisión <strong>de</strong>l Segundo P<strong>la</strong>n General <strong>de</strong> Carreteras <strong>de</strong>l País Vasco
Estación Carretera P.K. Localidad más próxima<br />
IMD<br />
Pesados<br />
103 A BI-631 - Larrauri – Sollube 225<br />
104 A BI-631 - Sollube – Bermeo 224<br />
161 C BI-624 - Amurrio - Artziniega 217<br />
148 B BI-2405 - P<strong>la</strong>zako<strong>la</strong> – Oleta 215<br />
93 A BI-2704 - Unbe – Alto Unbe 214<br />
125 B BI-2121 - Vista Alegre – Muxika 211<br />
95 A BI-634 - Butroe – Gatika 206<br />
57 B BI-2604 - Sodupe – Padura 204<br />
62 C BI-630 - Ma<strong>la</strong>brigo – Herbosa 198<br />
165 B BI-2543 - Igorre – Dima 196<br />
134 A BI-2238 - Tres Cruces – Lekeito 196<br />
120 A BI-2713 - Larrabetzu – Astoreka 187<br />
93 C BI-2704 - Alto Unbe – BI-3724 (Ugeraga) 187<br />
177 A BI-2522 - Orozko – L.P. (Ziorraga) 185<br />
921 A-2122 47,3 Sobrón 184<br />
132 GI-2130 11,8 Caserío Sabiñone 183<br />
910 A-624 45,7 Respaldiza 181<br />
63 A BI-630 35 Herbosa – Artzentales 180<br />
580 N-124 42,5 Labastida 179<br />
62 A BI-630 - Balmaseda – Ma<strong>la</strong>brigo 178<br />
520 N-124 52,8 Ábalos 177<br />
800 A-2522 34,3 Baranbio 171<br />
72 C BI-2604 - Gor<strong>de</strong>xo<strong>la</strong> – L.P. (Artziniega) 170<br />
94 A BI-2704 - BI-3724 – Elortza (Urduliz) 167<br />
170 A-2130 5 Otazu 166<br />
510 N-124 61,1 Páganos 166<br />
64 A BI-630 - Artzentales – Turtzioz 164<br />
65 A BI-630 - Turtzioz – Ambasaguas 163<br />
1062 A-624 42,9 Amurrio 163<br />
121 B BI-2121 - Alto <strong>de</strong> Morga – Muxika 139<br />
144 B BI-2301 - Arrangizgana – Ermua 138<br />
122 A BI-2121 - Fruiz – Errigoitiolea 138<br />
131 C BI-2238 - Gauztegiz – Atxoste (Muruetagana) 126<br />
Estación Carretera P.K. Localidad más próxima<br />
IMD<br />
Pesados<br />
127 C BI-2224 - Gernika – Uarka 126<br />
132 A BI-2238 - Atxoste – Basetxea 123<br />
911 A-624 49 Menagaray 122<br />
680 A-2622 16,5 Montevite 111<br />
66 C N-629 - Lanestosa – L.P. (Ramales) 109<br />
65 B BI-630 - Ambasaguas - L.P. (Ramales) 104<br />
20 B Acceso A-8 - Kastrena – A-8 102<br />
122 B BI-2121 - Errigoitiolea – Morga 101<br />
900 A-2604 1 Gordéliz (Artziniega) 98<br />
922 A-2625 321 Bergüenda 97<br />
121 A BI-2121 - Morga – Alto <strong>de</strong> Morga 93<br />
440 N-126 39 Genevil<strong>la</strong> 92<br />
133 A BI-2238 - Basetxea – Tres Cruces 91<br />
640 A-2124 3,7 Castillo 84<br />
66 B N-629 - Lanestosa – L.P. (Bercedo) 81<br />
380 A-2128 27,3 Opacua 78<br />
120 C BI-2713 - Astoreka – Alto <strong>de</strong> Morga 77<br />
145 B BI-2224 - Bolívar – Iruzubieta 74<br />
64 B BI-2617 - Turtioz – L.P. Cantabria 72<br />
662 N-126 18,5 Añastro (Condado <strong>de</strong> Treviño) 71<br />
721 A-2625 346,2 Puerto Orduña 68<br />
820 A-624 25 Altube 64<br />
162 B BI-2625 - Orduña – L.P. Burgos 63<br />
1210 A-2622 33,5 Tuesta 61<br />
146 A BI-2636 - L.P. (Elgoibar) – Etxebarria 56<br />
160 A-2124 9,5 Puerto Vitoria 56<br />
700 A-2622 22,8 Paúl 55<br />
720 A-2625 334,8 Osma 50<br />
480 A-2126 53,5 Yécora 50<br />
760 A-2521 30 Unzá 46<br />
140 A BI-2224 - Ibartxu – Arbatzegi 44<br />
740 A-2622 40 Guren<strong>de</strong>s 44<br />
902 A-2604 4,5 Gordéliz (Peña Angulo) 43<br />
211<br />
Revisión <strong>de</strong>l Segundo P<strong>la</strong>n General <strong>de</strong> Carreteras <strong>de</strong>l País Vasco
Estación Carretera P.K. Localidad más próxima<br />
IMD<br />
Pesados<br />
923 A-2625 318,9 Puente<strong>la</strong>rrá 43<br />
61 B BI-624 - La Pinil<strong>la</strong> - Artziniega 40<br />
140 C BI-2224 - Arbatzegi – Bolibar 38<br />
630 A-2124 15,8 Peñacerrada (a Vitoria) 36<br />
173 C BI-2543 - Dima – Otxandio 35<br />
320 A-2620 17,3 Puerto Cruceta 31<br />
903 A-624 57 Artziniega (Balmaseda) 27<br />
390 A-2128 38 Puerto Opacua 25<br />
722 A-2625 34 Cárcamo 23<br />
471 N-126 39,5 Bernedo (Límite Navarra) 18<br />
432 A-2128 39,4 Santa Cruz 16<br />
470 A-2126 42 Puerto Bernedo 14<br />
400 A-2128 55,8 Contrasta 13<br />
750 A-2622 51,5 Tobil<strong>la</strong>s 13<br />
462 N-126 36 Navarrete 12<br />
473 N-126 41,8 Angostina 9<br />
540 A-2124 26,0 Puerto Herrera 0<br />
Fuente: E<strong>la</strong>boración propia a partir <strong>de</strong> los datos <strong>de</strong> <strong>la</strong>s Diputaciones Forales <strong>de</strong> Á<strong>la</strong>va, Gipuzkoa y Bizkaia.<br />
Nota: Las estaciones <strong>de</strong> aforo tipo ETD en Á<strong>la</strong>va, son estaciones <strong>de</strong>nominadas “Estaciones <strong>de</strong> Toma <strong>de</strong> Datos”, correspondiendo <strong>la</strong><br />
recopi<strong>la</strong>ción <strong>de</strong> los datos a <strong>la</strong> Jefatura <strong>de</strong> Tráfico.<br />
Las conclusiones obtenidas en este caso son <strong>la</strong>s que a continuación se exponen:<br />
√ Las mayores intensida<strong>de</strong>s <strong>de</strong> tráfico <strong>de</strong> vehículos pesados (entre 20.000 vehículos pesados / día y<br />
10.000 vehículos pesados / día), tienen lugar en <strong>la</strong> Autopista A-8 (Autopista <strong>de</strong>l Cantábrico),<br />
concretamente en el Territorio Histórico <strong>de</strong> Gipuzkoa, con una estación <strong>de</strong> aforo a su paso por Donostia-<br />
San Sebastián y en Bizkaia con siete estaciones <strong>de</strong> aforo en el entorno <strong>de</strong> Bilbao y, en algunos tramos <strong>de</strong><br />
<strong>la</strong> Autovía <strong>de</strong>l Norte N-I en <strong>la</strong> circunva<strong>la</strong>ción <strong>de</strong> <strong>la</strong> capital a<strong>la</strong>vesa.<br />
√ En segundo lugar, con una IMD <strong>de</strong> vehículos pesados comprendida entre los valores <strong>de</strong> 10.000<br />
vehículos pesados / día y 5.000 vehículos pesados / día, se encuentran en su mayoría tramos <strong>de</strong> <strong>la</strong><br />
antigua carretera Madrid - Irun N-I: entre Lasarte / Oria y Donostia-San Sebastián (Gipuzkoa); en<br />
Beasain y Vil<strong>la</strong>bona (Gipuzkoa); en <strong>la</strong>s proximida<strong>de</strong>s <strong>de</strong> Vitoria-Gasteiz (Á<strong>la</strong>va); en torno al núcleo urbano<br />
<strong>de</strong> Salvatierra (Á<strong>la</strong>va) y los límites <strong>de</strong> los Territorios Históricos <strong>de</strong> Gipuzkoa y Á<strong>la</strong>va con <strong>la</strong>s provincias <strong>de</strong><br />
Navarra y Burgos respectivamente. En <strong>la</strong> Autopista A-8 (Autopista <strong>de</strong>l Cantábrico) también se localizan<br />
tramos con <strong>la</strong> IMD <strong>de</strong> pesados entre los valores consi<strong>de</strong>rados. Estos tramos coinci<strong>de</strong>n con el final <strong>de</strong> <strong>la</strong><br />
autopista en el límite con <strong>la</strong> frontera francesa, cerca <strong>de</strong> Basauri y entre Bilbao y el límite con <strong>la</strong> provincia<br />
<strong>de</strong> Cantabria. La Autopista <strong>de</strong> Peaje Vasco Aragonesa AP-68, también consta <strong>de</strong> un tráfico <strong>de</strong> pesados<br />
con valores comprendidos entre los consi<strong>de</strong>rados. Son los tramos entre <strong>la</strong>s localida<strong>de</strong>s <strong>de</strong> Ziorroga y<br />
Altube y entre Ugao / Miraballes y Arakaldo. Finalmente, <strong>de</strong> <strong>la</strong> Red <strong>de</strong> Interés Preferente, el Cor<strong>red</strong>or<br />
Rontegi <strong>de</strong> <strong>la</strong> carretera N-637, también tiene una IMD <strong>de</strong> vehículos pesados entre estos dos valores.<br />
De <strong>la</strong> Red Básica, únicamente <strong>la</strong> carretera BI-637 presenta un tráfico <strong>de</strong> pesados elevado, entre <strong>la</strong><br />
continuación <strong>de</strong>l cor<strong>red</strong>or Rontegi y <strong>la</strong> localidad <strong>de</strong> Leioa.<br />
√ Atendiendo a los tramos <strong>de</strong> carreteras con una intensidad <strong>de</strong> vehículos pesados inferior a <strong>2.</strong>000<br />
vehículos pesados / día y superior a 1.000 vehículos pesados / día, se observa que <strong>la</strong>s carreteras<br />
incluidas en este grupo son, <strong>de</strong> <strong>la</strong> Red <strong>de</strong> Interés Preferente, <strong>la</strong> Autopista <strong>de</strong> Peaje Vasco Aragonesa AP-<br />
68 (entre Altube y Miranda <strong>de</strong> Ebro); <strong>la</strong> Autovía <strong>de</strong>l Norte N-I (en el límite con <strong>la</strong> frontera francesa); <strong>la</strong><br />
carretera <strong>de</strong> Donostia-San Sebastián a Santan<strong>de</strong>r N-634 en tramos <strong>de</strong> Bilbao Metropolitano ente Gal<strong>la</strong>rta<br />
y Basauri, entre Zaldibar y Ermua, y a su paso por <strong>la</strong>s localida<strong>de</strong>s <strong>de</strong> Zumaia y Mendaro; <strong>la</strong> carretera N-<br />
636 ( <strong>de</strong> Beasain a Durango por Kanpazar) entre Durango y Epele – Kanpazar; <strong>la</strong> carretera N-240 (<strong>de</strong><br />
Tarragona a Bilbao por el puerto <strong>de</strong> Barazar) entre Artea y el límite con el Territorio Histórico <strong>de</strong> Á<strong>la</strong>va y<br />
<strong>la</strong> carretera N-104.<br />
De <strong>la</strong> Red Básica, se incluyen <strong>la</strong>s carreteras <strong>de</strong> Á<strong>la</strong>va A-627 (<strong>de</strong> Vitoria-Gasteiz a Eibar) entre Urbina y<br />
Landa y A-625 (Orduña - Bilbao) en Llodio. Del Territorio Histórico <strong>de</strong> Gipuzkoa, <strong>la</strong>s carreteras GI-631<br />
(Zumaia – Zumarraga) en Loyo<strong>la</strong> y GI-627 (<strong>de</strong> Vitoria-Gasteiz a Eibar) en el Puerto <strong>de</strong> Ar<strong>la</strong>bán.<br />
Finalmente, <strong>de</strong>ntro <strong>de</strong> esta categoría <strong>de</strong> <strong>red</strong>, <strong>la</strong> mayoría <strong>de</strong> <strong>la</strong>s carreteras incluidas pertenecen al<br />
Territorio Histórico <strong>de</strong> Bizkaia. Son <strong>la</strong>s carreteras BI-636 (Bilbao – Reinosa) entre <strong>la</strong> localidad <strong>de</strong><br />
Zaramillo y <strong>la</strong> intersección con <strong>la</strong> A-8; <strong>la</strong> carretera BI-623 (<strong>de</strong> Vitoria-Gasteiz a Durango) entre<br />
Durango y Mañaria; <strong>la</strong> BI-637 (Erandio – Berango) cerca <strong>de</strong> <strong>la</strong> localidad <strong>de</strong> Berango; <strong>la</strong> BI-635 (Lemoa<br />
- Gernika-Lumo) en los tramos comprendidos entre Gernika-Lumo y Markina y entre Amorebieta /<br />
Etxano y Lemoa; <strong>la</strong> BI-604 (<strong>de</strong> Bilbao a Asua por Enekuri) en Enekuri; <strong>la</strong> carretera BI-631 (Variante<br />
este <strong>de</strong> Bilbao) en Bilbao Metropolitano y en <strong>la</strong> variante <strong>de</strong> Mungia; <strong>la</strong> carretera BI-633 (<strong>de</strong> Durango a<br />
Ondarroa por Trabakua) en Ormaiztegi – Bi<strong>de</strong>barrieta, <strong>la</strong> BI-634 (Berango – Mungia) entre Berango y<br />
Larrabasterra y finalmente <strong>la</strong> carretera BI-625 (Areta - Bilbao).<br />
Por último, con menos <strong>de</strong> 1.000 vehículos pesados / día, <strong>la</strong>s carreteras <strong>de</strong> <strong>la</strong> Red <strong>de</strong> Interés<br />
Preferente incluidas son: <strong>la</strong> N-636 (<strong>de</strong> Beasain a Durango por Kanpazar) en <strong>la</strong> variante <strong>de</strong> Elorrio; <strong>la</strong>s<br />
carreteras N-633 y N-639 <strong>de</strong> acceso al Aeropuerto <strong>de</strong> Loiu y al Puerto <strong>de</strong> Bilbao respectivamente; <strong>la</strong><br />
carretera N-634 (Donostia-San Sebastián – Santan<strong>de</strong>r – A Coruña), don<strong>de</strong> en algunos tramos <strong>de</strong>l<br />
212<br />
Revisión <strong>de</strong>l Segundo P<strong>la</strong>n General <strong>de</strong> Carreteras <strong>de</strong>l País Vasco
trazado que atraviesa el Bilbao Metropolitano <strong>la</strong> IMD <strong>de</strong> pesados es inferior a este valor; <strong>la</strong> N-629<br />
(Colindres – Trespa<strong>de</strong>rne) en Lanestosa, y <strong>la</strong> N-104 (<strong>de</strong> Vitoria-Gasteiz a N-I, dirección Francia) en<br />
Matauco.<br />
De <strong>la</strong> Red Básica, ninguna carretera <strong>de</strong>l Territorio Histórico <strong>de</strong> Gipuzkoa presenta un tráfico <strong>de</strong><br />
pesados inferior a 1.000 vehículos pesados / día. En Á<strong>la</strong>va, son seis <strong>la</strong>s carreteras incluidas en este<br />
grupo: <strong>la</strong>s carreteras N-126 (<strong>de</strong> Límite con Navarra a Límite con Condado <strong>de</strong> Treviño); N-124 (<strong>de</strong><br />
Briñas a Logroño por Laguardia); N-I32 (Lumbier por Tafal<strong>la</strong> y Estel<strong>la</strong>); A-623 (Vitoria-Gasteiz -<br />
Durango), <strong>la</strong> carretera A-625 (Orduña - Bilbao) en <strong>la</strong> circunva<strong>la</strong>ción <strong>de</strong> Amurrio y <strong>la</strong> A-624 (Altube -<br />
Balmaseda) <strong>de</strong>s<strong>de</strong> Amurrio hasta Artziniega. Por último, en el Territorio Histórico <strong>de</strong> Bizkaia son nueve<br />
<strong>la</strong>s carreteras: <strong>la</strong> carretera BI-633 (<strong>de</strong> Durango a Ondarroa por Trabakua) en Matiena y <strong>de</strong>s<strong>de</strong><br />
Iruzubieta hasta Ondarroa, <strong>la</strong> carretera BI-636 (Bilbao – Reinosa) <strong>de</strong>s<strong>de</strong> Zaramillo a Balmaseda, <strong>la</strong> BI-<br />
604 (<strong>de</strong> Bilbao a Asua por Enekuri) en Asua; <strong>la</strong> BI-631 (Bermeo – A-8) <strong>de</strong>s<strong>de</strong> Mungia (pasada <strong>la</strong><br />
variante) hasta Bermeo y en Ibarsusi (Bilbao Metropolitano); <strong>la</strong> BI-625 (Areta – Bilbao) en Orduña; <strong>la</strong><br />
BI-624 (Altube – Balmaseda) <strong>de</strong>s<strong>de</strong> La Pinil<strong>la</strong> hasta Amurrio y <strong>la</strong>s carreteras BI-638 (Deba -<br />
Ondarroa); BI-623 (Vitoria-Gasteiz - Durango); BI-634 (Berango – Mungia) y BI-630 (Balmaseda –<br />
Carranza).<br />
Finalmente, <strong>la</strong> mayoría <strong>de</strong> <strong>la</strong>s carreteras cuyo tráfico <strong>de</strong> pesados no supera los 1.000 vehículos<br />
pesados / día son carreteras <strong>de</strong> <strong>la</strong> Red Comarcal: en el Territorio Histórico <strong>de</strong> Gipuzkoa <strong>la</strong>s carreteras<br />
GI-2630 (Zumarraga – Arrasate / Mondragón) en Oñati y GI-2130 (Tolosa – Límite con Navarra) en<br />
Berasategi, en el Territorio Histórico <strong>de</strong> Bizkaia, <strong>la</strong> carretera BI-2713 (Larrabetzu – Alto <strong>de</strong> Gerekiz) a<br />
su paso por el núcleo urbano <strong>de</strong> Gaztelumendi y <strong>la</strong>s carreteras BI-2704 (Asua – Plentzia), BI-2701<br />
(Muskiz – Ma<strong>la</strong>brigo por Sopuerta), BI-2636 (Elgoibar – Límite con Gipuzkoa), BI-2617 (Vil<strong>la</strong>ver<strong>de</strong> <strong>de</strong><br />
Trucios – Agüera), BI-2604 (Sodupe – Límite con Á<strong>la</strong>va), BI-2543 (Igorre - Otxandio por Dima), BI-<br />
2522 (Llodio – Límite con Á<strong>la</strong>va), BI-2405 (P<strong>la</strong>zako<strong>la</strong> – Lekeito), BI-2238 (Gernika-Lumo - Lekeito), BI-<br />
2235 (Gernika-Lumo – Bermeo), BI-2224 (Gernika-Lumo - Markina / Xemein), <strong>la</strong> BI-2121 (Mungia -<br />
Ugarte / Muxika), <strong>la</strong> BI-2122 (Sope<strong>la</strong>na – Plentzia) y <strong>la</strong> carretera BI-2625 (Pancorbo – Orduña). Por<br />
último en el Territorio Histórico <strong>de</strong> Á<strong>la</strong>va, <strong>la</strong>s carreteras que se incluyen en este grupo son: <strong>la</strong> A-2625<br />
(Bergüenda – Orduña), A-2622 (Nanc<strong>la</strong>res <strong>de</strong> Oka – Límite con Burgos), A-2620 (Legutiano – Arrasate<br />
/ Mondragón), A-2604 (Gor<strong>de</strong>liz – Límite con Bizkaia), A-2522 (Ziorraga – Límite con Bizkaia), A-2521<br />
(Altube – Orduña), A-2134 (Vitoria-Gasteiz), A-2130 (Aretxabaleta – Ascarza en Vitoria-Gasteiz), A-<br />
2128 (Santa Cruz <strong>de</strong> Kanpezo – Salvatierra), A-2126 (Oyón / Oion – Bernedo), A-2124 (Vitoria-Gasteiz<br />
- Leza), y <strong>la</strong> carretera A-2122 (Zubil<strong>la</strong>ga – Sobrón).<br />
Para el año 2003 el flujo <strong>de</strong> vehículos pesados es el que aparece en <strong>la</strong> tab<strong>la</strong> adjunta, <strong>de</strong>biendo seña<strong>la</strong>r que<br />
no se han dispuesto <strong>de</strong> datos <strong>de</strong> aforos <strong>de</strong> vehículos pesados en todas <strong>la</strong>s estaciones <strong>de</strong> <strong>la</strong> Red Funcional.<br />
FLUJOS DE TRÁFICO DE PESADOS EN LA RED FUNCIONAL<br />
AÑO 2003<br />
Estación Carretera P.K. Localidad más próxima<br />
IMD<br />
Pesados<br />
IMD entre 20.000 y 10.000 vehículos / día<br />
16 A-8 20,7 X <strong>de</strong> <strong>la</strong> Misericordia 14.985<br />
80 N-I 365,8 Venta <strong>de</strong>l Patio 13.248<br />
178 A A-8 129,1 E. Cruces - E. Sestao 1<strong>2.</strong>827<br />
179 A A-8 126,5 E. Sestao - E. Portugalete 1<strong>2.</strong>310<br />
24 A A-8 116,7 E. Sabino A.- E. Juan Garai 1<strong>2.</strong>288<br />
40 N-I 348,9 Yurre 1<strong>2.</strong>207<br />
50 N-I 354,3 ETD 4 – Abetxuko 10.688<br />
30 N-I 346,7 Crispijana/Krispiñana 10.624<br />
12 N-I 437,8 Irura 10.461<br />
IMD entre 10.000 y 5.000 vehículos / día<br />
120 N-I 326,3 ETD 3 – Armiñón 9.602<br />
257 A-8 A 0,0 Puente <strong>de</strong> Behobia 8.978<br />
1 N-I 454,6 Frente a Coca – Co<strong>la</strong> 8.832<br />
247 N-I A 2,0 En<strong>la</strong>ce <strong>de</strong> Aritzeta 8.823<br />
240 N-I 341,0 Subijana <strong>de</strong> Á<strong>la</strong>va 8.783<br />
250 A-8 24,0 Aritzeta - Ariete 8.568<br />
277 A-8 16,0 Pasaia / San Sebastián Este 8.392<br />
168 N-I 416,4 Beasain 8.351<br />
278 A-8 12,0 Oiartzun / Pasaia 8.206<br />
220 N-I 382,7 Urabain 8.152<br />
90 N-I 371,6 Arrieta 8.096<br />
30 N-I 405,3 Puerto <strong>de</strong> Etxegarate 8.049<br />
230 N-I 387,5 ETD 5 – Egino 7.987<br />
279 A-8 9,0 Irun / Oiartzun 7.840<br />
140 N-I 379,3 Mezkia 7.658<br />
43 A N-637 8,7 E. Cruces - E. Barakaldo 7.656<br />
70 N-I 359,8 Lubiano 7.562<br />
200 N-I 378,7 Salvatierra o Agurain 7.542<br />
45 A N-637 9,7 Barakaldo - Lutxana / Asua 7.482<br />
60 N-I 356,4 Durana 7.124<br />
213<br />
Revisión <strong>de</strong>l Segundo P<strong>la</strong>n General <strong>de</strong> Carreteras <strong>de</strong>l País Vasco
Estación Carretera P.K. Localidad más próxima<br />
IMD<br />
Pesados<br />
181 A A-8 131,7 E. Perto - E. S. Fuentes 6.771<br />
281 A-8 4,0 Behobia / Ventas Irun 6.473<br />
280 A-8 7,0 Ventas <strong>de</strong> Irun / Irun 6.182<br />
81 A BI-637 9,3 E. Erandio - Santimami 6.166<br />
282 A-8 0,3 Behobia / Francia 5.838<br />
46 A BI-637 - E. Kuku<strong>la</strong>rra – R. Erandio 5.760<br />
83 A BI-637 11,1 Santimami - Leioa 5.288<br />
- AP-68 10,3 Ugao / Miraballes - Arakaldo 5.250<br />
182 A A-8 135,2 E. San Fuentes - E. La Arena 5.112<br />
IMD entre 5.000 y <strong>2.</strong>000 vehículos / día<br />
- AP-68 12,5 Arakaldo / Murueta 4.830<br />
- A-8 108,5 Circunva<strong>la</strong>ción a Galdakao 4.811<br />
154 A BI-625 384,9 E. Basauri - Moyordín (Arrigorriaga) 4.773<br />
- AP-68 15,7 Murueta / L.P. Á<strong>la</strong>va 4.727<br />
131 GI-2634 33,7 Túnel <strong>de</strong> Azkarateko 4.701<br />
180 N-I 321,7 Límite Miranda <strong>de</strong> Ebro 4.675<br />
- A-8 103,7 Erletxe - Boroa 4.633<br />
183 A A-8 139,1 E. La Arena - E. La Haya (L.P.) 4.486<br />
3 N-I 473,0 Final Gaintxurizketa 4.438<br />
121 N-I 325,5 Puente Nuevo 4.286<br />
45 C N-637 11,6 E. Kuku<strong>la</strong>rra - Enekuri (BI-604) 4.198<br />
1070 A-625 371,0 Llodio (Bilbao) 4.174<br />
28 A AP-68 1,7 Buia - Arrigorriaga 4.120<br />
249 A-8 27,0 Tramo <strong>de</strong> Aritzeta 3.981<br />
84 A BI-637 - Leioa - Artatza 3.972<br />
- A-8 105,1 Galdakao - Erletxe 3.920<br />
248 A-8 25,2 En<strong>la</strong>ce <strong>de</strong> Aritzeta 3.900<br />
10169 N-636 2,1 Ormaiztegi 3.847<br />
36 N-I 469,1 Recta <strong>de</strong> Lintzirin 3.744<br />
155 A BI-625 383,6 Moyordín - E. Arrigorriaga 3.699<br />
276 A-8 30,0 San Sebastián O. - Zarautz 3.692<br />
844 N-622 8,6 Kas 3.674<br />
- A-8 95,8 Etxano – Iurreta 3.670<br />
Estación Carretera P.K. Localidad más próxima<br />
IMD<br />
Pesados<br />
23 A A-8 - E. Sabino A. 3.630<br />
100 N-622 12,9 Letona 3.630<br />
87 N-636 7,0 Cruce <strong>de</strong> Ezkio 3.622<br />
275 A-8 45,0 Zestoa / Zarautz 3.620<br />
163 A N-240 11,8 El Gallo - Bedia 3.620<br />
134 A-15 147,8 Túnel <strong>de</strong> Be<strong>la</strong>bieta 3.577<br />
840 N-622 7,0 ETD 1 - En<strong>la</strong>ce <strong>de</strong> Etxabarri Viña 3.572<br />
- A-8 98,9 Amorebieta / Etxano 3.508<br />
89 GI-627 39,4 Cruce <strong>de</strong> San Pru<strong>de</strong>ntzio 3.465<br />
164 A N-240 - Bedia - Lemoa 3.367<br />
111 A N-634 93,9 Erletxe - Amorebieta O. 3.316<br />
271 A-8 72,0 Azitain / Ermua 3.290<br />
102 N-622 23,3 ETD 2 - Peaje AP-68 Altube 3.290<br />
274 A-8 52,0 Zestoa / Itziar 3.286<br />
110 A N-634 98,5 El Gallo - Erletxe 3.285<br />
- A-8 87,1 Iurreta - Zaldibar 3.267<br />
273 A-8 60,0 Itziar / Elgoibar 3.220<br />
61 N-240 4,9 Gamarra Mayor 3.165<br />
272 A-8 70,9 Elgoibar / Azitain 3.126<br />
99 C N-637 - Túneles Artxanda - E. Larrondo 3.120<br />
99 A N-637 12,8 E. Asua (BI-604) - TT. Artxanda 3.039<br />
110 N-240 6,3 Durana 3.031<br />
592 N-124 30,7 Zambrana <strong>2.</strong>800<br />
165 A N-240 20,0 Lemoa - Igorre <strong>2.</strong>796<br />
590 N-124 35,2 Salinil<strong>la</strong>s <strong>de</strong> Buradón <strong>2.</strong>740<br />
113 B N-634 - E. Iurreta - Durango <strong>2.</strong>736<br />
84 D BI-637 13,9 Artatza - Bolue <strong>2.</strong>692<br />
110 B N-637 - Erletxe - Larrabetzu <strong>2.</strong>677<br />
98 C N-633 - Derio – Al<strong>de</strong>kone (Aeropuerto) <strong>2.</strong>645<br />
99 E N-637 - E. Larrondo - E. Derio (N-633) <strong>2.</strong>566<br />
32 A N-634 116,8 Burtzeña - Zorrotza <strong>2.</strong>564<br />
55 A BI-636 7,2 Kastrexana - Alonsotegi <strong>2.</strong>523<br />
69 GI-131 9,0 Parada Bus Carabel <strong>2.</strong>508<br />
214<br />
Revisión <strong>de</strong>l Segundo P<strong>la</strong>n General <strong>de</strong> Carreteras <strong>de</strong>l País Vasco
Estación Carretera P.K. Localidad más próxima<br />
IMD<br />
Pesados<br />
11 N-634 61,5 Eibar <strong>2.</strong>468<br />
21 B BI-636 4,2 E. A-8 - Kastrexana <strong>2.</strong>439<br />
98 D N-637 19,7 Derio - Zamudio <strong>2.</strong>387<br />
156 A BI-625 - BI-712 - Ugao (Miraballes) <strong>2.</strong>359<br />
122 N-124 26,5 Cadiñanos <strong>2.</strong>341<br />
165 C N-240 - Igorre - Arantzazu <strong>2.</strong>329<br />
166 A N-240 - Arantzazu - Bildoso<strong>la</strong> (BI-3530) <strong>2.</strong>282<br />
51 N-622 4,5 Puente Zadorra <strong>2.</strong>136<br />
157 A BI-625 380,6 Arrigorriaga - Miraballes (Ugao) <strong>2.</strong>135<br />
119 A N-637 27,3 Vte. Larrabetzu <strong>2.</strong>102<br />
55 C BI-636 - Solución Sur (A-8) - Kastrexana <strong>2.</strong>096<br />
158 B BI-625 - E. Areta Norte - Areta <strong>2.</strong>087<br />
118 A N-637 22,6 Zamudio - Lezama <strong>2.</strong>035<br />
IMD inferior a <strong>2.</strong>000 vehículos / día<br />
158 A BI-625 - Arrankudiaga - E. Areta Norte 1.992<br />
176 A N-636 - Apatamonasterio - Vte. Elorrio 1.983<br />
78 C BI-604 6,0 Enekuri – Kuku<strong>la</strong>rra / Txoriherri 1.983<br />
118 B N-637 - Lezama - Vte. Larrabetzu 1.949<br />
111 N-240 15,0 Legutiano 1.939<br />
86 B BI-637 16,5 Bolue – Kurtxes (Berango) 1.935<br />
157 C BI-625 - Miraballes (Ugao) - Arrankudiaga 1.933<br />
259 GI-131 8,0 Variante <strong>de</strong> Hernani 1.838<br />
45 B N-637 11,2 E. Lutxana / Asua 1.833<br />
166 B N-240 - Int. BI-3530 - Zeanuri 1.790<br />
175 A N-636 35,1 Abadiño - Apatamonasterio 1.733<br />
168 A N-240 - Int. BI-3530 - Zeanuri 1.715<br />
158 GI-631 15,9 Loyo<strong>la</strong> 1.690<br />
168 C N-240 - Zeanuri - Barazar 1.682<br />
169 B N-240 40,5 Zubizabal - L.P. (Ubi<strong>de</strong>a) 1.674<br />
169 A N-240 - Barazar - Zubizabal 1.669<br />
126 A BI-635 34,6 Vista Alegre - Gernika 1.665<br />
78 A BI-604 4,8 Enekuri - Deusto 1.658<br />
97 A BI-631 3,1 Orueta – Santo Domingo 1.643<br />
Estación Carretera P.K. Localidad más próxima<br />
IMD<br />
Pesados<br />
160 A A-625 - Laudio - Luxaondo 1.623<br />
101 G BI-631 17,4 Variante Mungia 1.589<br />
164 B BI-635 - Lemoa - Amorebieta 1.577<br />
36 B N-634 - Ugarte - Zabal<strong>la</strong> 1.501<br />
52 GI-627 22,3 Puerto <strong>de</strong> Ar<strong>la</strong>bán 1.487<br />
4 B N-634 - Bolueta - Miraflores 1.469<br />
172 A BI-623 31,1 Izurtza - Mañaria 1.461<br />
300 N-240 21,5 Ubi<strong>de</strong>a 1.440<br />
55 N-634 29,9 Arrona 1.425<br />
256 N-I 481,5 Behobia 1.415<br />
2 A N-634 108,1 Ibarsusi - Bolueta 1.414<br />
40 A N-634 127,1 El Casal - Nocedal 1.391<br />
302 N-240 20,0 Ollerías 1.385<br />
1051 A-627 13,1 Urbina 1.375<br />
115 A N-634 - Matiena - O<strong>la</strong>kueta 1.370<br />
125 A BI-635 - Zugaztieta – Vista Alegre 1.330<br />
124 A BI-635 - E. Amorebieta - Zugaztieta 1.329<br />
133 N-636 33,9 Epele - Kanpazar 1.316<br />
98 A BI-631 4,4 Santo Domingo – N-633 (Galbarriatu) 1.303<br />
111 B BI-635 - Amorebieta - Zugaztieta 1.277<br />
93 GI-2132 10,2 Benta - Astigarraga 1.261<br />
174 A N-636 - Durango - Abadiño 1.232<br />
161 A A-625 - Luxaondo – Amurrio 1230<br />
180 B A-8 - E. Santurtzi - Kabietzes 1.216<br />
1050 A-627 17,7 Landa 1.216<br />
115 D N-634 73,6 O<strong>la</strong>kueta - Zaldibar 1.098<br />
117 A N-634 - Areitio - Ermua 1.086<br />
45 N-634 54,4 Salida <strong>de</strong> Altzo<strong>la</strong> 1.083<br />
56 A BI-636 - Alonsotegi - Zaramillo 1.048<br />
1060 A-625 360,2 Amurrio (Llodio) 1.037<br />
176 C N-636 - Elorrio O. - L.P. (Pto. Kanpazar) 1.034<br />
87 A BI-634 19,3 Berango - Larrabasterra 1.023<br />
44 A N-637 - E. Baracaldo (BI – Baracaldo) 1.011<br />
215<br />
Revisión <strong>de</strong>l Segundo P<strong>la</strong>n General <strong>de</strong> Carreteras <strong>de</strong>l País Vasco
Estación Carretera P.K. Localidad más próxima<br />
IMD<br />
Pesados<br />
130 N-102 345,1 Gomecha 1.010<br />
59 A BI-636 - Artxube - L<strong>la</strong>ntada 1.004<br />
143 A BI-633 - Ormaiztegi - Bi<strong>de</strong>barrieta 1.004<br />
143 C BI-633 35,1 Bi<strong>de</strong>barrieta - Gomezeaga 954<br />
114 B BI-633 - Matiena – Bi<strong>de</strong>barrieta (Berriz) 949<br />
56 B BI-636 - Zaramillo - La Cuadra 923<br />
126 C BI-2235 - Gernika - Murueta 923<br />
44 B N-637 - E. Baracaldo (Baracaldo – BI) 922<br />
1071 A-625 369,0 Llodio (Amurrio) 912<br />
38 A N-634 - Trapagarán - Ortuel<strong>la</strong> 908<br />
44 C N-637 - E. Baracaldo (Baracaldo – Rontegi) 865<br />
39 A N-634 - Nocedal - Ortuel<strong>la</strong> 855<br />
44 D N-637 - E. Baracaldo (Rontegi – Baracaldo) 850<br />
6 A BI-631 - S. Sur (A-8) - Miraflores 845<br />
155 C AP-68 - Salida <strong>de</strong> AP-68 (BI-625) 830<br />
79 A BI-604 - Asua – E. Kuku<strong>la</strong>rra 830<br />
1170 A-2122 34,7 Zubil<strong>la</strong>ga 825<br />
1 B BI-631 - Ibarsusi – Santo Domingo 824<br />
145 C BI-633 - Iruzubieta – Vte. Markina 821<br />
62 A-2134 7,9 Zurbano 814<br />
88 A BI-634 20,9 Larrabasterra - Sope<strong>la</strong>na 810<br />
258 N-I H 0,7 Puente <strong>de</strong> Santiago 802<br />
79 C BI-2704 8,4 Asua - Loiu 791<br />
176 E N-636 - Vte. Elorrio - E. Elorrio 773<br />
57 C BI-636 - Sodupe - Artxube 768<br />
57 A BI-636 13,8 La Cuadra - Sodupe 766<br />
144 A BI-633 - Gomezeaga – Pto. Trabakua 762<br />
821 A-624 30,9 Cruce <strong>de</strong> Urquillo 757<br />
40 N-634 24,7 Getaria 752<br />
145 A BI-633 - Arrangizgana - Iruzubieta 752<br />
11 N-104 355,5 Arkaute 750<br />
176 F N-636 - E. Elorrio - Elorrio 749<br />
147 B BI-633 - Iruzubieta – Vte. Markina 748<br />
Estación Carretera P.K. Localidad más próxima<br />
IMD<br />
Pesados<br />
5 A N-634 - Miraflores - Arenal 723<br />
155 B AP-68 - Entrada a AP-68 (BI-625) 715<br />
148 A BI-633 - Urberuaga - P<strong>la</strong>zako<strong>la</strong> 714<br />
37 A N-634 122,2 Trapagarán - San Andrés 710<br />
147 A BI-633 - Vte. Markina - Urberuaga 666<br />
490 A-2126 59,1 Oyón (L.P. Logroño) 649<br />
60 A BI-636 - L<strong>la</strong>ntada - Balmaseda N. 645<br />
1064 A-625 360,0 Circunva<strong>la</strong>ción <strong>de</strong> Amurrio 622<br />
149 A BI-633 - Berriatua - Ondarroa 596<br />
159 A BI-2522 - Areta – E. Areta Sur 595<br />
1063 A-625 358,2 Amurrio 589<br />
1061 A-625 356,0 Saratxo 585<br />
128 A BI-2235 - Gernika - Murueta 581<br />
130 B BI-2235 - Mundaka - Bermeo 574<br />
101 D BI-631 - Mungia - Larrauri 557<br />
128 B BI-2235 - Murueta - Busturia 530<br />
129 A BI-2235 - Busturia - Sukarrieta 528<br />
770 A-624 40,0 Larrimbe 527<br />
161 B A-625 - Amurrio – Vitoria-Gasteiz 524<br />
130 A BI-2235 - Sukarrieta - Mundaka 522<br />
88 B BI-634 - Sope<strong>la</strong>na - Urduliz 516<br />
101 E BI-2121 - Mungia - Soietxe 516<br />
88 C BI-2122 - Sope<strong>la</strong>na - Barrika 509<br />
101 B BI-634 - Mungia - Gatika 504<br />
12 N-I32 4,9 Ascarza 491<br />
61 C BI-636 - La Pinil<strong>la</strong> - Vil<strong>la</strong>sana 480<br />
791 A-2522 47 Llodio (Orozco) 474<br />
1200 N-I32 8,7 Andollu 469<br />
147 C BI-633 - Vte. Markina 466<br />
127 A BI-2238 - Gernika - Kortezubi 459<br />
41 C BI-2701 - Muskiz – El Arenao 451<br />
82 GI-2630 14,6 Salida hacía Udana 451<br />
172 B BI-623 - Mañaria - Urkio<strong>la</strong> 428<br />
216<br />
Revisión <strong>de</strong>l Segundo P<strong>la</strong>n General <strong>de</strong> Carreteras <strong>de</strong>l País Vasco
Estación Carretera P.K. Localidad más próxima<br />
IMD<br />
Pesados<br />
350 N-104 358,8 Matauco 424<br />
131 A BI-2238 - Kortezubi - Gauztegiz 417<br />
67 A BI-2701 - Muskiz – El Arenao 410<br />
54 C N-639 - La Cuesta - El Casal 401<br />
160 A-2124 9,5 Puerto Vitoria 401<br />
61 A BI-636 - Balmaseda - La Pinil<strong>la</strong> 399<br />
162 A BI-625 - Amurrio - Orduña 397<br />
640 A-2124 3,7 Castillo 381<br />
173 B BI-623 - Otxandio - L.P. (Á<strong>la</strong>va) 376<br />
94 B BI-634 - Urduliz - Elortza 376<br />
177 C BI-2522 - E. Areta Sur - Orozko 375<br />
146 C BI-2636 - Etxebarria - Markina 370<br />
146 C BI-2636 - Etxebarria - Markina 370<br />
48 GI-2135 59,1 Pasada recta Txamara 368<br />
173 A BI-623 - Urkio<strong>la</strong> - Otxandio 368<br />
150 N-I32 22,3 Azatzeta 363<br />
68 A BI-2701 - El Arenao – Merkadillo (Sopuerta) 363<br />
42 A N-634 136,1 Muskiz - L.P. Cantabria 359<br />
102 A BI-631 - Larrauri – Int. BI-3101 348<br />
123 A BI-2121 - Mungia - Soietxe 336<br />
72 A BI-2604 - Gor<strong>de</strong>xo<strong>la</strong> – Padura (Sodupe) 330<br />
920 A-2122 42,8 Puente<strong>la</strong>rrá 317<br />
670 A-2622 12,5 Nanc<strong>la</strong>res <strong>de</strong> <strong>la</strong> Oka 315<br />
80 C N-633 - BI-631 - Aeropuerto 310<br />
134 B BI-2405 - Lekeito - Oleta 292<br />
510 N-124 61,1 Páganos 288<br />
500 N-124 75,5 Laserna 282<br />
310 A-623 18,3 Límite Otxandio 282<br />
69 A BI-2701 - Merkadillo – El Carral 282<br />
420 N-I32 34,5 Antoñana 281<br />
97 GI-2120 62,0 Puente Nuevo Ataun 278<br />
142 B BI-2405 - Oleta - Amoroto 275<br />
94 C BI-634 - Elortza - Butroe 272<br />
Estación Carretera P.K. Localidad más próxima<br />
IMD<br />
Pesados<br />
89 A BI-2122 - Barrika - Plentzia 272<br />
62 B BI-2701 - Ma<strong>la</strong>brigo - Reto<strong>la</strong> 267<br />
89 B BI-2704 - Plentzia – Elortza (Urduliz) 265<br />
142 C BI-2405 - Oleta - Lekeito 265<br />
430 N-I32 41,5 Sta. Cruz (Límite Navarra) 262<br />
830 A-2521 23,8 Beluntza 261<br />
92 A BI-2704 - Loiu - Unbe 261<br />
123 C BI-2121 - Soietxe - Fruiz 256<br />
790 A-2522 36,6 Ziorraga 253<br />
69 C BI-2701 - El Carral - Avel<strong>la</strong>neda 249<br />
54 B N-639 - Zierbana - El Puerto (Zierbana) 248<br />
70 A BI-2701 - Avel<strong>la</strong>neda - Reto<strong>la</strong> 244<br />
93 A BI-2704 13,1 Unbe – Alto Unbe 238<br />
170 A BI-2543 - Igorre - Dima 233<br />
103 A BI-631 - Larrauri - Sollube 233<br />
850 A-2604 55,5 Artziniega 233<br />
1062 A-624 42,9 Amurrio 231<br />
104 A BI-631 - Sollube - Bermeo 230<br />
148 C BI-633 - P<strong>la</strong>zako<strong>la</strong> - Berriatua 228<br />
148 B BI-2405 - P<strong>la</strong>zako<strong>la</strong> - Oleta 228<br />
125 B BI-2121 - Vista Alegre - Muxika 223<br />
161 C BI-624 - Amurrio - Artziniega 221<br />
95 A BI-634 - Butroe - Gatika 220<br />
62 C BI-630 - Ma<strong>la</strong>brigo - Herbosa 205<br />
165 B BI-2543 - Igorre - Dima 205<br />
170 A-2130 5 Otazu 204<br />
57 B BI-2604 - Sodupe - Padura 197<br />
93 C BI-2704 - Alto Unbe – BI-3724 (Ugeraga) 196<br />
134 A BI-2238 - Tres Cruces - Lekeito 194<br />
120 A BI-2713 - Larrabetzu - Astoreka 193<br />
910 A-624 45,7 Respaldiza 193<br />
132 GI-2130 11,8 Caserío Sabiñone 189<br />
63 A BI-630 35,0 Herbosa - Artzentales 187<br />
217<br />
Revisión <strong>de</strong>l Segundo P<strong>la</strong>n General <strong>de</strong> Carreteras <strong>de</strong>l País Vasco
Estación Carretera P.K. Localidad más próxima<br />
IMD<br />
Pesados<br />
62 A BI-630 - Balmaseda - Ma<strong>la</strong>brigo 181<br />
921 A-2122 47,3 Sobrón 179<br />
94 A BI-2704 - BI-3724 – Elortza (Urduliz) 176<br />
72 C BI-2604 - Gor<strong>de</strong>xo<strong>la</strong> – L.P. (Artziniega) 175<br />
64 A BI-630 - Artzentales - Turtzioz 171<br />
177 A BI-2522 - Orozko – L.P. (Ziorraga) 165<br />
65 A BI-630 - Turtzioz - Ambasaguas 164<br />
144 B BI-2301 - Arrangizgana – Ermua 152<br />
520 N-124 52,8 Ábalos 148<br />
450 A-2620 31,2 Ibarra <strong>de</strong> Aramaio 148<br />
122 A BI-2121 - Fruiz - Errigoitiolea 146<br />
121 B BI-2121 - Alto <strong>de</strong> Morga - Muxika 143<br />
911 A-624 49,0 Menagaray 142<br />
132 A BI-2238 - Atxoste - Basetxea 137<br />
923 A-2625 318,9 Puente<strong>la</strong>rrá 124<br />
131 C BI-2238 - Gauztegiz – Atxoste (Muruetagana) 123<br />
580 N-124 42,5 Labastida 116<br />
127 C BI-2224 - Gernika - Uarka 115<br />
66 C N-629 - Lanestosa – L.P. (Ramales) 112<br />
122 B BI-2121 - Errigoitiolea - Morga 111<br />
65 B BI-630 - Ambasaguas - L.P. (Ramales) 107<br />
20 B A-8 - Kastrena – A-8 105<br />
680 A-2622 16,5 Montevite 104<br />
900 A-2604 (1) 1 Gordéliz (Artziniega) 101<br />
121 A BI-2121 - Morga – Alto <strong>de</strong> Morga 100<br />
440 N-126 39,0 Genevil<strong>la</strong> 94<br />
133 A BI-2238 - Basetxea – Tres Cruces 86<br />
380 A-2128 27,3 Opacua 80<br />
800 A-2522 34,3 Baranbio 79<br />
66 B N-629 - Lanestosa – L.P. (Bercedo) 77<br />
120 C BI-2713 - Astoreka – Alto <strong>de</strong> Morga 74<br />
922 A-2625 321 Bergüenda 72<br />
64 B BI-2617 - Turtioz – L.P. Cantabria 72<br />
Estación Carretera P.K. Localidad más próxima<br />
IMD<br />
Pesados<br />
145 B BI-2224 - Bolívar - Iruzubieta 72<br />
820 A-624 25,0 Altube 67<br />
162 B BI-2625 - Orduña – L.P. Burgos 65<br />
1210 A-2622 33,5 Tuesta 59<br />
146 A BI-2636 - L.P. (Elgoibar) – Etxebarria 57<br />
146 A BI-2636 - L.P. Elgoibar - Etxebarria 57<br />
720 A-2625 334,8 Osma 49<br />
140 A BI-2224 - Ibartxu - Arbatzegi 48<br />
320 A-2620 17,3 Puerto Cruceta 44<br />
700 A-2622 22,8 Paúl 43<br />
760 A-2521 30 Unzá 40<br />
140 C BI-2224 - Arbatzegi - Bolibar 37<br />
721 A-2625 346,2 Puerto Orduña 36<br />
173 C BI-2543 - Dima - Otxandio 35<br />
390 A-2128 38 Puerto Opacua 32<br />
902 A-2604 (1) 4,5 Gordéliz (Peña Angulo) 29<br />
903 A-624 57,0 Artziniega (Balmaseda) 25<br />
480 A-2126 53,5 Yécora 25<br />
740 A-2622 40 Guren<strong>de</strong>s 24<br />
471 N-126 39,5 Bernedo (Límite Navarra) 23<br />
432 A-2128 39,4 Santa Cruz 20<br />
400 A-2128 55,8 Contrasta 17<br />
630 A-2124 15,8 Peñacerrada (a Vitoria) 16<br />
462 N-126 36,0 Navarrete 14<br />
470 A-2126 42 Puerto Bernedo 14<br />
473 N-126 41,8 Angostina 11<br />
722 A-2625 34 Cárcamo 10<br />
662 N-126 18,5 Añastro (Condado <strong>de</strong> Treviño) 8<br />
750 A-2622 51,5 Tobil<strong>la</strong>s 7<br />
Fuente: E<strong>la</strong>boración propia a partir <strong>de</strong> los datos <strong>de</strong> <strong>la</strong>s Diputaciones Forales <strong>de</strong> Á<strong>la</strong>va, Gipuzkoa y Bizkaia.<br />
218<br />
Revisión <strong>de</strong>l Segundo P<strong>la</strong>n General <strong>de</strong> Carreteras <strong>de</strong>l País Vasco
Pue<strong>de</strong> concluirse lo siguiente:<br />
√ Las mayores intensida<strong>de</strong>s <strong>de</strong> tráfico <strong>de</strong> vehículos pesados (entre 20.000 vehículos pesados / día y<br />
10.000 vehículos pesados / día), tienen lugar en <strong>la</strong> Autopista A-8 (Autopista <strong>de</strong>l Cantábrico),<br />
concretamente en el Territorio Histórico <strong>de</strong> Gipuzkoa, con una estación <strong>de</strong> aforo a su paso por Donostia-<br />
San Sebastián y en Bizkaia con tres estaciones <strong>de</strong> aforo en el Bilbao Metropolitano y, en algunos tramos<br />
<strong>de</strong> <strong>la</strong> Autovía <strong>de</strong>l Norte N-I en <strong>la</strong> circunva<strong>la</strong>ción <strong>de</strong> <strong>la</strong> capital a<strong>la</strong>vesa.<br />
√ En segundo lugar, con una IMD <strong>de</strong> vehículos pesados comprendida entre los valores <strong>de</strong> 10.000<br />
vehículos pesados / día y 5.000 vehículos pesados / día, se encuentran en su mayoría tramos <strong>de</strong> <strong>la</strong><br />
Autovía <strong>de</strong>l Norte N-I. En <strong>la</strong> Autopista A-8 (Autopista <strong>de</strong>l Cantábrico) también se localizan tramos con <strong>la</strong><br />
IMD <strong>de</strong> pesados entre los valores consi<strong>de</strong>rados. Estos tramos coinci<strong>de</strong>n con el final <strong>de</strong> <strong>la</strong> autopista en el<br />
límite con <strong>la</strong> frontera francesa, y en Bilbao Metropolitano. La Autopista <strong>de</strong> Peaje Vasco Aragonesa AP-68,<br />
también consta <strong>de</strong> un tráfico <strong>de</strong> pesados con valores comprendidos entre los consi<strong>de</strong>rados. Es el tramo<br />
localizado entre Ugao / Miraballes y Arakaldo. Y finalmente, <strong>de</strong> <strong>la</strong> Red <strong>de</strong> Interés Preferente, el Cor<strong>red</strong>or<br />
Rontegi <strong>de</strong> <strong>la</strong> carretera N-637, también tiene una IMD <strong>de</strong> vehículos pesados entre estos dos valores.<br />
De <strong>la</strong> Red Básica, únicamente <strong>la</strong> carretera BI-637 presenta un tráfico <strong>de</strong> pesados elevado, entre <strong>la</strong><br />
continuación <strong>de</strong>l cor<strong>red</strong>or Rontegi y <strong>la</strong> localidad <strong>de</strong> Leioa.<br />
√ Atendiendo a los tramos <strong>de</strong> carreteras con una intensidad <strong>de</strong> vehículos pesados inferior a <strong>2.</strong>000<br />
vehículos pesados / día pero superiores a 1.000 vehículos pesados / día, se observa que <strong>la</strong>s carreteras<br />
incluidas en este grupo son, <strong>de</strong> <strong>la</strong> Red <strong>de</strong> Interés Preferente, <strong>la</strong> A-8 en el En<strong>la</strong>ce <strong>de</strong> Santurtzi, <strong>la</strong> N-I en <strong>la</strong><br />
localidad <strong>de</strong> Behobia, <strong>la</strong> carretera N-637 en el cor<strong>red</strong>or Rontegi, <strong>la</strong> N-636 en prácticamente <strong>la</strong> totalidad <strong>de</strong><br />
su trazado en el Territorio Histórico <strong>de</strong> Bizkaia, <strong>la</strong> N-634 en Bilbao Metropolitano, entre Berriz y Ermua,<br />
en <strong>la</strong> localidad <strong>de</strong> Altzo<strong>la</strong> y por último en torno a Zumaia, <strong>la</strong> carretera N-240 <strong>de</strong>s<strong>de</strong> <strong>la</strong> localidad <strong>de</strong><br />
Arantzazu hasta <strong>la</strong> intersección con <strong>la</strong> carretera A-627, y por último <strong>la</strong> carretera N-10<strong>2.</strong><br />
De <strong>la</strong> Red Básica, se incluyen <strong>la</strong>s carreteras <strong>de</strong> Á<strong>la</strong>va A-627 entre Urbina y Landa y A-625 entre Llodio<br />
y Amurrio. Del Territorio Histórico <strong>de</strong> Gipuzkoa, <strong>la</strong>s carreteras GI-631 en Loyo<strong>la</strong>, <strong>la</strong> GI-131 en <strong>la</strong><br />
variante <strong>de</strong> Hernani y <strong>la</strong> GI-627 en el Puerto <strong>de</strong> Ar<strong>la</strong>bán. Finalmente, <strong>de</strong>ntro <strong>de</strong> esta categoría <strong>de</strong> <strong>red</strong>,<br />
<strong>la</strong> mayoría <strong>de</strong> <strong>la</strong>s carreteras incluidas pertenecen al Territorio Histórico <strong>de</strong> Bizkaia. Son <strong>la</strong>s carreteras<br />
BI-636 entre <strong>la</strong> localidad <strong>de</strong> Zaramillo y Zal<strong>la</strong>; <strong>la</strong> carretera BI-623 entre Izurtza y Mañaria; <strong>la</strong> BI-637<br />
cerca <strong>de</strong> <strong>la</strong> localidad <strong>de</strong> Berango; <strong>la</strong> BI-635; <strong>la</strong> BI-604 en Enekuri; <strong>la</strong> carretera BI-631 en Bilbao<br />
Metropolitano y en <strong>la</strong> variante <strong>de</strong> Mungia; <strong>la</strong> carretera BI-633 en Ormaiztegi – Bi<strong>de</strong>barrieta, <strong>la</strong> BI-634<br />
entre Berango y Larrabasterra y finalmente <strong>la</strong> carretera BI-625 (Areta - Bilbao).<br />
Por último, con menos <strong>de</strong> 1.000 vehículos pesados / día, <strong>la</strong>s carreteras <strong>de</strong> <strong>la</strong> Red <strong>de</strong> Interés<br />
Preferente incluidas son: <strong>la</strong> N-636 en <strong>la</strong> variante <strong>de</strong> Elorrio; <strong>la</strong>s carreteras N-633 y N-639 <strong>de</strong> acceso al<br />
Aeropuerto <strong>de</strong> Loiu y al Puerto <strong>de</strong> Bilbao respectivamente; <strong>la</strong> carretera N-634, don<strong>de</strong> en algunos<br />
tramos <strong>de</strong>l trazado que atraviesa el Bilbao Metropolitano <strong>la</strong> IMD <strong>de</strong> pesados es inferior a este valor; <strong>la</strong><br />
N-629 en Lanestosa; <strong>la</strong> N-104 en Matauco y Arkaute y finalmente <strong>la</strong> carretera N-637 en el en<strong>la</strong>ce <strong>de</strong><br />
Cruces.<br />
De <strong>la</strong> Red Básica, ninguna carretera <strong>de</strong>l Territorio Histórico <strong>de</strong> Gipuzkoa presenta un tráfico <strong>de</strong><br />
pesados inferior a 1.000 vehículos pesados / día. En Á<strong>la</strong>va, son seis <strong>la</strong>s carreteras incluidas en este<br />
grupo: <strong>la</strong>s carreteras N-126, N-124, N-132, A-623, <strong>la</strong> A-625 y <strong>la</strong> carretera A-624. Por último, en el<br />
Territorio Histórico <strong>de</strong> Bizkaia es don<strong>de</strong> se registran los mayores tráficos <strong>de</strong> pesados incluidos en este<br />
grupo con un total <strong>de</strong> nueve carreteras: <strong>la</strong> carretera BI-633 en toda su longitud, <strong>la</strong> carretera BI-636<br />
<strong>de</strong> principio a fin, <strong>la</strong> BI-604 en Asua; <strong>la</strong> BI-631 <strong>de</strong>s<strong>de</strong> Mungia (pasada <strong>la</strong> variante) hasta Bermeo y en<br />
Ibarsusi (Bilbao Metropolitano); <strong>la</strong> BI-625 en Orduña; <strong>la</strong> BI-624 entre Amurrio y Artziniega; BI-623;<br />
BI-634 y <strong>la</strong> BI-630.<br />
Finalmente, <strong>la</strong> mayoría <strong>de</strong> <strong>la</strong>s carreteras cuyo tráfico <strong>de</strong> pesados no supera los 1.000 vehículos<br />
pesados / día son carreteras <strong>de</strong> <strong>la</strong> Red Comarcal: en el Territorio Histórico <strong>de</strong> Gipuzkoa <strong>la</strong>s carreteras<br />
GI-2630 y GI-2130; en el Territorio Histórico <strong>de</strong> Bizkaia, <strong>la</strong>s carreteras BI-2713, BI-2704, BI-2701, BI-<br />
2636, BI-2625, BI-2617, BI-2604, BI-2543, BI-2522, BI-2405, <strong>la</strong> BI-2301, BI-2238, BI-2235, BI-2224,<br />
<strong>la</strong> BI-2121 y <strong>la</strong> carretera BI-212<strong>2.</strong> Por último en el Territorio Histórico <strong>de</strong> Á<strong>la</strong>va, <strong>la</strong>s carreteras que se<br />
incluyen en este grupo son: <strong>la</strong> A-2625, A-2622, A-2620, A-2604, A-2522, A-2521, A-2134, A-2130, A-<br />
2128, A-2126, A-2124 y <strong>la</strong> carretera A-212<strong>2.</strong><br />
<strong>2.</strong><strong>2.</strong><strong>2.</strong>5. Flujos <strong>de</strong> Tráfico por Territorio Histórico según Tipo <strong>de</strong> Red<br />
En los siguientes gráficos se presenta <strong>la</strong> longitud (en porcentaje) <strong>de</strong> carreteras <strong>de</strong> <strong>la</strong> Red Funcional <strong>de</strong>l P<strong>la</strong>n<br />
que, para cada uno <strong>de</strong> los Territorios Históricos así como para el conjunto <strong>de</strong> <strong>la</strong> Comunidad Autónoma <strong>de</strong>l<br />
País Vasco, presentan flujos <strong>de</strong> tráfico comprendidos en los rangos antes citados.<br />
En Á<strong>la</strong>va, el 33% <strong>de</strong>l total <strong>de</strong> kilómetros <strong>de</strong> <strong>la</strong> Red Funcional presenta un tráfico entre <strong>2.</strong>000 vehículos / día<br />
y 5.000 vehículos / día. El 24% <strong>de</strong> los kilómetros concentran tráficos inferiores a <strong>2.</strong>000 vehículos al día,<br />
mientras que el 43% restantes se sitúa entre los 5.000 y los 40.000 vehículos, no habiendo tráficos por<br />
encima <strong>de</strong> los 40.000 vehículos en <strong>la</strong> <strong>red</strong> a<strong>la</strong>vesa.<br />
219<br />
Revisión <strong>de</strong>l Segundo P<strong>la</strong>n General <strong>de</strong> Carreteras <strong>de</strong>l País Vasco
40,00%<br />
35,00%<br />
30,00%<br />
25,00%<br />
20,00%<br />
15,00%<br />
10,00%<br />
5,00%<br />
0,00%<br />
TRÁFICO EN LA RED FUNCIONAL DEL T. H. DE ÁLAVA (% KM)<br />
24,16%<br />
0-<strong>2.</strong>000<br />
<strong>2.</strong>000-5.000<br />
33,44%<br />
5.000-10.000<br />
5,65%<br />
AÑO 2003<br />
10.000-20.000<br />
18,67% 18,09%<br />
20.000-40.000<br />
40.000-80.000<br />
0,00% 0,00%<br />
Fuente: E<strong>la</strong>boración propia a partir <strong>de</strong> los datos <strong>de</strong> <strong>la</strong>s Diputaciones Forales.<br />
Con respecto a los datos <strong>de</strong>l 2º P<strong>la</strong>n General <strong>de</strong> Carreteras se observa que, en el Territorio Histórico <strong>de</strong><br />
Á<strong>la</strong>va, se ha incrementado el porcentaje <strong>de</strong> <strong>red</strong> que supera los <strong>2.</strong>000 vehículos día, así como los que<br />
superan los 10.000 vehículos día. Por el contrario, ha <strong>de</strong>scendido notablemente el porcentaje <strong>de</strong> kilómetros<br />
con IMD inferior a <strong>2.</strong>000 vehículos, así como el rango comprendido entre los 5.000 y los 10.000. En ambos<br />
casos, sigue sin existir ningún tramo en este Territorio Histórico que supere los 40.000 vehículos,<br />
pudiéndose percibir un incremento global <strong>de</strong>l tráfico en <strong>la</strong> Red.<br />
>80.000<br />
50,00%<br />
45,00%<br />
40,00%<br />
35,00%<br />
30,00%<br />
25,00%<br />
20,00%<br />
15,00%<br />
10,00%<br />
5,00%<br />
0,00%<br />
TRÁFICO EN LA RED FUNCIONAL DEL T. H. DE ÁLAVA (% KM)<br />
0-<strong>2.</strong>000<br />
<strong>2.</strong>000-5.000<br />
COMPARATIVA 2003 - 1996<br />
5.000-10.000<br />
10.000-20.000<br />
20.000-40.000<br />
2003 1996<br />
40.000-80.000<br />
Fuente: E<strong>la</strong>boración propia a partir <strong>de</strong> los datos <strong>de</strong> <strong>la</strong>s Diputaciones Forales.<br />
En el Territorio Histórico <strong>de</strong> Gipuzkoa, el porcentaje mayor <strong>de</strong> kilómetros se sitúa entre los 10.000 y los<br />
20.000 vehículos, superando el 25%. Destacan los tráficos entre los 20.000 y los 40.000, así como los que<br />
se sitúan entre 5.000 y 10.000, en ambos casos por encima <strong>de</strong>l 20%. Los tráficos superiores a 40.000<br />
vehículos tan sólo representan el 9% <strong>de</strong> <strong>la</strong> <strong>red</strong>, superando los 80.000 un porcentaje menor <strong>de</strong>l 1% <strong>de</strong> los<br />
kilómetros <strong>de</strong> <strong>la</strong> <strong>red</strong> guipuzcoana. Finalmente, por <strong>de</strong>bajo <strong>de</strong> los 5.000 vehículos se encuentra algo más <strong>de</strong>l<br />
22% <strong>de</strong> los kilómetros <strong>de</strong> <strong>la</strong>s carreteras <strong>de</strong> <strong>la</strong> Red Funcional <strong>de</strong> Gipuzkoa.<br />
>80.000<br />
220<br />
Revisión <strong>de</strong>l Segundo P<strong>la</strong>n General <strong>de</strong> Carreteras <strong>de</strong>l País Vasco
TRÁFICO EN LA RED FUNCIONAL DEL T. H. DE GIPUZKOA (% KM)<br />
30,00%<br />
25,00%<br />
20,00%<br />
15,00%<br />
10,00%<br />
5,00%<br />
0,00%<br />
0-<strong>2.</strong>000<br />
4,68%<br />
<strong>2.</strong>000-5.000<br />
18,03%<br />
5.000-10.000<br />
20,38%<br />
AÑO 2003<br />
10.000-20.000<br />
25,79%<br />
20.000-40.000<br />
22,22%<br />
40.000-80.000<br />
8,12%<br />
Fuente: E<strong>la</strong>boración propia a partir <strong>de</strong> los datos <strong>de</strong> <strong>la</strong>s Diputaciones Forales.<br />
En comparación con el P<strong>la</strong>n anterior se observan menores diferencias que en el caso <strong>de</strong> Á<strong>la</strong>va. En todo caso,<br />
son menores con respecto a dicho P<strong>la</strong>n los porcentajes <strong>de</strong> kilómetros con IMD inferior a 20.000 vehículos /<br />
día, habiéndose incrementado los porcentajes <strong>de</strong> kilómetros <strong>de</strong> carreteras con IMD superiores a dicha<br />
cantidad.<br />
>80.000<br />
0,77%<br />
TRÁFICO EN LA RED FUNCIONAL DEL T. H. DE GIPUZKOA (% KM)<br />
35,00%<br />
30,00%<br />
25,00%<br />
20,00%<br />
15,00%<br />
10,00%<br />
5,00%<br />
0,00%<br />
4,68%<br />
8,00%<br />
0-<strong>2.</strong>000<br />
18,03%<br />
23,00%<br />
<strong>2.</strong>000-5.000<br />
COMPARATIVA 2003 - 1996<br />
20,38%<br />
26,00%<br />
5.000-10.000<br />
25,79%<br />
29,00%<br />
10.000-20.000<br />
22,22%<br />
20.000-40.000<br />
2003 1996<br />
12,00%<br />
8,12%<br />
40.000-80.000<br />
Fuente: E<strong>la</strong>boración propia a partir <strong>de</strong> los datos <strong>de</strong> <strong>la</strong>s Diputaciones Forales.<br />
Finalmente, <strong>la</strong> mayor parte <strong>de</strong> <strong>la</strong>s carreteras vizcaínas <strong>de</strong> <strong>la</strong> Red Funcional tienen una IMD comprendida<br />
entre <strong>2.</strong>000 vehículos / día y 10.000 vehículos / día, sumando en conjunto el 45% <strong>de</strong>l total. Es <strong>de</strong>stacable<br />
también el porcentaje <strong>de</strong> longitud <strong>de</strong> carreteras que cuenta con una IMD entre 20.000 y 40.000 vehículos,<br />
que supera el 20%. Por encima <strong>de</strong> 40.000 vehículos / día se registran en algo más <strong>de</strong>l 8% <strong>de</strong> los kilómetros<br />
<strong>de</strong> <strong>la</strong> <strong>red</strong>, superando 80.000 vehículos alre<strong>de</strong>dor <strong>de</strong>l 4% <strong>de</strong> <strong>la</strong> Red Funcional en el Territorio Histórico <strong>de</strong><br />
Bizkaia.<br />
2,00%<br />
0,77%<br />
>80.000<br />
0,00%<br />
221<br />
Revisión <strong>de</strong>l Segundo P<strong>la</strong>n General <strong>de</strong> Carreteras <strong>de</strong>l País Vasco
25,00%<br />
20,00%<br />
15,00%<br />
10,00%<br />
TRÁFICO EN LA RED FUNCIONAL DEL T. H. DE BIZKAIA (% KM)<br />
5,00%<br />
0,00%<br />
0-<strong>2.</strong>000<br />
9,59%<br />
<strong>2.</strong>000-5.000<br />
23,61%<br />
5.000-10.000<br />
21,54%<br />
AÑO 2003<br />
10.000-20.000<br />
15,95%<br />
20.000-40.000<br />
20,83%<br />
40.000-80.000<br />
4,42% 4,06%<br />
Fuente: E<strong>la</strong>boración propia a partir <strong>de</strong> los datos <strong>de</strong> <strong>la</strong>s Diputaciones Forales.<br />
Con respecto al P<strong>la</strong>n anterior pue<strong>de</strong>n hacerse comentarios semejantes a los <strong>de</strong>l caso guipuzcoano, ya que<br />
también en Bizkaia se han incrementado los porcentajes <strong>de</strong> carreteras con rangos superiores a los 20.000<br />
vehículos / día, disminuyendo <strong>de</strong> manera general los porcentajes con IMD inferiores, si bien, en este caso,<br />
<strong>la</strong>s diferencias son mucho menos notables que en los dos casos anteriores.<br />
>80.000<br />
30,00%<br />
25,00%<br />
20,00%<br />
15,00%<br />
10,00%<br />
TRÁFICO EN LA RED FUNCIONAL DEL T. H. DE BIZKAIA (% KM)<br />
5,00%<br />
0,00%<br />
9,59%<br />
15,00%<br />
0-<strong>2.</strong>000<br />
23,61%<br />
<strong>2.</strong>000-5.000<br />
COMPARATIVA 2003 - 1996<br />
24,00%<br />
21,54%<br />
5.000-10.000<br />
20,00%<br />
15,95%<br />
10.000-20.000<br />
24,00%<br />
20,83%<br />
20.000-40.000<br />
2003 1996<br />
12,00%<br />
4,42%<br />
40.000-80.000<br />
Fuente: E<strong>la</strong>boración propia a partir <strong>de</strong> los datos <strong>de</strong> <strong>la</strong>s Diputaciones Forales.<br />
Si se consi<strong>de</strong>ra <strong>la</strong> Comunidad Autónoma en su conjunto, el rango <strong>de</strong> mayor porcentaje es el que se<br />
encuentra entre los <strong>2.</strong>000. y los 5.000 vehículos, que alcanza el 25% <strong>de</strong> <strong>la</strong> <strong>red</strong>, siendo también muy<br />
importantes los rangos <strong>de</strong> 10.000 a 20.000 y 20.000 a 40.000, ambos en el entorno <strong>de</strong>l 20%.<br />
30,00%<br />
25,00%<br />
20,00%<br />
15,00%<br />
10,00%<br />
5,00%<br />
0,00%<br />
TRÁFICO EN LA RED FUNCIONAL DE LA CAPV (% KM)<br />
12,66%<br />
0-<strong>2.</strong>000<br />
<strong>2.</strong>000-5.000<br />
24,91%<br />
5.000-10.000<br />
16,05%<br />
10.000-20.000<br />
19,89%<br />
20.000-40.000<br />
20,54%<br />
40.000-80.000<br />
3,00%<br />
4,13%<br />
Fuente: E<strong>la</strong>boración propia a partir <strong>de</strong> los datos <strong>de</strong> <strong>la</strong>s Diputaciones Forales.<br />
4,06%<br />
>80.000<br />
>80.000<br />
2,00%<br />
1,83%<br />
222<br />
Revisión <strong>de</strong>l Segundo P<strong>la</strong>n General <strong>de</strong> Carreteras <strong>de</strong>l País Vasco
Con respecto al 2º P<strong>la</strong>n <strong>de</strong> Carreteras lo más <strong>de</strong>stacable es <strong>la</strong> <strong>red</strong>ucción <strong>de</strong>l porcentaje <strong>de</strong> longitud <strong>de</strong><br />
carreteras con IMD inferior a <strong>2.</strong>000 vehículos, que se contrapone al incremento <strong>de</strong> los segmentos superiores<br />
(<strong>2.</strong>000 a 5.000 vehículos, y fundamentalmente <strong>de</strong> 20.000 a 40.000 vehículos / día). Por otro <strong>la</strong>do, se han<br />
incrementado ligeramente los porcentajes <strong>de</strong> los rangos más elevados, pasando <strong>de</strong>l 2 al 4,13% los<br />
porcentajes <strong>de</strong> longitud <strong>de</strong> carreteras con IMD entre 40.000 y 80.000 vehículos, y <strong>de</strong>l 1 al 1,83% los<br />
porcentajes <strong>de</strong> longitud <strong>de</strong> carreteras con IMD superior a 80.000 vehículos.<br />
30,00%<br />
25,00%<br />
20,00%<br />
15,00%<br />
10,00%<br />
5,00%<br />
0,00%<br />
TRÁFICO EN LA RED FUNCIONAL DE LA CAPV (% KM)<br />
12,66%<br />
0-<strong>2.</strong>000<br />
22,00%<br />
24,91%<br />
<strong>2.</strong>000-5.000<br />
COMPARATIVA 2003 - 1996<br />
23,00%<br />
16,05%<br />
18,00%<br />
5.000-10.000<br />
19,89%<br />
25,00%<br />
10.000-20.000<br />
20,54%<br />
20.000-40.000<br />
2003 1996<br />
10,00%<br />
4,13%<br />
40.000-80.000<br />
Fuente: E<strong>la</strong>boración propia a partir <strong>de</strong> los datos <strong>de</strong> <strong>la</strong>s Diputaciones Forales.<br />
En cuanto a <strong>la</strong> distribución por tipo <strong>de</strong> carretera, se observa que <strong>la</strong> totalidad <strong>de</strong> <strong>la</strong>s autopistas <strong>de</strong> <strong>la</strong><br />
Comunidad Autónoma tienen tráfico superior a los 5.000 vehículos día, y que, exceptuando un tramo <strong>de</strong> <strong>la</strong><br />
AP-68 en el Territorio Histórico <strong>de</strong> Á<strong>la</strong>va, todas el<strong>la</strong>s superan también los 10.000 vehículos.<br />
En Bizkaia se superan los 20.000 vehículos / día en todos los tramos, siendo este el Territorio Histórico con<br />
mayor porcentaje <strong>de</strong> longitud en los rangos superiores <strong>de</strong> IMD.<br />
2,00%<br />
1,83%<br />
>80.000<br />
1,00%<br />
70,00%<br />
60,00%<br />
50,00%<br />
40,00%<br />
30,00%<br />
20,00%<br />
10,00%<br />
0,00%<br />
TRÁFICO EN LA RED FUNCIONAL DE LA CAPV (% KM)<br />
0-2000<br />
2000-5000<br />
5000-10000<br />
AUTOPISTAS<br />
10000-20000<br />
20000-40000<br />
40000-80000<br />
ÁLAVA GIPUZKOA BIZKAIA CAPV<br />
Fuente: E<strong>la</strong>boración propia a partir <strong>de</strong> los datos <strong>de</strong> <strong>la</strong>s Diputaciones Forales.<br />
Por su parte, <strong>la</strong>s Autovías y Vías <strong>de</strong> doble Calzada cuentan con una configuración semejante, estando <strong>la</strong><br />
totalidad <strong>de</strong> longitud <strong>de</strong> <strong>la</strong>s mismas por encima <strong>de</strong> los 10.000 vehículos / día. Nuevamente es Bizkaia el<br />
Territorio que cuenta con mayores IMD, siendo <strong>la</strong> única que cuenta con tramos por encima <strong>de</strong> los 80.000<br />
vehículos / día. En el <strong>la</strong>do contrario, Á<strong>la</strong>va carece <strong>de</strong> tramos <strong>de</strong> Autovías y Vías <strong>de</strong> Doble Calzada con IMD<br />
por encima <strong>de</strong> los 40.000 vehículos al día.<br />
>80000<br />
223<br />
Revisión <strong>de</strong>l Segundo P<strong>la</strong>n General <strong>de</strong> Carreteras <strong>de</strong>l País Vasco
80,00%<br />
70,00%<br />
60,00%<br />
50,00%<br />
40,00%<br />
30,00%<br />
20,00%<br />
10,00%<br />
0,00%<br />
TRÁFICO EN LA RED FUNCIONAL DE LA CAPV (% KM)<br />
0-2000<br />
AUTOVÍAS Y VÍAS DE DOBLE CALZADA<br />
2000-5000<br />
5000-10000<br />
10000-20000<br />
20000-40000<br />
40000-80000<br />
ÁLAVA GIPUZKOA BIZKAIA CAPV<br />
Fuente: E<strong>la</strong>boración propia a partir <strong>de</strong> los datos <strong>de</strong> <strong>la</strong>s Diputaciones Forales.<br />
Finalmente, en lo que se refiere a <strong>la</strong>s Carreteras Convencionales el perfil es el inverso, estando situada <strong>la</strong><br />
mayoría <strong>de</strong> tramos <strong>de</strong> estas vías por <strong>de</strong>bajo <strong>de</strong> los 20.000 vehículos día. Por otro <strong>la</strong>do, so<strong>la</strong>mente se supera<br />
este volumen <strong>de</strong> vehículos en los Territorios <strong>de</strong> Gipuzkoa y Á<strong>la</strong>va y, en concreto, en algunos tramos <strong>de</strong> <strong>la</strong> N-<br />
634, N-638 y <strong>de</strong> algunas <strong>de</strong> <strong>la</strong>s carreteras que forman parte <strong>de</strong>l Área Metropolitana <strong>de</strong> Bilbao, como <strong>la</strong> BI-<br />
604, BI-625, BI-631 y BI-634.<br />
>80000<br />
60,00%<br />
50,00%<br />
40,00%<br />
30,00%<br />
20,00%<br />
10,00%<br />
0,00%<br />
TRÁFICO EN LA RED FUNCIONAL DE LA CAPV (% KM)<br />
0-2000<br />
2000-5000<br />
CARRETERAS CONVENCIONALES<br />
5000-10000<br />
10000-20000<br />
20000-40000<br />
40000-80000<br />
ÁLAVA GIPUZKOA BIZKAIA CAPV<br />
Fuente: E<strong>la</strong>boración propia a partir <strong>de</strong> los datos <strong>de</strong> <strong>la</strong>s Diputaciones Forales.<br />
Por otro <strong>la</strong>do, en lo que se refiere a <strong>la</strong>s carreteras <strong>de</strong> <strong>la</strong> Red Objeto únicamente, se reproducen los perfiles<br />
ya vistos para <strong>la</strong> Red Funcional. Los tráficos menores se registran fundamentalmente en <strong>la</strong>s carreteras<br />
convencionales, no existiendo prácticamente tramo alguno <strong>de</strong> <strong>la</strong>s Autopistas y Autovías y Vías <strong>de</strong> Doble<br />
Calzada por <strong>de</strong>bajo <strong>de</strong> los 10.000 vehículos / día, con <strong>la</strong> excepción citada <strong>de</strong> un tramo <strong>de</strong> <strong>la</strong> AP-68 en Á<strong>la</strong>va.<br />
Por Territorios Históricos se observa que los rangos <strong>de</strong> IMD mayor tien<strong>de</strong>n a tener mayor porcentaje en<br />
Gipuzkoa y, sobre todo, en Bizkaia, mientras que en Á<strong>la</strong>va los volúmenes <strong>de</strong> tráfico son en general menores,<br />
careciendo, tal como ocurría con <strong>la</strong> Red Funcional, <strong>de</strong> tramos <strong>de</strong> <strong>la</strong> Red Objeto que superen los 40.000<br />
vehículos al día.<br />
>80000<br />
224<br />
Revisión <strong>de</strong>l Segundo P<strong>la</strong>n General <strong>de</strong> Carreteras <strong>de</strong>l País Vasco
70,00%<br />
60,00%<br />
50,00%<br />
40,00%<br />
30,00%<br />
20,00%<br />
10,00%<br />
0,00%<br />
TRÁFICO EN LA RED OBJETO DE LA CAPV (% KM)<br />
0-2000<br />
2000-5000<br />
TOTAL PARA LA CAPV<br />
5000-10000<br />
10000-20000<br />
20000-40000<br />
40000-80000<br />
>80000<br />
AUTOPISTAS AUTOVÍAS Y VÍAS DE DOBLE CALZADA CARRETERAS CONVENCIONALES<br />
80,00%<br />
70,00%<br />
60,00%<br />
50,00%<br />
40,00%<br />
30,00%<br />
20,00%<br />
10,00%<br />
0,00%<br />
Fuente: E<strong>la</strong>boración propia a partir <strong>de</strong> los datos <strong>de</strong> <strong>la</strong>s Diputaciones Forales.<br />
0-2000<br />
TRÁFICO EN LA RED OBJETO DE LA CAPV (% KM)<br />
2000-5000<br />
5000-10000<br />
ÁLAVA<br />
10000-20000<br />
20000-40000<br />
40000-80000<br />
>80000<br />
AUTOPISTAS AUTOVÍAS Y VÍAS DE DOBLE CALZADA CARRETERAS CONVENCIONALES<br />
Fuente: E<strong>la</strong>boración propia a partir <strong>de</strong> los datos <strong>de</strong> <strong>la</strong>s Diputaciones Forales.<br />
70,00%<br />
60,00%<br />
50,00%<br />
40,00%<br />
30,00%<br />
20,00%<br />
10,00%<br />
0,00%<br />
70,00%<br />
60,00%<br />
50,00%<br />
40,00%<br />
30,00%<br />
20,00%<br />
10,00%<br />
0,00%<br />
0-2000<br />
TRÁFICO EN LA RED OBJETO DE LA CAPV (% KM)<br />
2000-5000<br />
5000-10000<br />
BIZKAIA<br />
10000-20000<br />
20000-40000<br />
40000-80000<br />
>80000<br />
AUTOPISTAS AUTOVÍAS Y VÍAS DE DOBLE CALZADA CARRETERAS CONVENCIONALES<br />
Fuente: E<strong>la</strong>boración propia a partir <strong>de</strong> los datos <strong>de</strong> <strong>la</strong>s Diputaciones Forales.<br />
0-2000<br />
TRÁFICO EN LA RED OBJETO DE LA CAPV (% KM)<br />
2000-5000<br />
5000-10000<br />
GIPUZKOA<br />
10000-20000<br />
20000-40000<br />
40000-80000<br />
>80000<br />
AUTOPISTAS AUTOVÍAS Y VÍAS DE DOBLE CALZADA CARRETERAS CONVENCIONALES<br />
Fuente: E<strong>la</strong>boración propia a partir <strong>de</strong> los datos <strong>de</strong> <strong>la</strong>s Diputaciones Forales.<br />
225<br />
Revisión <strong>de</strong>l Segundo P<strong>la</strong>n General <strong>de</strong> Carreteras <strong>de</strong>l País Vasco
<strong>2.</strong><strong>2.</strong><strong>2.</strong>6. Evolución <strong>de</strong>l Tráfico según tipo <strong>de</strong> <strong>red</strong><br />
El crecimiento global <strong>de</strong>l tráfico en <strong>la</strong>s carreteras que conforman <strong>la</strong> Red Funcional <strong>de</strong> <strong>la</strong> Comunidad<br />
Autónoma <strong>de</strong>l País Vasco ha sido <strong>de</strong>l 4,05% medio anual en el período 1997 – 2003.<br />
Por tipo <strong>de</strong> <strong>red</strong> el crecimiento más importante ha sido el registrado por <strong>la</strong> Red <strong>de</strong> Interés Preferente, que ha<br />
crecido en el período a un ritmo <strong>de</strong>l 4,73% anual. La Red Básica ha crecido a <strong>la</strong> misma tasa que el conjunto,<br />
4,05%, mientras que el crecimiento <strong>de</strong> <strong>la</strong> Red Comarcal ha sido ligeramente inferior, a un 3,59% anual.<br />
5,00%<br />
4,50%<br />
4,00%<br />
3,50%<br />
3,00%<br />
2,50%<br />
2,00%<br />
1,50%<br />
1,00%<br />
0,50%<br />
0,00%<br />
EVOLUCIÓN DEL TRÁFICO EN LA RED FUNCIONAL. 1997 - 2003<br />
4,73%<br />
RIP<br />
RB<br />
4,05%<br />
CAPV<br />
3,59%<br />
RC<br />
TOTAL<br />
4,05%<br />
Fuente: E<strong>la</strong>boración propia a partir <strong>de</strong> los datos <strong>de</strong> <strong>la</strong>s Diputaciones Forales.<br />
En el Territorio Histórico <strong>de</strong> Á<strong>la</strong>va el tráfico creció en el mismo período al 4,83% anual, siendo en este caso<br />
<strong>la</strong> Red con mayor crecimiento <strong>la</strong> Básica, con una tasa <strong>de</strong>l 5,38%, seguida <strong>de</strong> <strong>la</strong> Red Comarcal, con un<br />
crecimiento <strong>de</strong>l 5,09%. La Red <strong>de</strong> Interés Preferente creció en el período al 3,98% anual.<br />
EVOLUCIÓN DEL TRÁFICO EN LA RED FUNCIONAL. 1997 - 2003<br />
6,00%<br />
5,00%<br />
4,00%<br />
3,00%<br />
2,00%<br />
1,00%<br />
0,00%<br />
3,98%<br />
RIP<br />
RB<br />
5,38%<br />
ALAVA<br />
5,09%<br />
RC<br />
TOTAL<br />
4,83%<br />
Fuente: E<strong>la</strong>boración propia a partir <strong>de</strong> los datos <strong>de</strong> <strong>la</strong>s Diputaciones Forales.<br />
Por su parte, <strong>la</strong> Red vizcaína fue <strong>la</strong> que experimentó el menor crecimiento global <strong>de</strong> los tres Territorios<br />
Históricos. Sin embargo, Bizkaia obtuvo el mayor crecimiento en <strong>la</strong> Red <strong>de</strong> Interés Preferente, alcanzando el<br />
5,11% anual. La Red Básica lo hizo a un ritmo <strong>de</strong>l 3,45%, mientras que el crecimiento <strong>de</strong> <strong>la</strong> Red Comarcal<br />
se sitúa por <strong>de</strong>bajo, con una tasa <strong>de</strong> tan sólo el 2,06%.<br />
226<br />
Revisión <strong>de</strong>l Segundo P<strong>la</strong>n General <strong>de</strong> Carreteras <strong>de</strong>l País Vasco
EVOLUCIÓN DEL TRÁFICO EN LA RED FUNCIONAL. 1997 - 2003<br />
6,00%<br />
5,00%<br />
4,00%<br />
3,00%<br />
2,00%<br />
1,00%<br />
0,00%<br />
5,11%<br />
RIP<br />
RB<br />
3,45%<br />
BIZKAIA<br />
2,06%<br />
RC<br />
TOTAL<br />
3,30%<br />
Fuente: E<strong>la</strong>boración propia a partir <strong>de</strong> los datos <strong>de</strong> <strong>la</strong>s Diputaciones Forales.<br />
Finalmente, Gipuzkoa obtuvo un crecimiento global <strong>de</strong>l 4,47% anual. La Red <strong>de</strong> Interés Preferente<br />
guipuzcoana creció a un ritmo ligeramente inferior al <strong>de</strong> Bizkaia, 5,08%, mientras que <strong>la</strong> Red Básica lo hizo<br />
al 3,65% y <strong>la</strong> Red Comarcal creció al 4,52%.<br />
EVOLUCIÓN DEL TRÁFICO EN LA RED FUNCIONAL. 1997 – 2003. GIPUZKOA<br />
6,00%<br />
5,00%<br />
4,00%<br />
3,00%<br />
2,00%<br />
1,00%<br />
0,00%<br />
5,08%<br />
RIP<br />
RB<br />
3,65%<br />
4,52%<br />
RC<br />
4,47%<br />
TOTAL<br />
Fuente: E<strong>la</strong>boración propia a partir <strong>de</strong> los datos <strong>de</strong> <strong>la</strong>s Diputaciones Forales.<br />
227<br />
Revisión <strong>de</strong>l Segundo P<strong>la</strong>n General <strong>de</strong> Carreteras <strong>de</strong>l País Vasco
<strong>2.</strong><strong>2.</strong>3 Capacidad <strong>de</strong> <strong>la</strong> <strong>red</strong> y niveles <strong>de</strong> servicio<br />
La <strong>de</strong>terminación <strong>de</strong>l nivel <strong>de</strong> servicio <strong>de</strong> una infraestructura <strong>viaria</strong> surge <strong>de</strong> <strong>la</strong> necesidad <strong>de</strong> precisar <strong>la</strong><br />
re<strong>la</strong>ción entre <strong>la</strong> oferta <strong>viaria</strong> y <strong>la</strong> <strong>de</strong>manda que canaliza. Este indicador aporta un índice que representa <strong>la</strong><br />
idoneidad <strong>de</strong> <strong>la</strong> infraestructura existente así como <strong>la</strong> a<strong>de</strong>cuación entre ambas variables.<br />
El cálculo <strong>de</strong>l nivel <strong>de</strong> servicio <strong>de</strong> los diferentes tramos se ha realizado <strong>de</strong> acuerdo con los criterios recogidos<br />
en el Manual <strong>de</strong> Capacidad en su versión más mo<strong>de</strong>rna y adaptada al sistema métrico (Highway Capacity<br />
Manual 2000), en el que se <strong>de</strong>finen los siguientes conceptos que son el fundamento <strong>de</strong>l cálculo:<br />
√ Se <strong>de</strong>fine como capacidad <strong>de</strong> una insta<strong>la</strong>ción al máximo flujo <strong>de</strong> vehículos al que se pue<strong>de</strong><br />
razonablemente esperar que atraviese un punto o sección uniforme <strong>de</strong> un carril o una carretera durante<br />
un periodo <strong>de</strong> tiempo dado y sometido a <strong>la</strong>s condiciones p<strong>red</strong>ominantes <strong>de</strong> <strong>la</strong> carretera, <strong>la</strong> circu<strong>la</strong>ción y<br />
los sistemas <strong>de</strong> control. En esta <strong>de</strong>finición van implícitas algunas consi<strong>de</strong>raciones, tales como que <strong>la</strong><br />
capacidad normalmente se refiere a una sección o segmento uniforme <strong>de</strong> <strong>la</strong> infraestructura, y que se<br />
refiere a una tasa <strong>de</strong> flujo vehicu<strong>la</strong>r durante un periodo específico <strong>de</strong> tiempo. Este periodo es, muy a<br />
menudo, el periodo <strong>de</strong> 15 minutos punta.<br />
√ El concepto <strong>de</strong> niveles <strong>de</strong> servicio utiliza medidas cualitativas que caracterizan tanto <strong>la</strong>s condiciones<br />
<strong>de</strong> explotación <strong>de</strong>l tráfico vial como su percepción por los conductores y pasajeros. La <strong>de</strong>scripción <strong>de</strong> los<br />
niveles <strong>de</strong> servicio individuales caracteriza estas condiciones en términos <strong>de</strong> factores tales como <strong>la</strong><br />
velocidad y el tiempo recorrido, <strong>la</strong> libertad <strong>de</strong> maniobra, <strong>la</strong>s interrupciones a <strong>la</strong> circu<strong>la</strong>ción y el confort y<br />
<strong>la</strong> conveniencia.<br />
√ Para cada tipo <strong>de</strong> infraestructura s <strong>de</strong>finen 6 niveles <strong>de</strong> servicio para los cuáles se dispone <strong>de</strong><br />
procedimientos <strong>de</strong> <strong>análisis</strong>. Se les otorga una letra dada como <strong>de</strong>signación, <strong>de</strong> <strong>la</strong> A a <strong>la</strong> F, siendo el Nivel<br />
<strong>de</strong> Servicio A (NS) el representante <strong>de</strong> <strong>la</strong>s mejores condiciones operativas y el NS F <strong>la</strong>s peores. Con el<br />
objeto <strong>de</strong> centrar lo que implica esta c<strong>la</strong>sificación, se adjunta <strong>la</strong> <strong>de</strong>scripción <strong>de</strong> los niveles <strong>de</strong> servicio para<br />
vías <strong>de</strong> gran capacidad.<br />
• El nivel <strong>de</strong> servicio A (óptimo) es aquél en el que <strong>la</strong> <strong>situación</strong> percibida por los vehículos o usuarios<br />
es muy próxima a <strong>la</strong> <strong>de</strong>seada. Existe poca interacción entre vehículos, y cuando uno alcanza a otro,<br />
pue<strong>de</strong> a<strong>de</strong><strong>la</strong>ntarlo sin sufrir ninguna <strong>de</strong>mora. Se trata <strong>de</strong> una circu<strong>la</strong>ción libre, en <strong>la</strong> que los<br />
conductores experimentan una gran comodidad, tanto física como psicológica. No se producen<br />
inci<strong>de</strong>ncias en cada trayectoria, y <strong>la</strong>s que se producen se disipan sin afectar a <strong>la</strong> circu<strong>la</strong>ción.<br />
• Cuando se da el nivel <strong>de</strong> servicio B (bueno), <strong>la</strong> <strong>situación</strong> percibida por los usuarios es simi<strong>la</strong>r a <strong>la</strong><br />
<strong>de</strong>seada. La capacidad <strong>de</strong> maniobra <strong>de</strong> los distintos vehículos se ve sólo ligeramente afectada por los<br />
otros. Se producen mayores interacciones que en el nivel <strong>de</strong> servicio A, pero <strong>la</strong>s velocida<strong>de</strong>s no<br />
<strong>de</strong>scien<strong>de</strong>n apreciablemente, y <strong>la</strong>s inci<strong>de</strong>ncias son absorbidas pronto y con facilidad.<br />
• Si se alcanza el nivel <strong>de</strong> servicio C (normal), <strong>la</strong> proximidad <strong>de</strong> los <strong>de</strong>más vehículos hace que <strong>la</strong><br />
tensión psicológica <strong>de</strong> los usuarios sea más alta, y <strong>la</strong>s interferencias entre usuarios son frecuentes. La<br />
circu<strong>la</strong>ción sigue siendo estable, pero se producen perturbaciones localizadas que crean co<strong>la</strong>s y<br />
<strong>de</strong>moras significativas.<br />
• Un aumento <strong>de</strong> <strong>la</strong> <strong>de</strong>manda respecto al nivel anterior, hace que se alcance el nivel <strong>de</strong> servicio D<br />
(aceptable). En esta <strong>situación</strong>, todos los conductores ven condicionada su <strong>situación</strong> por <strong>la</strong> <strong>de</strong>l conjunto<br />
<strong>de</strong> los usuarios. Se forman <strong>la</strong>rgas co<strong>la</strong>s y <strong>la</strong> circu<strong>la</strong>ción o <strong>la</strong> respuesta <strong>de</strong>l sistema se ve muy alterada<br />
por <strong>la</strong>s eventuales perturbaciones producidas por maniobras <strong>de</strong> usuarios individuales. Esta <strong>situación</strong><br />
es inestable, pudiendo mantenerse sólo durante cortos periodos <strong>de</strong> tiempo.<br />
• Cuando se alcanza <strong>la</strong> capacidad, el nivel <strong>de</strong> servicio es E (malo). Se forman <strong>la</strong>rgas co<strong>la</strong>, y <strong>la</strong><br />
<strong>de</strong>nsidad es muy alta. Este nivel <strong>de</strong> uso es inestable, y cualquier alteración, incluso pequeña, provoca<br />
el co<strong>la</strong>pso, que por <strong>la</strong> elevada <strong>de</strong>manda no pue<strong>de</strong> disiparse rápidamente, pasándose al nivel <strong>de</strong><br />
servicio F.<br />
• Si se alcanza el nivel <strong>de</strong> servicio F (pésimo), los usuarios experimentan una congestión. La<br />
<strong>de</strong>manda ha sobrepasado <strong>la</strong> capacidad, y los usuarios tienen interrupciones <strong>de</strong> servicio frecuentes. La<br />
co<strong>la</strong> crece, por lo que el tiempo experimentado <strong>de</strong>ntro <strong>de</strong> <strong>la</strong> congestión aumenta, siendo mayor para<br />
conductores que llegan a <strong>la</strong> congestión una vez está se ha producido. La <strong>de</strong>nsidad será muy alta y <strong>la</strong><br />
insatisfacción <strong>de</strong> los usuarios muy acusada.<br />
<strong>2.</strong><strong>2.</strong>3.1. Procedimiento <strong>de</strong> cálculo<br />
El procedimiento <strong>de</strong> cálculo varía entre carreteras convencionales y vías <strong>de</strong> gran capacidad, tal y como<br />
refleja el HCM 2000. Para ambos casos, se ha utilizado una intensidad horaria <strong>de</strong> cálculo equivalente a una<br />
IH-100, es <strong>de</strong>cir, aquel<strong>la</strong> intensidad únicamente superada por cien mediciones horarias en todo el periodo<br />
anual.<br />
Vías <strong>de</strong> gran capacidad<br />
Los procedimientos <strong>de</strong>scritos por el Manual <strong>de</strong> Capacidad en su última versión se aplican a una calzada <strong>de</strong><br />
los tramos con circu<strong>la</strong>ción continua, es <strong>de</strong>cir, <strong>de</strong> los que no están afectados por los movimientos <strong>de</strong><br />
convergencia, divergencia o trenzado <strong>de</strong>bidos a <strong>la</strong> proximidad <strong>de</strong> un en<strong>la</strong>ce.<br />
231<br />
Revisión <strong>de</strong>l Segundo P<strong>la</strong>n General <strong>de</strong> Carreteras <strong>de</strong>l País Vasco
El procedimiento empleado por este Manual para el cálculo <strong>de</strong> los Niveles <strong>de</strong> Servicio es el siguiente:<br />
√ Determinar <strong>la</strong> capacidad o intensidad <strong>de</strong> servicio en condiciones i<strong>de</strong>ales. Para ello, se calcu<strong>la</strong> en<br />
primer lugar <strong>la</strong> capacidad que tendría un tramo <strong>de</strong>l mismo tipo que el estudiado, pero en condiciones<br />
i<strong>de</strong>ales <strong>de</strong> circu<strong>la</strong>ción.<br />
√ Determinar los factores <strong>de</strong> corrección. Puesto que <strong>la</strong> calzada no cumplirá <strong>la</strong>s condiciones i<strong>de</strong>ales <strong>de</strong><br />
circu<strong>la</strong>ción es necesario aplicar estos factores a <strong>la</strong> capacidad o intensidad <strong>de</strong> servicio en función <strong>de</strong> <strong>la</strong>s<br />
características reales <strong>de</strong> <strong>la</strong> carretera.<br />
√ Calcu<strong>la</strong>r el valor real <strong>de</strong> <strong>la</strong> capacidad o intensidad <strong>de</strong> servicio <strong>de</strong> <strong>la</strong> carretera.<br />
Como magnitud que <strong>de</strong>fine el nivel <strong>de</strong> servicio se emplea <strong>la</strong> <strong>de</strong>nsidad <strong>de</strong> tráfico, medida en vehículos<br />
equivalentes a coches por kilómetro y carril. Los valores que <strong>de</strong>finen los niveles <strong>de</strong> servicio son los indicados<br />
en <strong>la</strong> siguiente tab<strong>la</strong>.<br />
DEFINICIÓN DE NIVELES DE SERVICIO<br />
Densidad máxima<br />
Nivel <strong>de</strong> servicio<br />
(coches/km/carril)<br />
A 7<br />
B 11<br />
C 16<br />
D 22<br />
E 28<br />
F > 28<br />
Fuente: TRB Manual <strong>de</strong> Capacidad 2000.<br />
Las condiciones i<strong>de</strong>ales <strong>de</strong> circu<strong>la</strong>ción en autopistas y autovías son<br />
√ Anchura <strong>de</strong> carril no inferior a 3,60 m<br />
√ Obstáculos <strong>la</strong>terales a <strong>la</strong> <strong>de</strong>recha a más <strong>de</strong> 1,80 m<br />
√ Obstáculos <strong>la</strong>terales a <strong>la</strong> izquierda (mediana) a más <strong>de</strong> 0,60 m<br />
√ Tráfico formado exclusivamente por coches<br />
√ Terreno l<strong>la</strong>no (rampas con inclinación inferior al 2%)<br />
√ En<strong>la</strong>ces separados a más <strong>de</strong> 3 km<br />
√ Conductores que conocen <strong>la</strong> vía<br />
En estas vías se estudia cada calzada por separado. Es necesario conocer <strong>la</strong> intensidad <strong>de</strong>l tráfico en <strong>la</strong><br />
calzada que se estudie durante un periodo punta <strong>de</strong> 15 minutos. Como normalmente se conoce <strong>la</strong> intensidad<br />
media durante una hora, hay que aplicarle un factor hora punta para obtener <strong>la</strong> intensidad horaria en los<br />
15 minutos <strong>de</strong> punta.<br />
siendo:<br />
I 15 =<br />
I<br />
FHP<br />
I15 <strong>la</strong> intensidad horaria durante los 15 minutos <strong>de</strong> punta.<br />
I <strong>la</strong> intensidad media durante <strong>la</strong> hora.<br />
FHP el factor hora punta.<br />
Una variable muy importante para <strong>de</strong>terminar <strong>la</strong> capacidad es <strong>la</strong> velocidad libre (VL) en <strong>la</strong> vía. Esta se<br />
<strong>de</strong>fine como <strong>la</strong> velocidad media <strong>de</strong> los coches cuando el tráfico es poco intenso (inferior a 1.300<br />
coches/hora/carril). Es posible estimar esta velocidad teniendo en cuenta <strong>la</strong>s características <strong>de</strong> <strong>la</strong> vía. Si no<br />
es posible medir <strong>la</strong> velocidad libre (como en el caso <strong>de</strong> una carretera en proyecto), se pue<strong>de</strong> estimar<br />
partiendo <strong>de</strong> una velocidad libre básica (VLB), que es <strong>la</strong> velocidad libre en <strong>la</strong>s condiciones i<strong>de</strong>ales. A esta<br />
velocidad básica se le aplican unas correcciones para tener en cuenta <strong>la</strong>s características reales <strong>de</strong> <strong>la</strong> vía.<br />
Como velocidad libre básica suele tomarse <strong>la</strong> específica <strong>de</strong> <strong>la</strong> vía, o <strong>la</strong> velocidad máxima autorizada si fuera<br />
menor que el<strong>la</strong>. La velocidad libre corregida será:<br />
siendo:<br />
VL <strong>la</strong> velocidad libre real (km/h).<br />
VLB <strong>la</strong> velocidad libre básica (km/h).<br />
VL = VLB − f − f −<br />
fa el factor <strong>de</strong> corrección por anchura <strong>de</strong> carril.<br />
fo el factor <strong>de</strong> corrección por obstáculos <strong>la</strong>terales. Depen<strong>de</strong> <strong>de</strong>l número <strong>de</strong> carriles.<br />
fc el factor <strong>de</strong> corrección por separación entre en<strong>la</strong>ces.<br />
Cada uno <strong>de</strong> estos factores adopta un valor <strong>de</strong>terminado que penaliza <strong>la</strong> velocidad libre tanto más cuanto<br />
más se alejen <strong>la</strong>s condiciones <strong>de</strong> <strong>la</strong> vía en estudio <strong>de</strong> <strong>la</strong>s condiciones i<strong>de</strong>ales.<br />
a<br />
o<br />
f<br />
e<br />
232<br />
Revisión <strong>de</strong>l Segundo P<strong>la</strong>n General <strong>de</strong> Carreteras <strong>de</strong>l País Vasco
Cuando el tráfico no está formado exclusivamente por coches es necesario obtener <strong>la</strong> intensidad <strong>de</strong> un<br />
tráfico equivalente que esté formado únicamente por coches. Para ello se aplican unos factores <strong>de</strong><br />
equivalencia que sirvan para <strong>de</strong>terminar a cuántos coches equivale cada vehículo <strong>de</strong> otro tipo. Estos factores<br />
<strong>de</strong> equivalencia <strong>de</strong>pen<strong>de</strong>n <strong>de</strong>l tipo <strong>de</strong> vehículo (camiones y autobuses, vehículos <strong>de</strong> recreo) y <strong>de</strong> <strong>la</strong>s<br />
características <strong>de</strong>l trazado que, a su vez, <strong>de</strong>pen<strong>de</strong>n <strong>de</strong>l relieve <strong>de</strong>l terreno atravesado (l<strong>la</strong>no, ondu<strong>la</strong>do o<br />
acci<strong>de</strong>ntado). Si se conoce <strong>la</strong> composición <strong>de</strong>l tráfico (porcentaje <strong>de</strong> vehículos pesados y <strong>de</strong> recreo, pp y pr)<br />
y los correspondientes factores <strong>de</strong> equivalencia Ep y Er, <strong>la</strong> intensidad en vehículos equivalentes será:<br />
siendo:<br />
I<br />
eq<br />
100<br />
= I ⋅<br />
- p<br />
p<br />
− p<br />
r<br />
+ p<br />
p<br />
100<br />
⋅ E<br />
p<br />
+ p<br />
I <strong>la</strong> intensidad en vehículos/hora/carril pon<strong>de</strong>rada por el factor hora punta.<br />
fvp el factor <strong>de</strong> vehículos pesados.<br />
Este factor <strong>de</strong> vehículos pesados pue<strong>de</strong> consi<strong>de</strong>rarse como un factor <strong>de</strong> corrección que, multiplicado por <strong>la</strong><br />
intensidad en coches (vehículos equivalentes), y a <strong>la</strong> inversa, dividiendo <strong>la</strong> intensidad en coches por este<br />
factor se obtiene <strong>la</strong> intensidad en vehículos reales.<br />
La capacidad medida en coches/hora/carril, adopta <strong>la</strong> siguiente expresión:<br />
C = 1 . 800 + 5 ⋅VL<br />
En estas circunstancias, <strong>la</strong> <strong>de</strong>nsidad medida en coches/km/carril cuando se alcanza <strong>la</strong> capacidad es Dc = 28<br />
La velocidad <strong>de</strong> los coches cuando se alcanza <strong>la</strong> capacidad (Vc, en km/h) vendrá dada por:<br />
V = C<br />
c Dc<br />
La velocidad en otros niveles <strong>de</strong> servicio es constante e igual a <strong>la</strong> velocidad libre mientras <strong>la</strong> intensidad no<br />
sobrepase un valor límite IL que viene dado por <strong>la</strong> expresión:<br />
I L<br />
= 3.<br />
100 −15<br />
⋅VL<br />
Para unas intensida<strong>de</strong>s mayores que IL <strong>la</strong> velocidad se va <strong>red</strong>uciendo hasta hacerse igual a Vc cuando se<br />
alcanza <strong>la</strong> capacidad. Las expresiones que permiten calcu<strong>la</strong>r <strong>la</strong> velocidad en función <strong>de</strong> <strong>la</strong> intensidad son:<br />
Para Ieq < IL<br />
Para Ieq > IL<br />
V= VL<br />
r<br />
⋅ E<br />
r<br />
siendo:<br />
Ieq <strong>la</strong> intensidad equivalente.<br />
V = VL -<br />
V <strong>la</strong> velocidad <strong>de</strong> los coches en km/h.<br />
a un coeficiente cuyo valor es 2,6.<br />
( VL - V )<br />
C<br />
⎛ Ieq<br />
− I<br />
⋅<br />
⎜<br />
⎝ C - I L<br />
La aplicación <strong>de</strong> estas ecuaciones permite <strong>de</strong>terminar el nivel <strong>de</strong> servicio conociendo <strong>la</strong> intensidad en<br />
vehículos equivalentes, ya que permite <strong>de</strong>terminar <strong>la</strong> velocidad V <strong>de</strong> los coches y <strong>la</strong> <strong>de</strong>nsidad, que <strong>de</strong>fine el<br />
nivel <strong>de</strong> servicio.<br />
I<br />
D =<br />
En todo el procedimiento se han tomado como datos básicos un porcentaje <strong>de</strong> vehículos para <strong>la</strong> hora <strong>de</strong><br />
cálculo <strong>de</strong>l 10% <strong>de</strong> <strong>la</strong> IMD y un reparto por sentidos 60/40.<br />
Carretera convencional<br />
El estudio <strong>de</strong> capacidad y niveles <strong>de</strong> servicio en este caso es susceptible <strong>de</strong> realizarse siguiendo dos<br />
procedimientos:<br />
√ Como tramo bidireccional <strong>de</strong> dos carriles, si <strong>la</strong> sección tipo y <strong>la</strong> <strong>de</strong>manda son re<strong>la</strong>tivamente<br />
homogéneas, <strong>la</strong> topografía l<strong>la</strong>na u ondu<strong>la</strong>da y no presenta por ello rampas pronunciadas.<br />
√ Como segmento unidireccional en caso <strong>de</strong> no darse <strong>la</strong>s circunstancias anteriores o fuera aconsejable<br />
analizar los dos sentidos separadamente.<br />
Para el caso objeto <strong>de</strong> este estudio se ha supuesto que <strong>la</strong>s carreteras correspon<strong>de</strong>n a <strong>la</strong> tipología c<strong>la</strong>se I,<br />
correspondientes a vías interurbanas <strong>de</strong> cierta importancia.<br />
La <strong>de</strong>terminación <strong>de</strong> los niveles <strong>de</strong> servicio en este caso, respon<strong>de</strong> a <strong>la</strong> c<strong>la</strong>sificación conjunta <strong>de</strong> los<br />
siguientes criterios, correspondientes a <strong>la</strong>s condiciones <strong>de</strong> tiempo siguiendo a otro vehículo (PTSF) y<br />
velocidad media <strong>de</strong> recorrido (ATS).<br />
eq<br />
V<br />
L<br />
⎞<br />
⎟<br />
⎠<br />
a<br />
233<br />
Revisión <strong>de</strong>l Segundo P<strong>la</strong>n General <strong>de</strong> Carreteras <strong>de</strong>l País Vasco
NS<br />
CRITERIOS DE DETERMINACIÓN DE NIVELES DE SERVICIO<br />
Porcentaje <strong>de</strong> tiempo consumido<br />
en seguimiento (PTSF)<br />
Velocidad media <strong>de</strong><br />
recorrido (ATS) (km/h)<br />
A ≤ 35 > 90<br />
B > 35 – 50 > 80 – 90<br />
C > 50 – 65 > 70 - 80<br />
D > 65 – 80 > 60 – 70<br />
E > 80 ≤ 60<br />
Fuente: TRB Manual <strong>de</strong> Capacidad 2000.<br />
Nota: Se asigna NS F cuando el flujo exce<strong>de</strong> <strong>la</strong> capacidad <strong>de</strong>l tramo.<br />
La <strong>de</strong>terminación <strong>de</strong> <strong>la</strong> velocidad en flujo libre (FFS) es <strong>la</strong> teórica que <strong>de</strong>sarrol<strong>la</strong>ría un vehículo en el<br />
tramo si <strong>la</strong> <strong>de</strong>nsidad <strong>de</strong>l tráfico fuera nu<strong>la</strong>, es <strong>de</strong>cir, si no concurrieran otros vehículos. Este valor se obtiene<br />
a partir <strong>de</strong> <strong>la</strong> siguiente expresión:<br />
siendo:<br />
FFS = BFFS-<br />
f LS - f<br />
FFS <strong>la</strong> velocidad estimada en flujo libre (km/h).<br />
BFFS <strong>la</strong> velocidad básica en flujo libre, asimi<strong>la</strong>ble a <strong>la</strong> específica (km/h).<br />
fLS el factor <strong>de</strong> ajuste por anchura <strong>de</strong> carril y anchura <strong>de</strong> arcén.<br />
fA el ajuste por frecuencia <strong>de</strong> accesos.<br />
La <strong>de</strong>terminación <strong>de</strong> <strong>la</strong> tasa <strong>de</strong> flujo <strong>de</strong> <strong>de</strong>manda en el periodo que se <strong>de</strong>sea estudiar se realizará mediante<br />
<strong>la</strong> expresión:<br />
siendo:<br />
v<br />
p<br />
V<br />
=<br />
PHF ⋅ f<br />
vp el flujo equivalente <strong>de</strong> automóviles para <strong>la</strong> punta <strong>de</strong> 15 minutos en vehículos equivalentes / hora<br />
V el volumen <strong>de</strong> <strong>de</strong>manda para <strong>la</strong> hora completa, vehículos / h.<br />
PHF el factor <strong>de</strong> hora punta.<br />
fG el factor <strong>de</strong> ajuste por pendiente.<br />
G<br />
⋅ f<br />
HV<br />
A<br />
fHV el factor <strong>de</strong> ajuste por vehículos pesados.<br />
La velocidad media <strong>de</strong> recorrido (ATS) necesaria para <strong>la</strong> <strong>de</strong>terminación <strong>de</strong>l NS se obtiene a través <strong>de</strong> <strong>la</strong><br />
siguiente expresión:<br />
don<strong>de</strong>:<br />
ATS es <strong>la</strong> velocidad media <strong>de</strong> recorrido.<br />
ATS = FFS − 0 , 0125⋅<br />
v −<br />
FFS es <strong>la</strong> velocidad estimada en flujo libre (km/h).<br />
vp el flujo equivalente <strong>de</strong> automóviles para <strong>la</strong> punta <strong>de</strong> 15 minutos en vehículos equivalentes / hora.<br />
fnp es el factor <strong>de</strong> ajuste por porcentaje <strong>de</strong> zonas <strong>de</strong> prohibición <strong>de</strong> a<strong>de</strong><strong>la</strong>ntamiento.<br />
La <strong>de</strong>terminación <strong>de</strong> <strong>la</strong> proporción <strong>de</strong> tiempo <strong>de</strong> seguimiento (PTSF), se realiza mediante <strong>la</strong> expresión:<br />
siendo:<br />
PTSF = BPTSF +<br />
f<br />
d<br />
np<br />
= 100 ⋅<br />
PTSF el porcentaje <strong>de</strong> tiempo <strong>de</strong> seguimiento <strong>de</strong> otro vehículo.<br />
BPTSF <strong>la</strong> estimación básica <strong>de</strong> <strong>la</strong> variable anterior.<br />
P<br />
f<br />
np<br />
−0, 000879⋅v<br />
p [ 1−<br />
e ] + f d<br />
np<br />
fn/dp el ajuste por efecto combinado <strong>de</strong>l reparto direccional <strong>de</strong> los sentidos <strong>de</strong> tráfico y <strong>de</strong> <strong>la</strong>s<br />
restricciones <strong>de</strong> a<strong>de</strong><strong>la</strong>ntamiento.<br />
vp el flujo equivalente <strong>de</strong> automóviles para <strong>la</strong> punta <strong>de</strong> 15 minutos en vehículos equivalentes/hora.<br />
La <strong>de</strong>terminación <strong>de</strong>l nivel <strong>de</strong> servicio se realiza a partir <strong>de</strong> <strong>la</strong> comparación <strong>de</strong> los valores ATS y PTSF con<br />
los <strong>de</strong>scritos para cada NS, teniendo en cuanta que valores superiores a 3.2000 vehículos equivalentes por<br />
hora <strong>de</strong> vp hacen que <strong>la</strong> carretera se consi<strong>de</strong>re saturada y por tanto se corresponda a un nivel <strong>de</strong> servicio F.<br />
Asimismo, si <strong>la</strong> fracción <strong>de</strong> vp que circu<strong>la</strong> por el carril más cargado supera los 1.700 vehículos equivalentes /<br />
hora, también se asigna un nivel <strong>de</strong> servicio F.<br />
En todo el procedimiento se han tomado como datos básicos un porcentaje <strong>de</strong> vehículos para <strong>la</strong> hora <strong>de</strong><br />
cálculo <strong>de</strong>l 6,25% <strong>de</strong> <strong>la</strong> IMD y un reparto por sentidos 60/40.<br />
234<br />
Revisión <strong>de</strong>l Segundo P<strong>la</strong>n General <strong>de</strong> Carreteras <strong>de</strong>l País Vasco
<strong>2.</strong><strong>2.</strong>3.<strong>2.</strong> Situación <strong>actual</strong> en <strong>la</strong> Red Objeto<br />
Analizando por Territorio Histórico, es Á<strong>la</strong>va don<strong>de</strong> se registran <strong>la</strong>s mejores condiciones <strong>de</strong> circu<strong>la</strong>ción, pues<br />
el 25% <strong>de</strong>l total <strong>de</strong> sus carreteras tienen un Nivel <strong>de</strong> Servicio A, es <strong>de</strong>cir, una <strong>situación</strong> óptima <strong>de</strong><br />
circu<strong>la</strong>ción; el 31% un Nivel <strong>de</strong> Servicio B y por tanto muy buenas condiciones <strong>de</strong> circu<strong>la</strong>ción y, otro elevado<br />
porcentaje <strong>de</strong> sus carreteras, el 29% disponen <strong>de</strong> un Nivel <strong>de</strong> Servicio C, es <strong>de</strong>cir, <strong>de</strong> unas condiciones <strong>de</strong><br />
circu<strong>la</strong>ción buenas. Cabe <strong>de</strong>stacar a<strong>de</strong>más, que en Á<strong>la</strong>va no existe ningún tramo <strong>de</strong> carretera en <strong>situación</strong><br />
<strong>de</strong> nivel <strong>de</strong> servicio pésimo (Nivel <strong>de</strong> Servicio F).<br />
En los Territorios <strong>de</strong> Gipuzkoa y Bizkaia, <strong>la</strong>s condiciones <strong>de</strong> circu<strong>la</strong>ción no son tan a<strong>de</strong>cuadas, pues un<br />
elevado porcentaje <strong>de</strong> sus carreteras tienen Niveles <strong>de</strong> Servicio comprendidos entre D y F.<br />
NIVEL DE SERVICIO POR TERRITORIO HISTÓRICO<br />
(% KILÓMETROS DE RED OBJETO)<br />
Nivel <strong>de</strong><br />
Servicio<br />
Á<strong>la</strong>va Bizkaia Gipuzkoa CAPV<br />
A 25 10 15 16<br />
B 31 11 11 17<br />
C 28 14 8 16<br />
D 3 11 23 12<br />
E 13 48 40 35<br />
F 0 6 2 3<br />
Fuente: E<strong>la</strong>boración propia<br />
En el Territorio Histórico <strong>de</strong> Á<strong>la</strong>va, <strong>la</strong> mayor parte <strong>de</strong> los tramos <strong>de</strong> carretera <strong>de</strong> <strong>la</strong> Red Objeto tienen unas<br />
condiciones <strong>de</strong> tráfico a<strong>de</strong>cuadas, repartiéndose el 84% <strong>de</strong> <strong>la</strong> longitud total entre niveles <strong>de</strong> servicio A y C.<br />
Tan sólo un 16% <strong>de</strong> su longitud presentan Niveles <strong>de</strong> Servicio superiores al C, y no existe ningún tramo <strong>de</strong><br />
carretera que se encuentre en el nivel <strong>de</strong> servicio F, el más <strong>de</strong>ficiente.<br />
Los tramos con nivel <strong>de</strong> servicio E se concentran en Á<strong>la</strong>va en <strong>la</strong>s siguientes carreteras:<br />
√ N-104, <strong>de</strong> Elorriaga a <strong>la</strong> N-I, P.K. 354,1 a 363,6.<br />
√ N-124, <strong>de</strong> Ribaguda, cerca <strong>de</strong> <strong>la</strong> AP-68, al límite provincial <strong>de</strong> La Rioja.<br />
√ N-240, <strong>de</strong> Legutiano al límite con Bizkaia, tramo que esta carretera no es autovía, entre los P.K. 14,7<br />
a 21,0.<br />
√ A-625, entre Amurrio y Llodio, P.K. 360,7 a 372,<strong>2.</strong><br />
√ A-627, entre <strong>la</strong> N-240 y el límite con Gipuzkoa, P.K. 12,8 a 18,<strong>2.</strong><br />
NIVEL DE SERVICIO EN EL TERRITORIO HISTÓRICO DE ÁLAVA<br />
0,35<br />
0,30<br />
0,25<br />
0,20<br />
0,15<br />
0,10<br />
0,05<br />
0,00<br />
25%<br />
(% KILÓMETROS DE RED OBJETO)<br />
31%<br />
28%<br />
3%<br />
13%<br />
A B C D E F<br />
Fuente: E<strong>la</strong>boración propia<br />
Por su parte, Bizkaia es el Territorio histórico con el mayor porcentaje <strong>de</strong> kilómetros <strong>de</strong> Red Objeto que<br />
presenta niveles <strong>de</strong> servicio menos confortables para el usuario, pues un 5% <strong>de</strong> <strong>la</strong> <strong>red</strong> presenta Nivel <strong>de</strong><br />
servicio F y un 38% tiene unas condiciones <strong>de</strong> circu<strong>la</strong>ción encuadradas en un Nivel <strong>de</strong> Servicio E.<br />
Los tramos y carreteras que alcanzan el nivel <strong>de</strong> servicio E se sitúan en su mayoría en el entorno<br />
metropolitano <strong>de</strong> Bilbao, y son los siguientes:<br />
√ A-8, entre los P.K. 131,0 y 132,3, al norte <strong>de</strong> Portugalete, en <strong>la</strong>s inmediaciones <strong>de</strong>l acceso al Puerto<br />
<strong>de</strong> Bilbao.<br />
√ N-240, entre los P.K. 30,5 a 36,2, en el Puerto <strong>de</strong> Barazar, y<strong>de</strong> P.K. 42,0 a 55,4, en el tramo final <strong>de</strong><br />
<strong>la</strong> carretera entre Igorre y <strong>la</strong> A-8.<br />
√ N-634, entre los P.K. 62,5 a 91,9 y <strong>de</strong>l P.K. 113,7 a 136,2; es <strong>de</strong>cir, en todo el territorio <strong>de</strong> Bizkaia con<br />
excepción <strong>de</strong>l tramo en que esta carretera se convierte en vía <strong>de</strong>sdob<strong>la</strong>da en el entorno <strong>de</strong>l Bilbao<br />
Metropolitano.<br />
√ N-636, entre los P.K. 39,7 y 51,1, entre Durango y el límite con Gipuzkoa.<br />
√ N-639, entre los P.K. 16,0 a 24,0, en el tramo entre Santurtzi y <strong>la</strong> N-634, en toda <strong>la</strong> carretera <strong>de</strong><br />
acceso al Puerto <strong>de</strong> Bilbao.<br />
0%<br />
235<br />
Revisión <strong>de</strong>l Segundo P<strong>la</strong>n General <strong>de</strong> Carreteras <strong>de</strong>l País Vasco
√ BI-604, entre los P.K. 2,3 y 7,4., en Deusto.<br />
√ BI-623, entre los P.K. 28,0 a 39,0, entre Durango y Urkio<strong>la</strong>; y <strong>de</strong> P.K. 48,0 a 49,0 entre Otxandio y el<br />
límite con Á<strong>la</strong>va.<br />
√ BI-625, entre los P.K. 381,8 y 387,4, en el tramo más próximo al Área Metropolitana <strong>de</strong> Bilbao.<br />
√ BI-631: entre los P.K. 5,2 a 9,0, entre Begoña y <strong>la</strong> N-637; y P.K. 12,2 a 18,9, entre <strong>la</strong> N-633 y <strong>la</strong>s<br />
inmediaciones <strong>de</strong> Mungia, al sur <strong>de</strong> esta localidad.<br />
√ BI-635, entre los P.K. 17,3 a 35,1, <strong>de</strong>s<strong>de</strong> <strong>la</strong> N-240 a Gernika.<br />
√ BI-638, entre los P.K. 68,0 y 69,0, entre Ondarroa y el límite con Gipuzkoa.<br />
Por su parte, alcanzan el nivel F los tramos siguientes:<br />
√ A-8, entre los P.K. 110,5 y 131,0, en el Área Metropolitana <strong>de</strong> Bilbao.<br />
√ N-637, entre los P.K. 8,5 y 12,0, también en el entorno <strong>de</strong>l Bilbao Metropolitano.<br />
NIVEL DE SERVICIO EN EL TERRITORIO HISTÓRICO DE BIZKAIA<br />
0,40<br />
0,35<br />
0,30<br />
0,25<br />
0,20<br />
0,15<br />
0,10<br />
0,05<br />
0,00<br />
10%<br />
(% KILÓMETROS DE RED OBJETO)<br />
20%<br />
19%<br />
9%<br />
38%<br />
A B C D E F<br />
Fuente: E<strong>la</strong>boración propia<br />
En el caso <strong>de</strong> Gipuzkoa, más <strong>de</strong> una tercera parte <strong>de</strong> los kilómetros <strong>de</strong> sus carreteras incluidas en <strong>la</strong> Red<br />
Objeto tienen un Nivel <strong>de</strong> Servicio E y en este caso existe, a<strong>de</strong>más <strong>de</strong> que el 23% <strong>de</strong> <strong>la</strong> <strong>red</strong> tiene nivel <strong>de</strong><br />
servicio D y un 2% <strong>de</strong> <strong>la</strong> <strong>red</strong> alcanza el nivel <strong>de</strong> servicio F, el pésimo en cuanto a percepción <strong>de</strong> <strong>la</strong>s<br />
condiciones <strong>de</strong> circu<strong>la</strong>ción.<br />
5%<br />
Nivel <strong>de</strong> servicio E tienen en Gipuzkoa <strong>la</strong>s siguientes carreteras:<br />
√ N-636, en prácticamente toda su extensión, entre Ormaiztegi y el límite con Bizkaia, P.K. 4,5 a 35,<strong>2.</strong><br />
√ N-634, en buena parte <strong>de</strong> su longitud <strong>de</strong>ntro <strong>de</strong> este Territorio Histórico, entre los P.K. 0,0 a 19,0;<br />
P.K. 22,0 a 23,0; y <strong>de</strong>l P.K. 27,0 a 62,0.<br />
√ N-I, entre los P.K. 444,7 a 447,7, entre Tolosa y Andoain; y <strong>de</strong>l P.K. 466,3 a 481,5, entre Pasaia e<br />
Irun.<br />
√ GI-631, <strong>de</strong>l P.K. 8,2 a 18,9, entre <strong>la</strong>s localida<strong>de</strong>s <strong>de</strong> Lasao y Azkoitia; y <strong>de</strong>l P.K. 26,0 a 34,5, entre <strong>la</strong>s<br />
<strong>de</strong> Aizpurutxo y Zumarraga.<br />
√ GI-638, entre los P.K. 0,0 y 7,8, en toda su longitud, entre Deba y el límite con Bizkaia.<br />
√ GI-627, entre los P.K. 27,2 y 56,3, prácticamente toda su longitud, entre Eskoriatza y <strong>la</strong> A-8.<br />
√ GI–131, en toda su longitud, entre <strong>la</strong> N-I en Andoain y Donostia-San Sebastián, P.K. 0,0 a 15,0.<br />
Por otra parte, tienen Nivel <strong>de</strong> Servicio F los siguientes tramos <strong>de</strong> carreteras:<br />
√ A-8, entre los P.K. 18,0 a 20,0 y <strong>de</strong>l P.K. 22,5 a 23,0, ambos tramos situados en el Área Metropolitana<br />
<strong>de</strong> Donostia-San Sebastián.<br />
√ N-I, entre los P.K. 447,7 y 453,7, entre Lasarte y el norte <strong>de</strong> Andoain.<br />
NIVEL DE SERVICIO EN EL TERRITORIO HISTÓRICO DE GIPUZKOA<br />
40<br />
35<br />
30<br />
25<br />
20<br />
15<br />
10<br />
5<br />
0<br />
15%<br />
(% KILÓMETROS DE RED OBJETO)<br />
11%<br />
9%<br />
23%<br />
40%<br />
A B C D E F<br />
Fuente: E<strong>la</strong>boración propia<br />
2%<br />
236<br />
Revisión <strong>de</strong>l Segundo P<strong>la</strong>n General <strong>de</strong> Carreteras <strong>de</strong>l País Vasco
Respecto al conjunto <strong>de</strong> <strong>la</strong> Comunidad Autónoma, cabe indicar que los niveles <strong>de</strong> servicio se reparten casi<br />
equitativamente entre los niveles comprendidos entre el A y el C y el D y el F. Por otro <strong>la</strong>do, tan sólo un 3%<br />
<strong>de</strong> <strong>la</strong> longitud total <strong>de</strong> <strong>la</strong> Red muestra un nivel <strong>de</strong> servicio encuadrado en <strong>la</strong>s peores condiciones <strong>de</strong> confort<br />
para el usuario, aunque <strong>de</strong>staca que más <strong>de</strong> un tercio <strong>de</strong> <strong>la</strong> <strong>red</strong> tiene un nivel <strong>de</strong> servicio E, próximo a<br />
alcanzar <strong>la</strong>s condiciones <strong>de</strong> congestión.<br />
35,0%<br />
30,0%<br />
25,0%<br />
20,0%<br />
15,0%<br />
10,0%<br />
5,0%<br />
0,0%<br />
16%<br />
NIVEL DE SERVICIO EN LA CAPV<br />
(% KILÓMETROS DE RED OBJETO)<br />
19%<br />
16%<br />
12%<br />
33%<br />
A B C D E F<br />
Fuente: E<strong>la</strong>boración propia<br />
En resumen, <strong>la</strong>s carreteras que presentan un nivel <strong>de</strong> servicio F <strong>de</strong>ntro <strong>de</strong> <strong>la</strong> <strong>red</strong> <strong>de</strong>l País vasco, son:<br />
√ La carretera N-I, en el tramo <strong>de</strong> carretera que discurre entre los puntos kilométricos 448 y 454.<br />
√ La carretera N-637, en el cor<strong>red</strong>or Rontegi <strong>de</strong> Bilbao Metropolitano, con una longitud que supone el<br />
13% <strong>de</strong>l total.<br />
√ La carretera A-8 a su paso por el Bilbao Metropolitano así como a <strong>la</strong> entrada <strong>de</strong> Donostia-San<br />
Sebastián.<br />
3%<br />
Á<strong>la</strong>va<br />
Bizkaia<br />
NIVEL DE SERVICIO, EN EL AÑO 2003, SEGÚN CARRETERA Y TERRITORIO HISTÓRICO<br />
(% KILÓMETROS DE RED OBJETO)<br />
Carretera A B C D E F<br />
AP-1 100 0 0 0 0 0<br />
AP-68 100 0 0 0 0 0<br />
N-I 6 52 37 5 0 0<br />
N-102 100 0 0 0 0 0<br />
N-104 0 0 0 15 85 0<br />
N-124 0 0 0 0 100 0<br />
N-240 10 44 11 0 34 0<br />
N-622 26 55 19 0 0 0<br />
N-624 100 0 0 0 0 0<br />
A-124 0 0 100 0 0 0<br />
A-132 0 100 0 0 0 0<br />
A-623 0 0 23 77 0 0<br />
A-624 0 13 87 0 0 0<br />
A-625 0 36 0 0 64 0<br />
A-627 0 0 0 0 100 0<br />
AP-68 70 30 0 0 0 0<br />
A-8 20 18 29 0 2 31<br />
N-240 0 0 0 41 59 0<br />
N-629 0 0 100 0 0 0<br />
N-633 54 0 46 0 0 0<br />
N-634 2 11 12 0 75 0<br />
N-636 0 0 0 0 100 0<br />
N-637 39 14 21 8 0 18<br />
N-639 0 0 0 0 100 0<br />
N-644 0 100 0 0 0 0<br />
BI-604 0 0 0 0 100 0<br />
BI-623 0 0 31 14 54 0<br />
BI-624 0 0 0 100 0 0<br />
BI-625 0 0 62 0 38 0<br />
237<br />
Revisión <strong>de</strong>l Segundo P<strong>la</strong>n General <strong>de</strong> Carreteras <strong>de</strong>l País Vasco
Gipuzkoa<br />
Carretera A B C D E F<br />
BI-630 0 100 0 0 0 0<br />
BI-631 3 41 42 0 14 0<br />
BI-633 0 0 0 47 53 0<br />
BI-635 0 0 0 0 100 0<br />
BI-636 0 58 42 0 0 0<br />
BI-637 17 11 31 40 0 0<br />
BI-638 0 0 0 0 100 0<br />
AP-1 100 0 0 0 0 0<br />
A-8 28 41 18 10 0 3<br />
A-15 100 0 0 0 0 0<br />
N-I 0 16 20 30 26 9<br />
N-121-A 0 0 0 100 0 0<br />
N-634 0 0 0 33 67 0<br />
N-636 22 0 9 23 46 0<br />
N-638 0 0 0 0 100 0<br />
GI-131 0 0 0 0 100 0<br />
GI-627 0 0 0 21 79 0<br />
GI-631 0 0 0 44 56 0<br />
GI-638 0 0 0 0 100 0<br />
Fuente: E<strong>la</strong>boración propia<br />
Es interesante completar el <strong>análisis</strong> con una revisión <strong>de</strong> los Niveles <strong>de</strong> Servicio que se alcanzan por tipo <strong>de</strong><br />
<strong>red</strong> y por Territorio Histórico. En los gráficos siguientes se muestra <strong>la</strong> distribución <strong>de</strong> porcentaje <strong>de</strong> longitud<br />
para dichos aspectos, habiéndose agregado los niveles <strong>de</strong> servicio en tres grupos: AB, que son los niveles <strong>de</strong><br />
mayor comodidad y flui<strong>de</strong>z <strong>de</strong> circu<strong>la</strong>ción; CD, como nivel intermedio, en los cuales si bien todavía <strong>la</strong><br />
circu<strong>la</strong>ción alcanza niveles <strong>de</strong> flui<strong>de</strong>z suficientes ya existen perturbaciones <strong>de</strong> velocidad y comodidad <strong>de</strong>bido<br />
al número <strong>de</strong> usuarios, con eventuales retenciones; y EF, como el resumen <strong>de</strong>l pero nivel <strong>de</strong> servicio, en que<br />
<strong>la</strong> circu<strong>la</strong>ción se aproxima o supera niveles cercanos a <strong>la</strong> congestión, con frecuentes interrupciones y pérdida<br />
<strong>de</strong> comodidad y velocidad.<br />
NIVEL DE SERVICIO EN EL TERRITORIO HISTÓRICO DE ÁLAVA<br />
70,00%<br />
60,00%<br />
50,00%<br />
40,00%<br />
30,00%<br />
20,00%<br />
10,00%<br />
0,00%<br />
69%<br />
(% KILÓMETROS POR TIPO DE RED)<br />
37%<br />
56%<br />
18%<br />
50%<br />
31%<br />
14% 13% 13%<br />
A+B C+D E+F<br />
R.I.P. R.B. R.O.P.<br />
Fuente: E<strong>la</strong>boración propia<br />
En el Territorio Histórico <strong>de</strong> Á<strong>la</strong>va, los niveles <strong>de</strong> servicio <strong>de</strong> mejores condiciones alcanzan un 56% <strong>de</strong>l total<br />
<strong>de</strong> longitud <strong>de</strong> <strong>la</strong>s carreteras, un 31% el nivel <strong>de</strong>finido como intermedio y un 13%, el menor <strong>de</strong> los tres<br />
Territorios, el nivel más <strong>de</strong>ficiente. Por tipo <strong>de</strong> Red, <strong>de</strong>staca que el 69% <strong>de</strong> <strong>la</strong> Red <strong>de</strong> Interés Preferente<br />
alcanza niveles A o B, mientras que en <strong>la</strong> Red Básica el mayor porcentaje se sitúa en el nivel intermedio. En<br />
ambos casos, el nivel más <strong>de</strong>ficiente obtiene <strong>la</strong>s menores cuotas, con un 14% en <strong>la</strong> Red <strong>de</strong> Interés<br />
Preferente y un 13% en <strong>la</strong> Red Básica.<br />
238<br />
Revisión <strong>de</strong>l Segundo P<strong>la</strong>n General <strong>de</strong> Carreteras <strong>de</strong>l País Vasco
NIVEL DE SERVICIO EN EL TERRITORIO HISTÓRICO DE BIZKAIA<br />
60,00%<br />
50,00%<br />
40,00%<br />
30,00%<br />
20,00%<br />
10,00%<br />
0,00%<br />
29%<br />
(% KILÓMETROS POR TIPO DE RED)<br />
31% 30%<br />
21%<br />
28% 24%<br />
50%<br />
41%<br />
A+B C+D E+F<br />
R.I.P. R.B. R.O.P.<br />
Fuente: E<strong>la</strong>boración propia<br />
Bizkaia tiene <strong>la</strong> mayor parte <strong>de</strong> su longitud <strong>de</strong> carreteras con niveles <strong>de</strong> servicio <strong>de</strong>ntro <strong>de</strong>l grupo más<br />
<strong>de</strong>ficiente, tanto en <strong>la</strong> Red <strong>de</strong> Interés Preferente (50%), como en <strong>la</strong> Red Básica (41%) y en el conjunto <strong>de</strong> <strong>la</strong><br />
Red Objeto (47%). Esto es <strong>de</strong>bido a <strong>la</strong>s altas intensida<strong>de</strong>s <strong>de</strong> tráfico que registra el Territorio Histórico,<br />
fundamentalmente en el Bilbao Metropolitano, el cual, por su parte, concentra <strong>la</strong> mayor <strong>de</strong>nsidad <strong>de</strong><br />
carreteras <strong>de</strong> toda Bizkaia.<br />
Es también interesante seña<strong>la</strong>r que el mejor nivel <strong>de</strong> servicio alcanza porcentajes cercanos al 30% en <strong>la</strong>s<br />
tres divisiones p<strong>la</strong>nteadas, mientras que el nivel intermedio se sitúa en el 24% para el conjunto <strong>de</strong> <strong>la</strong> Red<br />
Objeto, el 21% para <strong>la</strong> Red <strong>de</strong> Interés Preferente, y el 28% para <strong>la</strong> Red Básica.<br />
47%<br />
NIVEL DE SERVICIO EN EL TERRITORIO HISTÓRICO DE GIPUZKOA<br />
80,00%<br />
70,00%<br />
60,00%<br />
50,00%<br />
40,00%<br />
30,00%<br />
20,00%<br />
10,00%<br />
0,00%<br />
36%<br />
(% KILÓMETROS POR TIPO DE RED)<br />
0%<br />
27%<br />
34%<br />
24%<br />
31%<br />
30%<br />
76%<br />
A+B C+D E+F<br />
R.I.P. R.B. R.O.P.<br />
Fuente: E<strong>la</strong>boración propia<br />
Gipuzkoa presenta porcentajes muy semejantes en los tres niveles agregados. El nivel <strong>de</strong> mayor flui<strong>de</strong>z<br />
alcanza un 27%, un 31% el nivel intermedio y un 42%, el mayor porcentaje el nivel más <strong>de</strong>ficiente.<br />
Por otro <strong>la</strong>do, mientras que en <strong>la</strong> Red <strong>de</strong> Interés Preferente <strong>de</strong> este Territorio Histórico se mantiene <strong>la</strong><br />
homogeneidad entre niveles (36%, 34% y 30% en los tres grupos), en <strong>la</strong> Red Básica <strong>de</strong>staca el elevado<br />
porcentaje <strong>de</strong> kilómetros con niveles E o F (76%), mientras que el 24% restante es nivel intermedio, y no<br />
cuenta con porcentaje alguno en los niveles A y B. Esto es <strong>de</strong>bido a <strong>la</strong> alta IMD tanto total como <strong>de</strong> pesados<br />
con que cuentan <strong>la</strong>s carreteras <strong>de</strong> <strong>la</strong> Red Básica en Gipuzkoa (todas el<strong>la</strong>s superan los 5.000 vehículos <strong>de</strong><br />
IMD pon<strong>de</strong>rada, con <strong>la</strong> GI-131 y <strong>la</strong> GI-627 superando los 10.000), a lo que hay que unir <strong>la</strong>s condiciones<br />
orográficas y <strong>la</strong>s dificulta<strong>de</strong>s <strong>de</strong> a<strong>de</strong><strong>la</strong>ntamiento.<br />
42%<br />
239<br />
Revisión <strong>de</strong>l Segundo P<strong>la</strong>n General <strong>de</strong> Carreteras <strong>de</strong>l País Vasco
45,00%<br />
40,00%<br />
35,00%<br />
30,00%<br />
25,00%<br />
20,00%<br />
15,00%<br />
10,00%<br />
5,00%<br />
0,00%<br />
43%<br />
NIVEL DE SERVICIO EN LA CAPV<br />
(% KILÓMETROS POR TIPO DE RED)<br />
26%<br />
37%<br />
25%<br />
34%<br />
28%<br />
32%<br />
40%<br />
A+B C+D E+F<br />
R.I.P. R.B. R.O.P.<br />
Fuente: E<strong>la</strong>boración propia<br />
Finalmente, en el conjunto <strong>de</strong> <strong>la</strong> Comunidad Autónoma, el porcentaje mayor lo obtienen los niveles <strong>de</strong><br />
servicio A y B, con un 37% <strong>de</strong>l total. Los niveles más <strong>de</strong>ficientes alcanzan un 35%, mientras que el nivel<br />
intermedio se sitúa en el 28%.<br />
Por tipo <strong>de</strong> Red, <strong>la</strong> <strong>de</strong> Interés Preferente tiene un 43% <strong>de</strong> su longitud con buenos niveles <strong>de</strong> servicio, un<br />
32% con niveles <strong>de</strong>ficientes y un 25% con niveles intermedios.<br />
Por su parte, <strong>la</strong> Red Básica presenta en un 40% <strong>de</strong> su longitud niveles <strong>de</strong> servicio E y F, un 34% con niveles<br />
intermedios y un 26% con niveles A y B.<br />
35%<br />
240<br />
Revisión <strong>de</strong>l Segundo P<strong>la</strong>n General <strong>de</strong> Carreteras <strong>de</strong>l País Vasco
<strong>2.</strong><strong>2.</strong>3.3. Resto <strong>de</strong> <strong>la</strong> Red Funcional<br />
Se ha llevado a cabo el <strong>análisis</strong> <strong>de</strong> los niveles <strong>de</strong> servicio <strong>de</strong>l resto <strong>de</strong> <strong>la</strong> Red Funcional <strong>de</strong> los Territorios Históricos<br />
<strong>de</strong> Gipuzkoa y Á<strong>la</strong>va. No ha sido posible realizarlo en el Territorio Histórico <strong>de</strong> Bizkaia por carecer <strong>de</strong> tramificación<br />
<strong>de</strong> <strong>la</strong>s estaciones <strong>de</strong> aforo.<br />
Los niveles <strong>de</strong> servicio <strong>de</strong>l resto <strong>de</strong> carreteras <strong>de</strong> <strong>la</strong> Red Funcional <strong>de</strong> Á<strong>la</strong>va y Gipuzkoa son los siguientes:<br />
Á<strong>la</strong>va<br />
Gipuzkoa<br />
NIVEL DE SERVICIO, EN EL AÑO 2003, SEGÚN CARRETERA Y TERRITORIO HISTÓRICO<br />
(% KILÓMETROS DE RESTO DE RED FUNCIONAL)<br />
Carretera A B C D E F<br />
A-126 100 0 0 0 0 0<br />
A-2122 30 70 0 0 0 0<br />
A-2124 34 66 0 0 0 0<br />
A-2126 86 0 14 0 0 0<br />
A-2128 100 0 0 0 0 0<br />
A-2130 0 100 0 0 0 0<br />
A-2134 0 100 0 0 0 0<br />
A-2521 44 56 0 0 0 0<br />
A-2522 43 0 57 0 0 0<br />
A-2604 100 0 0 0 0 0<br />
A-2620 82 18 0 0 0 0<br />
A-2622 53 47 0 0 0 0<br />
A-2625 95 5 0 0 0 0<br />
GI-2135 0 79 21 0 0 0<br />
GI-2120 73 14 0 13 0 0<br />
GI-2130 0 50 0 50 0 0<br />
GI-2132 0 0 51 31 17 0<br />
GI-2620 0 33 32 35 0 0<br />
GI-2630 72 0 28 0 0 0<br />
GI-2633 0 100 0 0 0 0<br />
GI-2634 46 25 30 0 0 0<br />
GI-2636 100 0 0 0 0 0<br />
Fuente: E<strong>la</strong>boración propia<br />
En Á<strong>la</strong>va, <strong>de</strong>bido fundamentalmente al bajo volumen <strong>de</strong> IMD <strong>de</strong> <strong>la</strong> A-126 y <strong>la</strong>s carreteras <strong>de</strong> <strong>la</strong> Red Comarcal, en<br />
<strong>la</strong>s que en ningún caso se superan los 5.000 vehículos día, los niveles <strong>de</strong> servicio se sitúan entre A y C, <strong>de</strong> lo que<br />
se <strong>de</strong>riva <strong>la</strong> no existencia <strong>de</strong> problemas en estas carreteras en lo referente a <strong>la</strong> capacidad. Cabe <strong>de</strong>stacar <strong>la</strong>s dos<br />
únicas carreteras que cuentan con tramos <strong>de</strong> nivel C en el Territorio Histórico <strong>de</strong> Á<strong>la</strong>va, que son <strong>la</strong> A-2126,<br />
Logroño – Bernedo, en <strong>la</strong>s inmediaciones <strong>de</strong>l Límite Provincial <strong>de</strong> La Rioja, y <strong>la</strong> A-2522, Ziorraga – Límite <strong>de</strong><br />
Bizkaia, en <strong>la</strong>s inmediaciones <strong>de</strong> Llodio.<br />
% longitud<br />
100<br />
90<br />
80<br />
70<br />
60<br />
50<br />
40<br />
30<br />
20<br />
10<br />
0<br />
NIVEL DE SERVICIO EN ÁLAVA<br />
(% KILÓMETROS RESTO DE LA RED FUNCIONAL)<br />
A B C D E F<br />
NS<br />
A-126 A-2122 A-2124 A-2126 A-2128 A-2130 A-2134 A-2521 A-2522 A-2604 A-2620 A-2622 A-2625<br />
Fuente: E<strong>la</strong>boración propia<br />
En Gipuzkoa, sin embargo, <strong>la</strong> <strong>situación</strong> es diferente, ya que <strong>la</strong>s carreteras <strong>de</strong> su Red Comarcal son vías mucho<br />
más transitadas que <strong>la</strong>s a<strong>la</strong>vesas, siendo peores también <strong>la</strong>s condiciones orográficas y <strong>la</strong>s posibilida<strong>de</strong>s <strong>de</strong><br />
a<strong>de</strong><strong>la</strong>ntamiento. De hecho, llegan a superarse los 20.000 vehículos día en algunas <strong>de</strong> estas vías, como en <strong>la</strong> GI-<br />
2131, siendo más frecuentes en toda <strong>la</strong> <strong>red</strong> los niveles D, e incluso E, si bien no llega a alcanzarse el nivel F.<br />
242<br />
Revisión <strong>de</strong>l Segundo P<strong>la</strong>n General <strong>de</strong> Carreteras <strong>de</strong>l País Vasco
Las carreteras que cuentan con un nivel <strong>de</strong> servicio más cercano a situaciones problemáticas en torno a <strong>la</strong><br />
capacidad son <strong>la</strong> mencionada GI-2132, que cuenta con un 17% <strong>de</strong> su longitud con nivel E, especialmente en sus<br />
tramos inicial (entre Ga<strong>la</strong>rreta y Errekal<strong>de</strong>) y final (Lartzabal – Mamut), así como un 31% con nivel D; <strong>la</strong> GI-2120<br />
(antigua GI-120), que cuenta con un 13% <strong>de</strong> su longitud con nivel D, que se produce en <strong>la</strong>s inmediaciones <strong>de</strong> <strong>la</strong><br />
localidad <strong>de</strong> Lazkao; <strong>la</strong> GI-2130, con un 50% <strong>de</strong> su longitud con nivel D, al comienzo <strong>de</strong> <strong>la</strong> carretera en <strong>la</strong>s<br />
inmediaciones <strong>de</strong> Ibarra; y <strong>la</strong> GI-2620, con un 35% <strong>de</strong> longitud con nivel D, que se produce en <strong>la</strong>s inmediaciones<br />
<strong>de</strong> Arrasate – Mondragón.<br />
% longitud<br />
100<br />
90<br />
80<br />
70<br />
60<br />
50<br />
40<br />
30<br />
20<br />
10<br />
0<br />
NIVEL DE SERVICIO EN GIPUZKOA<br />
(% KILÓMETROS RESTO DE LA RED FUNCIONAL)<br />
A B C D E F<br />
NS<br />
GI-2135 GI-2120 GI-2130 GI-2132 GI-2620 GI-2630 GI-2633 GI-2634 GI-2636<br />
Fuente: E<strong>la</strong>boración propia<br />
243<br />
Revisión <strong>de</strong>l Segundo P<strong>la</strong>n General <strong>de</strong> Carreteras <strong>de</strong>l País Vasco
<strong>2.</strong>3. CARACTERIZACIÓN DE LA MOVILIDAD EN EL PAÍS VASCO<br />
El <strong>análisis</strong> <strong>de</strong> <strong>la</strong> <strong>de</strong>manda <strong>de</strong> transporte que se presenta a continuación tiene como fuentes documentales los<br />
estudios re<strong>la</strong>tivos a “Imagen Final <strong>de</strong> <strong>la</strong> Demanda <strong>de</strong> Transporte en el País Vasco” correspondientes a los años<br />
1995 y 2001 (y su <strong>actual</strong>ización a 2002 y 2003), en los que se investigan exclusivamente los viajes que superan el<br />
ámbito comarcal. Es necesario resaltar, que los resultados <strong>de</strong>l año 1995 se refieren al día medio <strong>la</strong>borable<br />
(entendido como el valor medio <strong>de</strong> los días <strong>la</strong>borables <strong>de</strong>l año), mientras que en el año 2001 (y <strong>actual</strong>izaciones<br />
posteriores) se ha empleado como referencia el día medio anual (media <strong>de</strong> todos los días <strong>de</strong>l año). Por esta razón,<br />
<strong>la</strong>s comparaciones entre ambos estudios <strong>de</strong>ben realizarse con precaución.<br />
Estos estudios se basan tanto en información facilitada directamente por los operadores <strong>de</strong> transporte <strong>de</strong> viajeros<br />
y mercancías (en lo re<strong>la</strong>tivo al modo ferroviario, al aéreo y al autobús) como en los resultados <strong>de</strong> <strong>la</strong>s encuestas<br />
realizadas por <strong>la</strong> Dirección <strong>de</strong> Infraestructuras <strong>de</strong>l Transporte y Obras Públicas <strong>de</strong>l Gobierno Vasco durante los<br />
meses <strong>de</strong> octubre y noviembre <strong>de</strong> 1995 y 2002, a vehículos <strong>de</strong> transporte <strong>de</strong> viajeros y mercancías con objeto <strong>de</strong><br />
medir <strong>la</strong> <strong>de</strong>manda <strong>de</strong>l transporte por carretera.<br />
En el año 2002 <strong>la</strong> muestra válida <strong>de</strong> vehículos y turismos ha sido <strong>de</strong> 2<strong>2.</strong>322, mientras que en el año 1995 fue <strong>de</strong><br />
36.289, es <strong>de</strong>cir, en el nuevo estudio <strong>la</strong> muestra es <strong>de</strong> 13.967 encuestas válidas menos.<br />
Los puntos <strong>de</strong> aforo consi<strong>de</strong>rados en los años 1995 y 2002 son 52 y 57 respectivamente, distribuidos a lo <strong>la</strong>rgo <strong>de</strong><br />
<strong>la</strong>s carreteras N-I, N-121-A, N-124, N-240, N-622, N-634, N-637 y <strong>de</strong> <strong>la</strong>s autopistas AP-68, A-8 y A-15 <strong>de</strong> <strong>la</strong> Red<br />
<strong>de</strong> Interés Preferente. En <strong>la</strong> Red Básica <strong>la</strong>s carreteras don<strong>de</strong> se han ubicado estos puntos <strong>de</strong> aforo son: <strong>la</strong> A-124 y<br />
A-132 en Á<strong>la</strong>va, BI-625, BI-631, BI-632, BI-633, BI-634 y BI-636 en Bizkaia y GI-627 y GI-632 en Gipuzkoa. Y,<br />
finalmente en <strong>la</strong> Red Comarcal, se han tomado carreteras <strong>de</strong> Á<strong>la</strong>va (A-2124 y A-2128) y <strong>de</strong> Bizkaia (BI-2701 y BI-<br />
2120).<br />
<strong>2.</strong>3.1 Movilidad global<br />
<strong>2.</strong>3.1.1. Transporte <strong>de</strong> viajeros<br />
En el día medio <strong>de</strong>l año 2003, se realizaron un total <strong>de</strong> 764.481 viajes en el País Vasco (un 2,6% más que en el<br />
año anterior), <strong>de</strong> los que el 70,7% eran interiores a <strong>la</strong> Comunidad Autónoma, el 27,8% tenían como origen y / o<br />
<strong>de</strong>stino el País Vasco (viajes tanto nacionales como internacionales) y el 1,5% restante correspondía a viajes <strong>de</strong><br />
tránsito. Si se compara con el año 2001, en el que se realizaron 735.770 viajes / día medio, se observa que el<br />
crecimiento medio acumu<strong>la</strong>tivo anual ha sido <strong>de</strong> un 2,2% ligeramente inferior al registrado en el período 1995 –<br />
2001 que fue <strong>de</strong> un 2,6%.<br />
MOVILIDAD GLOBAL SEGÚN TIPOLOGÍA DE VIAJE<br />
27,8%<br />
AÑO 2003<br />
1,5%<br />
Viajes Internos Viajes Originados Viajes <strong>de</strong> Tránsito<br />
Fuente: E<strong>la</strong>boración propia<br />
70,7%<br />
244<br />
Revisión <strong>de</strong>l Segundo P<strong>la</strong>n General <strong>de</strong> Carreteras <strong>de</strong>l País Vasco
MOVILIDAD SEGÚN TIPOLOGÍA DE VIAJE<br />
Naturaleza <strong>de</strong>l Viajes / día <strong>la</strong>borable medio (año 1995) Viajes / día medio (año 2001) Viajes / día medio (año 2002) Viajes / día medio (año 2003)<br />
viaje<br />
V. Ligero Autobús Avión Ferrocarril Total V. Ligero Autobús Avión Ferrocarril Total V. Ligero Autobús Avión Ferrocarril Total V. Ligero Autobús Avión Ferrocarril Total<br />
Viajes Internos 246.917 169.672 48.867 465.456 289.296 181.299 64.580 535.175 294.678 181.299 59.531 535.509 301.362 178.195 60.919 540.476<br />
Viajes Originados 12<strong>2.</strong>788 18.283 5.364 4.829 151.264 164.924 11.192 7.865 4.395 188.376 175.539 11.192 7.698 4.279 198.708 187.675 11.908 8.813 4.048 21<strong>2.</strong>444<br />
Viajes <strong>de</strong> Tránsito 7.329 413 1.595 9.337 10.173 46 10.219 10.810 35 10.845 11.538 23 11.561<br />
Total viajes 377.034 188.368 5.364 55.291 626.057 464.393 194.491 7.911 68.975 735.770 481.027 19<strong>2.</strong>491 7.733 63.810 745.062 500.575 190.103 8.836 64.967 764.481<br />
Naturaleza <strong>de</strong>l<br />
viaje<br />
Fuente: E<strong>la</strong>boración propia a partir <strong>de</strong> <strong>la</strong> Imagen Final <strong>de</strong> <strong>la</strong> Demanda 1995, 2001 y <strong>actual</strong>ización 2002 y 2003.<br />
CUOTA DE REPARTO MODAL SEGÚN TIPOLOGÍA DE VIAJE<br />
% (año 1995) % (año 2001) % (año 2002) % (año 2003)<br />
V. Ligero Autobús Avión Ferrocarril Total V. Ligero Autobús Avión Ferrocarril Total V. Ligero Autobús Avión Ferrocarril Total V. Ligero Autobús Avión Ferrocarril Total<br />
Viajes Internos 53,1 36,5 10,5 100,0 54,1 33,9 12,1 100,0 55,0 33,9 11,1 100,0 55,8 33,0 11,3 100,0<br />
Viajes Originados 81,2 12,1 3,6 3,2 100,0 87,6 5,9 4,2 2,3 100,0 88,3 5,6 3,9 2,2 100,0 88,3 5,6 4,1 1,9 100,0<br />
Viajes <strong>de</strong> Tránsito 78,5 4,4 17,1 100,0 99,5 0,5 100,0 99,7 0,3 100,0 99,8 0,2 100,0<br />
Total viajes 60,2 30,1 0,9 8,8 100,0 63,1 26,4 1,1 9,4 100,0 64,6 25,8 1,0 8,6 100,0 65,5 24,9 1,1 8,5 100,0<br />
Fuente: E<strong>la</strong>boración propia a partir <strong>de</strong> <strong>la</strong> Imagen Final <strong>de</strong> <strong>la</strong> Demanda 1995, 2001 y <strong>actual</strong>ización 2002 y 2003.<br />
245<br />
Revisión <strong>de</strong>l Segundo P<strong>la</strong>n General <strong>de</strong> Carreteras <strong>de</strong>l País Vasco
La cuota <strong>de</strong> reparto modal correspondiente al período 1995 – 2003 figura en el gráfico a continuación; como se ha<br />
indicado anteriormente, estos datos no tienen en consi<strong>de</strong>ración los viajes intracomarcales en el País Vasco.<br />
%<br />
70,0<br />
60,0<br />
50,0<br />
40,0<br />
30,0<br />
20,0<br />
10,0<br />
0,0<br />
REPARTO MODAL GLOBAL<br />
Año 1995 Año 2001 Año 2002 Año 2003<br />
V. Ligero Autobús Avión Ferrocarril<br />
Fuente: E<strong>la</strong>boración propia<br />
El transporte por carretera en el año 2003 presenta una cuota <strong>de</strong> mercado <strong>de</strong>l 90,4% frente a un 8,5%<br />
correspondiente al transporte ferroviario y a un 1,1% <strong>de</strong>l transporte aéreo. El 65,5% <strong>de</strong>l total <strong>de</strong> viajes se realiza<br />
en vehículo privado frente al 25% <strong>de</strong>l autobús.<br />
Respecto a <strong>la</strong> cuota <strong>de</strong> mercado, <strong>de</strong>s<strong>de</strong> 1995 <strong>la</strong> carretera se ha mantenido prácticamente estable, pues en 1995<br />
este modo canalizaba el 90,3% <strong>de</strong> los viajes (un 60,2% en vehículo ligero y un 30,1% en autobús).<br />
La <strong>de</strong>manda <strong>de</strong> transporte por carretera ha crecido un 22,2% <strong>de</strong>s<strong>de</strong> 1995, lo que equivale a un 2,5% <strong>de</strong><br />
crecimiento medio anual. En este mismo período, <strong>la</strong> movilidad en vehículo privado ha crecido un 32,8%, a un<br />
ritmo <strong>de</strong>l 3,6% anual, aunque este crecimiento no es homogéneo, ya que mientras los viajes internos crecen al<br />
2,5%, los originados y los tránsitos superan el 5% anual. Por el contrario, entre 1995 y 2003 el transporte público<br />
por carretera se ha mantenido prácticamente estable, creciendo a un ritmo <strong>de</strong>l 0,1% anual. Este crecimiento es<br />
muy inferior al experimentado por el vehículo privado, siendo evi<strong>de</strong>nte, por tanto, que el vehículo privado ha<br />
ganado peso frente al autobús <strong>de</strong>s<strong>de</strong> el año 1995.<br />
El tráfico aéreo <strong>de</strong> viajeros ha crecido un 64,7% <strong>de</strong>s<strong>de</strong> 1995, a un ritmo <strong>de</strong>l 6,4% anual. Mientras el tráfico<br />
doméstico ha crecido prácticamente un 50%, a un ritmo <strong>de</strong>l 5,1% anual, el tráfico internacional ha experimentado<br />
en el período 1995 – 2003 un incremento <strong>de</strong>l 125,6%, equivalente a una tasa <strong>de</strong> crecimiento medio anual <strong>de</strong>l<br />
10,7%.<br />
La <strong>de</strong>manda <strong>de</strong> viajeros por ferrocarril ha aumentado en un 17,5% en el período 1995 - 2003, lo que equivale a<br />
una tasa anual <strong>de</strong> crecimiento <strong>de</strong>l 2,0%. Este incremento es imputable únicamente a los viajes interiores al País<br />
Vasco, ya que los exteriores han bajado ligeramente en dicho período. Cabe concluir, pues, que el ferrocarril ha<br />
ganado cuota <strong>de</strong> mercado frente al autobús en los viajes interiores y <strong>la</strong> ha perdido frente al avión en los<br />
exteriores.<br />
Si se analiza <strong>la</strong> evolución <strong>de</strong> <strong>la</strong> movilidad global entre 2001 y 2003 cabe extraer <strong>la</strong>s siguientes conclusiones:<br />
√ El transporte <strong>de</strong> viajeros se ha incrementado un 4,2% en el período 2001 - 2003, a un ritmo anual <strong>de</strong>l<br />
2,1%, ligeramente inferior al 2,7% registrado en el periodo 1995 - 2001.<br />
La movilidad interior ha crecido, no obstante, a un ritmo muy inferior que <strong>la</strong> exterior; mientras <strong>la</strong> primera lo<br />
ha hecho a un ritmo medio <strong>de</strong>l 0,5% anual los viajes exteriores lo han hecho al 6,2% y los tránsitos al<br />
6,4%.<br />
√ El transporte <strong>de</strong> viajeros por carretera ha crecido un 5% en el período 2001 - 2003, equivalente a una tasa<br />
<strong>de</strong> crecimiento medio anual <strong>de</strong>l 2,5%.<br />
La movilidad en vehículo ligero se ha incrementado a un ritmo <strong>de</strong>l 3,8% anual <strong>de</strong>s<strong>de</strong> 2001, tasa superior a<br />
<strong>la</strong> registrada en el período 1995 – 2001. Este hecho se <strong>de</strong>be, principalmente, al incremento <strong>de</strong> los viajes<br />
exteriores durante los últimos años.<br />
La <strong>de</strong>manda intercomarcal <strong>de</strong> transporte público por carretera ha permanecido sensiblemente estancada<br />
<strong>de</strong>s<strong>de</strong> 2001. Ha <strong>de</strong>crecido a un ritmo medio <strong>de</strong>l 0,6% anual perdiendo, por tanto, peso con respecto al<br />
vehículo privado en el conjunto <strong>de</strong>l transporte <strong>de</strong> viajeros por carretera.<br />
√ El tráfico aéreo ha crecido a un ritmo <strong>de</strong>l 5,7% anual, tras remontar en 2003 <strong>la</strong> caída registrada en el año<br />
anterior (consecuencia <strong>de</strong>l impacto que en el tráfico aéreo produjo el atentado <strong>de</strong>l 11-S), recuperando así <strong>la</strong><br />
ten<strong>de</strong>ncia c<strong>la</strong>ramente alcista observada entre 1995 y 2001.<br />
√ La evolución <strong>de</strong> <strong>la</strong> <strong>de</strong>manda <strong>de</strong> viajeros ferroviarios presenta una ten<strong>de</strong>ncia <strong>de</strong>creciente en este período,<br />
observándose un <strong>de</strong>scenso medio anual <strong>de</strong>l 3%. Mientras en el período 1995 – 2001 esta ten<strong>de</strong>ncia<br />
<strong>de</strong>creciente se observaba únicamente en los viajes exteriores a <strong>la</strong> CAPV, entre 2001 y 2003 el <strong>de</strong>scenso afecta<br />
también a los viajes interiores.<br />
En re<strong>la</strong>ción con los viajes internos a <strong>la</strong> CAPV, el vehículo privado pier<strong>de</strong> cuota a favor <strong>de</strong>l autobús y el ferrocarril,<br />
si se compara con <strong>la</strong> cuota global <strong>de</strong> mercado. Concretamente, en el año 2003 el 55,8% <strong>de</strong> los viajes internos se<br />
realizan en vehículo privado, frente al 33% <strong>de</strong>l autobús y al 11,3% <strong>de</strong>l ferrocarril.<br />
246<br />
Revisión <strong>de</strong>l Segundo P<strong>la</strong>n General <strong>de</strong> Carreteras <strong>de</strong>l País Vasco
%<br />
60,0<br />
50,0<br />
40,0<br />
30,0<br />
20,0<br />
10,0<br />
0,0<br />
REPARTO MODAL DE LOS VIAJES INTERNOS<br />
Año 1995 Año 2001 Año 2002 Año 2003<br />
V. Ligero Autobús Ferrocarril<br />
Fuente: E<strong>la</strong>boración propia<br />
Comparando esta <strong>situación</strong> con <strong>la</strong> correspondiente al año 1995 cabe indicar que el vehículo privado ha<br />
incrementado su cutota en 2,7 puntos (53,1% en 1995 frente al 55,8% <strong>de</strong>l año 2003), el ferrocarril lo ha hecho<br />
en 0,8 puntos (10,5% en 1995 frente a 11,3% en el año 2003) mientras que el autobús <strong>la</strong> ha disminuido en un<br />
3,5% (en 1995 representaba el 36,5% <strong>de</strong> los viajes internos cifra que en el año 2003 cae hasta un 33,0%).<br />
Los viajes con origen y / o <strong>de</strong>stino en el País Vasco se realizan mayoritariamente en vehículo privado (un 88,3%<br />
<strong>de</strong>l total en el año 2003), seguido a gran distancia por el autobús (un 5,6%), el avión (un 4,1%) y el ferrocarril<br />
(un 2,0%).<br />
%<br />
90,0<br />
80,0<br />
70,0<br />
60,0<br />
50,0<br />
40,0<br />
30,0<br />
20,0<br />
10,0<br />
0,0<br />
REPARTO MODAL DE LOS VIAJES EXTERIORES<br />
Año 1995 Año 2001 Año 2002 Año 2003<br />
V. Ligero Autobús Avión Ferrocarril<br />
Fuente: E<strong>la</strong>boración propia<br />
En el período 1995 – 2003, el vehículo privado ha incrementado notablemente su cuota <strong>de</strong> participación en este<br />
segmento <strong>de</strong> <strong>la</strong> movilidad, un 7% en el período. Por el contrario, el autobús ha visto disminuir su cuota en un<br />
54% (ha pasado <strong>de</strong> transportar un 12% en 1995, al 5,6% <strong>de</strong> 2003). El ferrocarril ha experimentado un <strong>de</strong>scenso<br />
<strong>de</strong> 1,2 puntos en el período, mientras que el avión pue<strong>de</strong> <strong>de</strong>cirse que se ha mantenido prácticamente estable (ha<br />
incrementado su cuota en 0,6 puntos entre 1995 y 2003).<br />
En re<strong>la</strong>ción con los viajes <strong>de</strong> tránsito, en el año 2003 no existe información re<strong>la</strong>tiva al modo ferroviario ni al<br />
autobús, por lo que <strong>la</strong> cuota <strong>de</strong> mercado <strong>de</strong>l vehículo privado (que acapara prácticamente <strong>la</strong> totalidad <strong>de</strong> los<br />
viajes), un 99,8% <strong>de</strong> los viajes <strong>de</strong> tránsito, <strong>de</strong>be consi<strong>de</strong>rarse con reservas. En 1995, el vehículo privado<br />
canalizaba el 78,5% <strong>de</strong> los viajes, frente a un 17,1% <strong>de</strong>l ferrocarril y un 4,4% <strong>de</strong>l autobús.<br />
Como conclusiones finales <strong>de</strong>l <strong>análisis</strong> <strong>de</strong> <strong>la</strong> <strong>de</strong>manda <strong>de</strong> transporte <strong>de</strong> viajeros en <strong>la</strong> CAPV en el período 1995 -<br />
2003, cabe extraer <strong>la</strong>s siguientes:<br />
√ El progresivo avance <strong>de</strong>l vehículo ligero en todos los tipos <strong>de</strong> viaje.<br />
√ El estancamiento <strong>de</strong>l autobús.<br />
√ La caída generalizada <strong>de</strong>l ferrocarril.<br />
√ El relevante crecimiento <strong>de</strong> los viajes exteriores, asumido por el vehículo ligero, el autobús y el avión.<br />
247<br />
Revisión <strong>de</strong>l Segundo P<strong>la</strong>n General <strong>de</strong> Carreteras <strong>de</strong>l País Vasco
<strong>2.</strong>3.1.<strong>2.</strong> Transporte <strong>de</strong> mercancías<br />
En el día medio <strong>de</strong>l año 2003, se transportaron un total <strong>de</strong> 585.718 tone<strong>la</strong>das en el País Vasco (un 5,8% más que<br />
en el año anterior), <strong>de</strong> <strong>la</strong>s que el 25,2% correspon<strong>de</strong> a transporte interior a <strong>la</strong> Comunidad Autónoma, el 60,3%<br />
tenían como origen y / o <strong>de</strong>stino el País Vasco (transporte tanto nacional como internacional) y el 14,5% restante<br />
correspondía a mercancías en tránsito. Si se compara con el año 2001, en el que se transportaron 526.595<br />
tone<strong>la</strong>das / día medio, se observa que el crecimiento medio acumu<strong>la</strong>tivo anual ha sido <strong>de</strong> un 5,2% <strong>de</strong>l mismo<br />
or<strong>de</strong>n al registrado en el período 1995 – 2001.<br />
MOVILIDAD GLOBAL SEGÚN TIPOLOGÍA DE VIAJE<br />
14,5%<br />
60,3%<br />
AÑO 2003<br />
25,2%<br />
Viajes Internos Viajes Originados Viajes <strong>de</strong> Tránsito<br />
Fuente: E<strong>la</strong>boración propia<br />
248<br />
Revisión <strong>de</strong>l Segundo P<strong>la</strong>n General <strong>de</strong> Carreteras <strong>de</strong>l País Vasco
MOVILIDAD SEGÚN TIPOLOGÍA DE VIAJE<br />
Naturaleza <strong>de</strong>l<br />
Tn / día <strong>la</strong>borable medio (año 1995) Tn / día medio (año 2001) Tn / día medio (año 2002) Tn / día medio (año 2003)<br />
viaje<br />
Carretera Ferrocarril Aéreo Marítimo Total Carretera Ferrocarril Aéreo Marítimo Total Carretera Ferrocarril Aéreo Marítimo Total Carretera Ferrocarril Aéreo Marítimo Total<br />
Viajes Internos 104.028 <strong>2.</strong>515 0 551 107.094 140.979 1.349 0 0 14<strong>2.</strong>328 143.145 1.648 0 0 144.793 146.111 1.299 0 0 147.410<br />
Viajes Originados 137.443 9.882 47 79.802 227.174 213.458 10.964 110 86.967 311.499 231.036 11.799 128 85.783 328.746 246.100 11.805 121 95.076 353.102<br />
Viajes <strong>de</strong> Tránsito 44.887 1.600 0 0 46.487 70.236 <strong>2.</strong>532 0 0 7<strong>2.</strong>768 75.933 4.081 0 0 80.014 80.780 4.426 0 0 85.206<br />
Total 286.358 13.997 47 80.353 380.755 424.673 14.845 110 86.967 526.595 450.114 17.528 128 85.783 553.553 47<strong>2.</strong>991 17.530 121 95.076 585.718<br />
Naturaleza <strong>de</strong>l<br />
viaje<br />
Fuente: E<strong>la</strong>boración propia a partir <strong>de</strong> <strong>la</strong> Imagen Final <strong>de</strong> <strong>la</strong> Demanda 1995, 2001 y <strong>actual</strong>ización 2002 y 2003.<br />
CUOTA DE REPARTO MODAL SEGÚN TIPOLOGÍA DE VIAJE<br />
% (año 1995) % (año 2001) % (año 2002) % (año 2003)<br />
Carretera Ferrocarril Aéreo Marítimo Total Carretera Ferrocarril Aéreo Marítimo Total Carretera Ferrocarril Aéreo Marítimo Total Carretera Ferrocarril Aéreo Marítimo Total<br />
Viajes Internos 97,1 2,4 0,0 0,5 100,0 99,1 0,9 0,0 0,0 100,0 98,9 1,1 0,0 0,0 100,0 99,1 0,9 0,0 0,0 100,0<br />
Viajes Originados 60,5 4,4 0,0 35,1 100,0 68,4 3,5 0,1 27,9 100,0 70,3 3,6 0,0 26,1 100,0 69,7 3,3 0,0 26,9 100,0<br />
Viajes <strong>de</strong> Tránsito 96,6 3,4 0,0 0,0 100,0 96,5 3,5 0,0 0,0 100,0 94,9 5,1 0,0 0,0 100,0 94,8 5,2 0,0 0,0 100,0<br />
Total 75,2 3,7 0,0 21,1 100,0 80,1 2,8 0,1 17,0 100,0 81,3 3,2 0,0 15,5 100,0 80,8 3,0 0,0 16,2 100,0<br />
Fuente: E<strong>la</strong>boración propia a partir <strong>de</strong> <strong>la</strong> Imagen Final <strong>de</strong> <strong>la</strong> Demanda 1995, 2001 y <strong>actual</strong>ización 2002 y 2003.<br />
249<br />
Revisión <strong>de</strong>l Segundo P<strong>la</strong>n General <strong>de</strong> Carreteras <strong>de</strong>l País Vasco
La cuota <strong>de</strong> reparto modal correspondiente al período 1995 – 2003 figura en el gráfico a continuación; como se ha<br />
indicado anteriormente para <strong>la</strong> movilidad <strong>de</strong> viajeros, estos datos correspon<strong>de</strong>n al transporte <strong>de</strong> mercancías en el<br />
País Vasco en un ámbito que supera el comarcal.<br />
%<br />
90,0<br />
80,0<br />
70,0<br />
60,0<br />
50,0<br />
40,0<br />
30,0<br />
20,0<br />
10,0<br />
0,0<br />
REPARTO MODAL GLOBAL<br />
Año 1995 Año 2001 Año 2002 Año 2003<br />
Carretera Ferrocarril Aéreo Marítimo<br />
Fuente: E<strong>la</strong>boración propia<br />
El modo más utilizado en el transporte <strong>de</strong> mercancías es <strong>la</strong> carretera, que en el año 2003 transporta el 80,8% <strong>de</strong>l<br />
total <strong>de</strong> mercancías, frente al 16,2 <strong>de</strong>l marítimo y el 3,0% <strong>de</strong>l ferrocarril. El transporte aéreo, <strong>de</strong>bido a sus<br />
características específicas, no tiene prácticamente representación en el transporte <strong>de</strong> mercancías en <strong>la</strong> CAPV.<br />
Des<strong>de</strong> 1995 <strong>la</strong> carretera, <strong>de</strong> forma progresiva, ha ganado terreno al resto <strong>de</strong> modos en competencia, pasando <strong>de</strong><br />
tener una cuota <strong>de</strong> reparto modal <strong>de</strong>l 75,2% en dicho año a un 80,1% en el año 2001, y el 80,8% <strong>de</strong> 2003.<br />
La <strong>de</strong>manda <strong>de</strong> transporte <strong>de</strong> mercancías por carretera ha crecido un 65,2% <strong>de</strong>s<strong>de</strong> 1995, lo que equivale a un<br />
6,5% <strong>de</strong> crecimiento medio anual, aunque este crecimiento no es homogéneo, ya que mientras los viajes internos<br />
crecen al 4,3%, los originados y los tránsitos superan el 7,5% anual.<br />
El ferrocarril ha disminuido su cuota <strong>de</strong> reparto, a favor <strong>de</strong> <strong>la</strong> carretera, en 0,7 puntos <strong>de</strong>s<strong>de</strong> 1995, en que alcanzó<br />
un 3,7% <strong>de</strong>l total <strong>de</strong>l volumen <strong>de</strong> mercancías transportadas.<br />
No obstante, <strong>la</strong> <strong>de</strong>manda <strong>de</strong> mercancías por ferrocarril ha aumentado en un 25,2% en el período 1995 - 2003, lo<br />
que equivale a una tasa anual <strong>de</strong> crecimiento <strong>de</strong>l 2,9%. Este incremento es imputable, principalmente, a <strong>la</strong>s<br />
mercancías en tránsito, que han crecido a un ritmo anual <strong>de</strong>l 13,6%, seguidas a distancia por <strong>la</strong>s mercancías con<br />
origen y / o <strong>de</strong>stino en el País Vasco, que lo han hecho a un ritmo <strong>de</strong>l 2,2% anual. La <strong>de</strong>manda interior <strong>de</strong><br />
mercancías ha bajado una media <strong>de</strong> un 8% anual en dicho período.<br />
El marítimo también ha cedido terreno frente a <strong>la</strong> carretera <strong>de</strong>s<strong>de</strong> 1995, perdiendo casi 5 puntos en su cuota <strong>de</strong><br />
reparto modal. La <strong>de</strong>manda <strong>de</strong> mercancías vía marítima ha crecido <strong>de</strong>s<strong>de</strong> 1995 un 18,3%, a un ritmo medio anual<br />
<strong>de</strong>l 2,1%.<br />
El tráfico aéreo <strong>de</strong> mercancías ha crecido un 157,4% <strong>de</strong>s<strong>de</strong> 1995, a un ritmo <strong>de</strong>l 12,5% anual. No obstante, como<br />
se ha comentado anteriormente, representa una fracción no significativa en el conjunto <strong>de</strong> <strong>la</strong> <strong>de</strong>manda <strong>de</strong><br />
mercancías.<br />
Si se analiza <strong>la</strong> evolución <strong>de</strong> <strong>la</strong> movilidad global <strong>de</strong> mercancías entre 2001 y 2003 cabe extraer <strong>la</strong>s siguientes<br />
conclusiones:<br />
√ El transporte <strong>de</strong> mercancías se ha incrementado un 11,2% en el período 2001 - 2003, equivalente a una<br />
tasa <strong>de</strong> crecimiento medio anual <strong>de</strong>l 5,5% (<strong>de</strong>l mismo or<strong>de</strong>n que <strong>la</strong> registrada entre 1995 y 2001).<br />
El transporte interior al País Vasco no ha crecido tanto como el exterior: mientras el primero lo ha hecho a<br />
un ritmo medio <strong>de</strong>l 1,8% anual el transporte exterior con origen o <strong>de</strong>stino en el País Vasco lo ha hecho al<br />
6,5% y los tránsitos al 8,2%.<br />
√ La movilidad <strong>de</strong> mercancías por carretera ha registrado en dicho período valores prácticamente iguales a los<br />
<strong>de</strong> <strong>la</strong> movilidad global: 11,4% <strong>de</strong> incremento total, con una tasa <strong>de</strong> crecimiento medio anual <strong>de</strong>l 5,5%. Aunque<br />
dicho crecimiento es inferior al observado en el período 1995 – 2001, en que se alcanzó una tasa <strong>de</strong><br />
crecimiento anual <strong>de</strong>l 6,8%.<br />
El incremento en <strong>la</strong> movilidad <strong>de</strong> mercancías por carretera se <strong>de</strong>be, principalmente, a los viajes originados y<br />
a los tránsitos que han registrado tasas anuales <strong>de</strong> crecimiento <strong>de</strong>l 7,4% y <strong>de</strong>l 7,2% respectivamente <strong>de</strong>s<strong>de</strong><br />
2001. En el transporte interior, el ritmo ha sido bastante inferior, un 1,8% <strong>de</strong> tasa media anual.<br />
√ La evolución <strong>de</strong> <strong>la</strong> <strong>de</strong>manda <strong>de</strong> mercancías ferro<strong>viaria</strong>s presenta una ten<strong>de</strong>ncia creciente en este período,<br />
observándose un incremento medio anual <strong>de</strong>l 8,7%. En el período 1995 – 2001 esta ten<strong>de</strong>ncia creciente era<br />
<strong>de</strong>l 1% anual. No obstante, es necesario matizar que pese al ascenso registrado entre 2001 y 2003, el<br />
ferrocarril parece haberse estancado ya que el incremento que experimentó entre 2002 y 2003 fue<br />
insignificante (un 0,01%).<br />
El incremento en <strong>la</strong> movilidad <strong>de</strong> mercancías por ferrocarril en el período es imputable, <strong>de</strong> forma<br />
mayoritaria, a los tránsitos que han registrado una tasa anual <strong>de</strong> crecimiento medio <strong>de</strong>l 32,2% <strong>de</strong>s<strong>de</strong> 2001.<br />
En el transporte exterior, el ritmo ha sido bastante inferior, un 3,8% <strong>de</strong> tasa media anual. Por el contrario,<br />
el transporte interior ha caído <strong>de</strong>s<strong>de</strong> 2001 a un ritmo anual <strong>de</strong>l 2%.<br />
250<br />
Revisión <strong>de</strong>l Segundo P<strong>la</strong>n General <strong>de</strong> Carreteras <strong>de</strong>l País Vasco
√ Entre 2001 y 2003 el tráfico marítimo se ha incrementado a un ritmo <strong>de</strong>l 4,6% anual, muy superior al<br />
registrado en el período 1995 – 2001 en que se alcanzó un 1,3% <strong>de</strong> media anual.<br />
√ El tráfico aéreo ha crecido entre 2001 y 2003 a un ritmo <strong>de</strong>l 5,0% anual, muy inferior al registrado en el<br />
período 1995 – 2001 en que se registró un 15,2% <strong>de</strong> media anual.<br />
En re<strong>la</strong>ción con el transporte interior a <strong>la</strong> CAPV, <strong>la</strong> carretera es el modo dominante, con <strong>la</strong> única y cada vez menor<br />
oposición <strong>de</strong>l ferrocarril. Concretamente, en el año 2003 el 99,1% <strong>de</strong>l transporte interior <strong>de</strong> mercancías se<br />
realizaron por carretera frente al 0,9% <strong>de</strong>l ferrocarril.<br />
REPARTO MODAL DEL TRANSPORTE INTERIOR DE MERCANCÍAS<br />
%<br />
100,0<br />
90,0<br />
80,0<br />
70,0<br />
60,0<br />
50,0<br />
40,0<br />
30,0<br />
20,0<br />
10,0<br />
0,0<br />
Año 1995 Año 2001 Año 2002 Año 2003<br />
Carretera Ferrocarril Aéreo Marítimo<br />
Fuente: E<strong>la</strong>boración propia<br />
Comparando esta <strong>situación</strong> con <strong>la</strong> correspondiente al año 1995 cabe indicar que <strong>la</strong> carretera ha incrementado su<br />
cutota en 2 puntos (97,1% en 1995 frente al citado 99,1% <strong>de</strong>l año 2003); por el contrario, el ferrocarril <strong>la</strong> ha<br />
disminuido en 1,5 puntos (2,4% en 1995 frente al 0,9% <strong>de</strong> 2003).<br />
El modo más utilizado en el transporte exterior <strong>de</strong> mercancías es <strong>la</strong> carretera, que en el año 2003 transporta el<br />
69,7% <strong>de</strong>l total <strong>de</strong> mercancías, frente al 27,0 <strong>de</strong>l marítimo y el 3,3% <strong>de</strong>l ferrocarril. El transporte aéreo, <strong>de</strong>bido a<br />
sus características específicas, no tiene prácticamente representación en el transporte <strong>de</strong> mercancías en <strong>la</strong> CAPV.<br />
REPARTO MODAL DEL TRANSPORTE EXTERIOR DE MERCANCÍAS<br />
%<br />
80,0<br />
70,0<br />
60,0<br />
50,0<br />
40,0<br />
30,0<br />
20,0<br />
10,0<br />
0,0<br />
Año 1995 Año 2001 Año 2002 Año 2003<br />
Carretera Ferrocarril Aéreo Marítimo<br />
Fuente: E<strong>la</strong>boración propia<br />
En el período 1995 – 2003, <strong>la</strong> carretera ha incrementado notablemente su cuota <strong>de</strong> participación en este<br />
segmento, un 9,2% en el período. Por el contrario, el transporte marítimo ha visto disminuir su cuota en un 8,2%<br />
(ha pasado <strong>de</strong> transportar un 35,1% en 1995 al 27,0% <strong>de</strong> 2003) y el ferrocarril ha experimentado un <strong>de</strong>scenso <strong>de</strong><br />
1,1 puntos en el período.<br />
En re<strong>la</strong>ción con los viajes <strong>de</strong> tránsito, <strong>la</strong> carretera es también el modo p<strong>red</strong>ominante, con una cuota <strong>de</strong> mercado<br />
que se aproxima al 95% en el año 2003.<br />
Como conclusiones finales <strong>de</strong>l <strong>análisis</strong> <strong>de</strong> <strong>la</strong> <strong>de</strong>manda <strong>de</strong> transporte <strong>de</strong> mercancías en <strong>la</strong> CAPV en el período 1995<br />
- 2003, cabe extraer <strong>la</strong>s siguientes:<br />
√ El avance <strong>de</strong> <strong>la</strong> carretera en todos los tipos <strong>de</strong> viaje.<br />
√ El estancamiento <strong>de</strong>l ferrocarril.<br />
√ El relevante crecimiento <strong>de</strong>l avión y <strong>de</strong>l barco en los viajes con origen y / o <strong>de</strong>stino en el País Vasco.<br />
251<br />
Revisión <strong>de</strong>l Segundo P<strong>la</strong>n General <strong>de</strong> Carreteras <strong>de</strong>l País Vasco
<strong>2.</strong>3.2 Transporte por carretera<br />
<strong>2.</strong>3.<strong>2.</strong>1. Transporte <strong>de</strong> viajeros<br />
A continuación se presenta una tab<strong>la</strong> resumen <strong>de</strong> <strong>la</strong> evolución <strong>de</strong> <strong>la</strong> <strong>de</strong>manda <strong>de</strong> transporte por carretera en el<br />
período 1995 – 2003 (vehículo ligero y autobús), en función <strong>de</strong> <strong>la</strong> naturaleza <strong>de</strong>l viaje. La <strong>de</strong>manda <strong>de</strong> transporte<br />
se refiere exclusivamente a los viajes que superan el ámbito comarcal.<br />
252<br />
Revisión <strong>de</strong>l Segundo P<strong>la</strong>n General <strong>de</strong> Carreteras <strong>de</strong>l País Vasco
Naturaleza <strong>de</strong>l viaje<br />
DEMANDA DE TRANSPORTE DE VIAJEROS POR CARRETERA EN LA CAPV 6<br />
Año 1995 Año 2001 Año 2002 Año 2003<br />
V. Ligero Autobús Total V. Ligero Autobús Total V. Ligero Autobús Total V. Ligero Autobús Total<br />
Viajeros % Viajeros % Viajeros % Viajeros % Viajeros % Viajeros % Viajeros % Viajeros % Viajeros % Viajeros % Viajeros % Viajeros %<br />
Viajes Internos 246.917 65,5 169.672 90,1 416.589 73,7 289.296 62,3 181.299 94,2 611.977 76,7 294.678 61,3 181.299 94,2 475.977 70,7 301.362 60,2 178.195 93,7 479.557 69,4<br />
Viajes O/D País Vasco<br />
(nacional)<br />
Viajes O/D País Vasco<br />
(internacional)<br />
84.442 22,4 114.653 24,7 11.192 5,8 125.845 15,8 12<strong>2.</strong>582 25,5 13<strong>2.</strong>592 26,5<br />
38.346 10,2<br />
18.283 9,7 141.071 25,0<br />
50.271 10,8 - - 50.271 6,3 5<strong>2.</strong>957 11,0<br />
11.192 5,8 186.731 27,2<br />
55.083 11,0<br />
11.907 6,3 199.582 28,9<br />
Viajes <strong>de</strong> Tránsito 7.329 1,9 413 0,2 7.742 1,4 10.173 2,2 - - 10.173 1,3 10.810 2,2 - - 10.810 1,6 11.537 2,3 - - 11.537 1,7<br />
Total 377.034 100,0 188.368 100,0 565.402 100,0 464.393 100,0 19<strong>2.</strong>491 100,0 798.266 100,0 481.027 100,0 19<strong>2.</strong>491 100,0 673.518 100,0 500.574 100,0 190.102 100,0 690.676 100,0<br />
Naturaleza <strong>de</strong>l viaje<br />
Fuente: E<strong>la</strong>boración propia a partir <strong>de</strong> <strong>la</strong> Imagen Final <strong>de</strong> <strong>la</strong> Demanda 1995, 2001 y <strong>actual</strong>ización 2002 y 2003.<br />
Ocupación<br />
REPARTO MODAL (%) EN EL TRANSPORTE POR CARRETERA<br />
Año 1995 Año 2001 Año 2002 7 Año 2003<br />
V. Ligero Autobús V. Ligero Autobús V. Ligero Autobús V. Ligero Autobús<br />
Reparto<br />
Modal<br />
Reparto<br />
Modal<br />
Ocupación<br />
Reparto<br />
Modal<br />
Reparto<br />
Modal<br />
Reparto<br />
Modal<br />
Reparto<br />
Modal<br />
Reparto<br />
Modal<br />
Viajes Internos 1,43 59,3 40,7 1,29 61,5 38,5 61,9 38,1 62,8 37,2<br />
Viajes O/D País Vasco (nacional) 1,64 1,39<br />
87,0 13,0<br />
Viajes O/D País Vasco (internacional) 1,56<br />
1,54<br />
Reparto<br />
Modal<br />
93,6 3,4 94,0 6,0 94,0 6,0<br />
Viajes <strong>de</strong> Tránsito 1,95 94,7 5,3 1,89 100,0 0,0 100,0 0,0 100,0 0,0<br />
Total viajes 1,49 66,7 33,3 1,35 70,7 29,3 71,4 28,6 72,5 27,5<br />
Fuente: E<strong>la</strong>boración propia a partir <strong>de</strong> <strong>la</strong> Imagen Final <strong>de</strong> <strong>la</strong> Demanda 1995, 2001 y <strong>actual</strong>ización 2002 y 2003.<br />
6 En el año 1995 se consi<strong>de</strong>ra el número <strong>de</strong> personas que viajan en el día medio <strong>la</strong>borable, mientras que en los años 2001, 2002 y 2003 es en el día medio anual.<br />
7 En los años 2002 y 2003 no se dispone <strong>de</strong> datos <strong>de</strong> ocupación <strong>de</strong> vehículo privado.<br />
253<br />
Revisión <strong>de</strong>l Segundo P<strong>la</strong>n General <strong>de</strong> Carreteras <strong>de</strong>l País Vasco
En el día medio <strong>de</strong>l año 2003 <strong>la</strong> <strong>de</strong>manda <strong>de</strong> transporte por carretera registró un total <strong>de</strong> 690.676 viajeros<br />
transportados, <strong>de</strong> los cuales un 72,5% emplearon el vehículo privado y un 26,5% el autobús.<br />
El número <strong>de</strong> personas que viajaron en vehículo ligero ascendió a 500.574, mientras en el día <strong>la</strong>borable medio <strong>de</strong>l<br />
año 1995 lo hacían 377.034 personas; es <strong>de</strong>cir, <strong>la</strong> movilidad en vehículo ligero ha experimentado un crecimiento<br />
<strong>de</strong>l 32,8% en el período 1995 – 2003, lo que equivale a una media acumu<strong>la</strong>tiva anual <strong>de</strong>l 3,6%. Este ritmo <strong>de</strong><br />
crecimiento <strong>de</strong> <strong>la</strong> movilidad en vehículo ligero es mayor que el observado entre 1995 y 2001, <strong>de</strong>bido<br />
fundamentalmente al notable incremento <strong>de</strong> los viajes exteriores durante los últimos años.<br />
La ocupación media <strong>de</strong>l vehículo ligero se ha visto <strong>red</strong>ucida en los últimos años como consecuencia <strong>de</strong>l aumento<br />
<strong>de</strong>l índice <strong>de</strong> motorización (en el año 2003, en el conjunto <strong>de</strong> <strong>la</strong> CAPV era <strong>de</strong> 518 vehículos / 1.000 habitantes; <strong>de</strong><br />
552 vehículos / 1.000 habitantes en Á<strong>la</strong>va; <strong>de</strong> 541 vehículos / 1.000 habitantes en Gipuzkoa; y <strong>de</strong> 495 vehículos /<br />
1.000 habitantes en Bizkaia). Así, mientras en el año 1990 el índice <strong>de</strong> ocupación era <strong>de</strong> 1,53 pasajeros / vehículo<br />
en el año 1995 pasó a ser <strong>de</strong> 1,49 y en el año 2001 ha sido <strong>de</strong> 1,35. Es en los viajes nacionales con origen o<br />
<strong>de</strong>stino <strong>la</strong> CAPV don<strong>de</strong> esta <strong>red</strong>ucción <strong>de</strong> <strong>la</strong> ocupación ha sido más acusada (1,64 pasajeros / vehículo en 1995<br />
respecto a 1,39 en el año 2001), seguida <strong>de</strong> los viajes internos (1,43 en 1995 frente a 1,29 en el año 2001). Por<br />
el contrario, en los viajes internacionales con origen / <strong>de</strong>stino el País Vasco y en los <strong>de</strong> tránsito <strong>la</strong> <strong>red</strong>ucción ha<br />
sido más mo<strong>de</strong>rada.<br />
Respecto a <strong>la</strong> <strong>de</strong>manda <strong>de</strong> transporte en autobús, en el día medio <strong>de</strong>l año 2003 viajaron en este modo 190.102<br />
viajeros frente a los 188.368 <strong>de</strong>l año 1995. En el período <strong>de</strong> <strong>análisis</strong> el transporte público por carretera se ha<br />
mantenido prácticamente estable, creciendo a un ritmo <strong>de</strong>l 0,1% anual. Este crecimiento es muy inferior al<br />
experimentado por el vehículo privado, siendo evi<strong>de</strong>nte, por tanto, que el vehículo privado ha ganado peso frente<br />
al autobús <strong>de</strong>s<strong>de</strong> el año 1995.<br />
Atendiendo a <strong>la</strong> naturaleza <strong>de</strong>l viaje, el reparto modal es c<strong>la</strong>ramente favorable al vehículo privado ya que éste<br />
canaliza en el año 2003 el 63% <strong>de</strong> los viajes internos al País Vasco, el 94% <strong>de</strong> los viajes originados y el 100% <strong>de</strong><br />
los tránsitos. Si se compara con el año 1995, se observa que el coche ha ganado progresivamente cuota <strong>de</strong><br />
mercado frente al autobús para cualquier tipología <strong>de</strong> viaje.<br />
Los viajes internos en vehículo privado han crecido, en el período 1995 – 2003, a un ritmo <strong>de</strong>l 2,5% <strong>de</strong> media<br />
anual, mientras que los viajes originados y los tránsitos superan el 5% anual. La mayor parte <strong>de</strong> los viajes que se<br />
realizan en vehículo privado son internos al País Vasco, alcanzando en el año 2003 un 60,2% <strong>de</strong>l total (un 65,5%<br />
en el año 1995); los viajes originados representan un 37,5% (un 32,5% en 1995) y los <strong>de</strong> tránsito suponen un<br />
2,3% <strong>de</strong>l total En 1995 alcanzaron un 2%).<br />
En el caso <strong>de</strong>l autobús, los viajes internos prácticamente se han mantenido estables en el período <strong>de</strong> <strong>análisis</strong>,<br />
experimentando un crecimiento medio anual <strong>de</strong>l 0,6%; por el contrario, los originados han disminuido a un ritmo<br />
<strong>de</strong>l 5,2% <strong>de</strong> media al año. En re<strong>la</strong>ción con <strong>la</strong> naturaleza <strong>de</strong>l <strong>de</strong>sp<strong>la</strong>zamiento, los viajes internos son absolutamente<br />
mayoritarios en este modo ya que representan el 94% <strong>de</strong>l total <strong>de</strong> los realizados en autobús (90% en 1995),<br />
frente al 6% <strong>de</strong> los que tiene como origen y / o <strong>de</strong>stino el País Vasco (9,8% en el año 1995).<br />
En re<strong>la</strong>ción con <strong>la</strong> estructura geográfica <strong>de</strong> los viajes pue<strong>de</strong> <strong>de</strong>cirse que ha cambiado poco en el período 1995 -<br />
2003. Respecto al vehículo ligero, los viajes internos a cada Territorio Histórico, los más numerosos, ascien<strong>de</strong>n en<br />
el año 2003 a 248.033 viajes / día medio (frente a los 198.007 viajes realizados en el día <strong>la</strong>borable medio <strong>de</strong>l año<br />
1995). Los viajes entre territorios suman 53.329 viajes / día medio (48.910 viajes / día <strong>la</strong>borable medio <strong>de</strong> 1995).<br />
Si se comparan con los viajes realizados con el exterior <strong>de</strong> <strong>la</strong> CAPV, se observa que los viajes inter - territoriales<br />
son muy inferiores a éstos, ten<strong>de</strong>ncia que no ha hecho sino acentuarse en el período 1995 – 2003: si en 1995 los<br />
viajes con el exterior <strong>de</strong> <strong>la</strong> Comunidad Autónoma superaban los ochenta mil (84.442 viajes / día <strong>la</strong>borable medio<br />
<strong>de</strong> 1995) en el año 2003 totalizan 13<strong>2.</strong>592 viajes / día medio. Es <strong>de</strong>cir, los Territorios Históricos se re<strong>la</strong>cionan<br />
más con el resto <strong>de</strong>l Estado español que con los otros Territorios.<br />
Bizkaia y Gipuzkoa producen un número <strong>de</strong> viajes mucho mayor que Á<strong>la</strong>va, aunque <strong>la</strong> proporción se ha mantenido<br />
prácticamente estable <strong>de</strong>s<strong>de</strong> 1995; ambos Territorios Históricos generan <strong>de</strong>l or<strong>de</strong>n <strong>de</strong> 3 a 3,5 veces más viajes<br />
internos que Á<strong>la</strong>va. En el caso <strong>de</strong> los viajes interiores a cada Territorio <strong>la</strong> ten<strong>de</strong>ncia también se ha mantenido en<br />
el caso <strong>de</strong> Bizkaia (que genera cinco veces más viajes que Á<strong>la</strong>va); en Gipuzkoa, por el contrario, <strong>la</strong> diferencia se<br />
ha ampliado pues si en 1995 generaba cinco veces y media más viajes que Á<strong>la</strong>va en el año 2003 genera algo más<br />
<strong>de</strong> seis.<br />
Los orígenes y <strong>de</strong>stinos más frecuentes, fuera <strong>de</strong> <strong>la</strong> CAPV, en vehículo privado son:<br />
√ La mayor parte <strong>de</strong> los viajes se producen con <strong>la</strong>s comunida<strong>de</strong>s colindantes: Navarra, Cantabria, Castil<strong>la</strong> y<br />
León y La Rioja son el origen o <strong>de</strong>stino <strong>de</strong>l 89% <strong>de</strong> los viajes que el País Vasco intercambia con otras CCAA<br />
(porcentaje que se mantiene estable en el período 1995 - 2003). El Territorio que más viajes originados<br />
produce es Bizkaia, con 7<strong>2.</strong>199 viajes / día medio <strong>de</strong>l año 2003, lo que supone el 54,5% frente al 25,0% <strong>de</strong><br />
Á<strong>la</strong>va y el 20,6% <strong>de</strong> Gipuzkoa.<br />
Si comparamos con el año 1995, <strong>la</strong>s posiciones re<strong>la</strong>tivas <strong>de</strong> los Territorios no varían, aunque si los<br />
porcentajes <strong>de</strong> generación <strong>de</strong> viajes respecto <strong>de</strong>l total: Bizkaia generaba el 46,5% <strong>de</strong> loa viajes diarios,<br />
Á<strong>la</strong>va el 25,3% y Gipuzkoa el 28,2%.<br />
√ De los 55.082 viajes / día medio al extranjero (38.346 viajes / día <strong>la</strong>borable medio <strong>de</strong> 1995) <strong>la</strong> práctica<br />
totalidad se realizan con Francia (98,0% en el año 2003 frente al 99,3% <strong>de</strong>l año 1995), siendo el territorio <strong>de</strong><br />
Gipuzkoa el que más participa en <strong>la</strong> producción <strong>de</strong> estos viajes.<br />
En re<strong>la</strong>ción con el motivo <strong>de</strong> viaje en el transporte por carretera se adjunta a continuación un resumen <strong>de</strong> los<br />
motivos principales, según modo, para los años 1995 y 2001 últimos para los que se dispone <strong>de</strong> información.<br />
254<br />
Revisión <strong>de</strong>l Segundo P<strong>la</strong>n General <strong>de</strong> Carreteras <strong>de</strong>l País Vasco
Motivo <strong>de</strong>l viaje<br />
DISTRIBUCIÓN DE LOS VIAJES (%) SEGÚN MOTIVO<br />
Año 1995 Año 2001<br />
Vehículo Ligero Autobús Vehículo Ligero Autobús<br />
Trabajo 53,0 29,0 64,0 28,0<br />
Asuntos Personales 18,6 1,8 14,0 23,0<br />
Ocio 17,5 21,5 10,5 31,0<br />
Compras 7,4 16,0 7,8 1,0<br />
Estudios 3,7 31,7 3,7 17,0<br />
Fuente: E<strong>la</strong>boración propia a partir <strong>de</strong> Imagen Global <strong>de</strong> <strong>la</strong> Demanda 1995, 2001 y <strong>actual</strong>ización 2002 y 2003.<br />
En el caso <strong>de</strong>l vehículo ligero, el motivo más frecuente <strong>de</strong> viaje es el trabajo, que a<strong>de</strong>más en el período 1995 -<br />
2001 se ha visto incrementado en once puntos. Le siguen en importancia los asuntos personales y el ocio, aunque<br />
en estos dos casos, en lugar <strong>de</strong> aumentar el porcentaje <strong>de</strong> viajes en los últimos años, ha disminuido. Finalmente,<br />
son <strong>la</strong>s compras y los estudios, los motivos que menos viajes generan.<br />
En el caso <strong>de</strong>l autobús, <strong>la</strong>s diferencias <strong>de</strong> un año a otro han sido más significativas. En 1995, eran los estudiantes<br />
los ciudadanos que más empleaban este modo <strong>de</strong> transporte con el 31,7% <strong>de</strong> los viajes, mientras que en el 2001<br />
es el ocio el motivo que más viajes genera (31%). A<strong>de</strong>más, se ha producido un importante cambio en el caso <strong>de</strong><br />
los viajes motivados por asuntos sociales y por compras. Los primeros <strong>de</strong> suponer un 1,8%, han pasado a<br />
suponer un 23%, y los segundos <strong>de</strong> un 16% se han <strong>red</strong>ucido hasta el 1%. Es <strong>de</strong>cir, <strong>la</strong> ciudadanos con objeto <strong>de</strong><br />
<strong>de</strong>sarrol<strong>la</strong>r sus asuntos propios usa cada vez más el transporte público, mientras que <strong>la</strong>s en <strong>la</strong>s compras usa cada<br />
vez el transporte privado.<br />
<strong>2.</strong>3.<strong>2.</strong><strong>2.</strong> Transporte <strong>de</strong> mercancías<br />
En el día medio <strong>de</strong>l año 2003, se transportaron por carretera un total <strong>de</strong> 47<strong>2.</strong>991 tone<strong>la</strong>das en el País Vasco (un<br />
5,1% más que en el año anterior), <strong>de</strong> <strong>la</strong>s que el 30,9% correspon<strong>de</strong> a transporte interior a <strong>la</strong> Comunidad<br />
Autónoma, el 52,0% tenían como origen y / o <strong>de</strong>stino el País Vasco (transporte tanto nacional como internacional)<br />
y el 17,1% restante correspondía a mercancías en tránsito. Si se compara con el año 2001, en el que se<br />
transportaron 424.673 tone<strong>la</strong>das / día medio, se observa que el crecimiento medio acumu<strong>la</strong>tivo anual ha sido <strong>de</strong><br />
un 5,5%. El incremento en <strong>la</strong> movilidad <strong>de</strong> mercancías por carretera se <strong>de</strong>be, principalmente, a los viajes<br />
originados y a los tránsitos que han registrado tasas anuales <strong>de</strong> crecimiento <strong>de</strong>l 7,4% y <strong>de</strong>l 7,2% respectivamente<br />
<strong>de</strong>s<strong>de</strong> 2001. En el transporte interior, el ritmo ha sido bastante inferior, un 1,8% <strong>de</strong> tasa media anual.<br />
Dicho crecimiento medio es inferior al 6,8% anual experimentado entre 1995 y 2001, que también fue soportado<br />
fundamentalmente por los viajes originados y en tránsito.<br />
Consi<strong>de</strong>rando el período 1995 – 2003, <strong>la</strong> <strong>de</strong>manda <strong>de</strong> transporte <strong>de</strong> mercancías por carretera ha crecido un<br />
65,2% <strong>de</strong>s<strong>de</strong> 1995, lo que equivale a un 6,5% <strong>de</strong> crecimiento medio anual, aunque este crecimiento no es<br />
homogéneo, ya que mientras los viajes internos crecen al 4,3%, los originados y los tránsitos superan el 7,5%<br />
anual.<br />
En el año 2003, el 50,4% <strong>de</strong> <strong>la</strong>s Tn - km se transportan en tránsito (42,7% en 1995), el 46,9% tienen como<br />
origen y / o <strong>de</strong>stino el País Vasco (frente al 51,8% <strong>de</strong>l año 1995) y el 2,7% son internas al País Vasco (en 1995,<br />
5,6%).<br />
Sin embargo el tráfico <strong>de</strong> tránsito mueve el 42% <strong>de</strong> los veh. - km (32,6% en 1995) y el 17,1% <strong>de</strong> <strong>la</strong>s tone<strong>la</strong>das<br />
(15,7% en ese año), mientras que el tráfico con origen y / o <strong>de</strong>stino en el País Vasco (incluidos los internos)<br />
mueve el 58,0% <strong>de</strong> los veh. - km (67,4% en 1995) y el 83,0% <strong>de</strong> <strong>la</strong>s tone<strong>la</strong>das (84,3% en el año 1995).<br />
Los recorridos medios, en el año 2003, según <strong>la</strong> tipología <strong>de</strong> viaje son:<br />
√ 42 km para los viajes con origen y <strong>de</strong>stino en el País Vasco.<br />
√ 433 km para los viajes con origen o <strong>de</strong>stino en el País Vasco.<br />
√ 1.417 km para los viajes en tránsito.<br />
255<br />
Revisión <strong>de</strong>l Segundo P<strong>la</strong>n General <strong>de</strong> Carreteras <strong>de</strong>l País Vasco
Naturaleza <strong>de</strong>l<br />
viaje<br />
TONELADAS TRANSPORTADAS, Y TRÁFICO REALIZADO, EN LA CAPV<br />
Día <strong>la</strong>borable medio (año 1995) Día medio (año 2001) Día medio (año 2002) Día medio (año 2003)<br />
Tn % Veh-km T-km Tn % Veh-km T-km Tn % Veh-km T-km Tn % Veh-km T-km<br />
Viajes Internos 104.028 36,3 1.567.566 5.448.156 140.979 33,2 1.607.245 5.92<strong>2.</strong>640 143.145 31,8 1.633.727 6.014.370 146.111 30,9 1.668.739 6.138.421<br />
Viajes Originados 137.443 48,0 4.88<strong>2.</strong>074 50.468.178 213.458 50,3 9.088.518 9<strong>2.</strong>961.202 231.036 51,3 9.833.249 100.391.929 246.100 52,0 10.467.052 106.551.704<br />
Viajes <strong>de</strong> Tránsito 44.887 15,7 3.123.381 41.601.838 70.236 16,5 7.691.250 100.119.188 75.933 16,9 8.296.345 108.060.544 80.780 17,1 8.800.431 114.473.817<br />
Total 286.358 100,0 9.573.021 97.518.172 424.673 100,0 18.387.013 199.003.030 450.114 100,0 19.763.321 214.466.843 47<strong>2.</strong>991 100,0 20.936.222 227.163.942<br />
Naturaleza <strong>de</strong>l<br />
viaje<br />
Fuente: E<strong>la</strong>boración propia a partir <strong>de</strong> <strong>la</strong> Imagen Final <strong>de</strong> <strong>la</strong> Demanda 1995, 2001 y <strong>actual</strong>ización 2002 y 2003.<br />
DISTRIBUCIÓN DEL TRANSPORTE DE MERCANCÍAS POR CARRETERA INTERIOR AL PAÍS VASCO<br />
Tn / día <strong>la</strong>borable medio (año 1995) Tn / día medio (año 2001) Tn / día medio (año 2002) Tn / día medio (año 2003)<br />
Á<strong>la</strong>va Bizkaia Gipuzkoa Total Á<strong>la</strong>va Bizkaia Gipuzkoa Total Á<strong>la</strong>va Bizkaia Gipuzkoa Total Á<strong>la</strong>va Bizkaia Gipuzkoa Total<br />
Á<strong>la</strong>va 1.469 3.875 <strong>2.</strong>052 7.396 7.200 7.159 3.209 17.568 7.315 7.296 3.383 17.894 7.493 7.474 3.368 18.332<br />
Bizkaia 7.869 39.297 9.319 56.485 14.694 38.862 15.017 68.574 14.832 39.443 15.224 64.499 15.106 40.280 15.503 70.888<br />
Gipuzkoa <strong>2.</strong>942 6.664 30.541 40.147 3.188 14.682 36.968 54.838 3.231 14.915 37.605 55.752 3.298 15.221 38.372 56.891<br />
Total 1<strong>2.</strong>280 49.836 41.912 104.028 25.081 60.704 55.195 140.979 25.378 61.653 56.113 143.145 25.897 6<strong>2.</strong>972 57.242 146.111<br />
Fuente: E<strong>la</strong>boración propia a partir <strong>de</strong> <strong>la</strong> Imagen Final <strong>de</strong> <strong>la</strong> Demanda 1995, 2001 y <strong>actual</strong>ización 2002 y 2003.<br />
256<br />
Revisión <strong>de</strong>l Segundo P<strong>la</strong>n General <strong>de</strong> Carreteras <strong>de</strong>l País Vasco
En el año 2003, el transporte con origen o <strong>de</strong>stino en alguno <strong>de</strong> los tres Territorios Históricos supone un total <strong>de</strong><br />
39<strong>2.</strong>211 tone<strong>la</strong>das <strong>de</strong> carga, el 62,4% más que en 1995. Las 146.111 tone<strong>la</strong>das internas al País Vasco se reparten<br />
en 86.145 internas a los Territorios y 88.869 inter - territoriales.<br />
Respecto a <strong>la</strong> carga transportada en viajes internos (entre comarcas <strong>de</strong> <strong>la</strong> CAPV) cabe <strong>de</strong>stacar <strong>la</strong> mayor<br />
capacidad <strong>de</strong> Bizkaia y Gipuzkoa para generar transporte <strong>de</strong> cargas, mucho más elevada que <strong>la</strong> <strong>de</strong> Á<strong>la</strong>va. A nivel<br />
interno <strong>de</strong>l territorio, y tal como ocurre <strong>de</strong>s<strong>de</strong> el año 1995, Bizkaia genera más transporte <strong>de</strong> carga que Gipuzkoa.<br />
El transporte <strong>de</strong> mercancías interior a los tres Territorios Históricos ha crecido en el período 2001 - 2003 a un<br />
ritmo <strong>de</strong>l 1,8%. Algo más lentamente lo ha hecho el transporte entre Territorios Históricos (1,7% anual).<br />
Las Comunida<strong>de</strong>s que, <strong>de</strong>s<strong>de</strong> 2001, mantienen un mayor volumen <strong>de</strong> intercambios con los tres Territorios son:<br />
√ Para Á<strong>la</strong>va: Castil<strong>la</strong> y León, Cataluña y Navarra.<br />
√ Para Bizkaia: Castil<strong>la</strong> y León, Cantabria y Madrid.<br />
√ Para Gipuzkoa: Navarra, Castil<strong>la</strong> y León y Cantabria.<br />
Por el contrario, esta <strong>situación</strong> difiere ligeramente <strong>de</strong> <strong>la</strong> <strong>de</strong>l año 1995:<br />
√ Para Á<strong>la</strong>va: Navarra, Castil<strong>la</strong> y León y Cataluña y Madrid.<br />
√ Para Bizkaia: Asturias y Cantabria, Castil<strong>la</strong> y León y Navarra.<br />
√ Para Gipuzkoa: Navarra, Castil<strong>la</strong> y León y Madrid.<br />
De los 5<strong>2.</strong>143 Tn / día medio al extranjero (20.682 Tn / día <strong>la</strong>borable medio <strong>de</strong> 1995) <strong>la</strong> mitad se realizan con<br />
Francia (51,0% en el año 2003 frente al 74,6% <strong>de</strong>l año 1995), siendo el territorio <strong>de</strong> Gipuzkoa el que más<br />
participa en este tráfico, y una mínima parte con Portugal.<br />
<strong>2.</strong>3.3 Transporte ferroviario<br />
Los servicios <strong>de</strong> ferrocarril en el País Vasco están a cargo <strong>de</strong> EuskoTren, RENFE, FEVE y Metro <strong>de</strong> Bilbao.<br />
EuskoTren presta servicios en <strong>la</strong>s cercanías <strong>de</strong> Bilbao situadas en <strong>la</strong> margen <strong>de</strong>recha <strong>de</strong> <strong>la</strong> ría y en <strong>la</strong>s líneas <strong>de</strong><br />
Bilbao a Donostia-San Sebastián y <strong>de</strong> esta ciudad a Hendaia, así como en el ramal <strong>de</strong> Amorebieta a Bermeo.<br />
Des<strong>de</strong> noviembre <strong>de</strong> 1995 <strong>la</strong> línea Bilbao - Plentzia ha pasado a formar parte <strong>de</strong> <strong>la</strong> Línea 1 <strong>de</strong>l Metro <strong>de</strong> Bilbao.<br />
RENFE por su parte, presta los servicios <strong>de</strong> <strong>la</strong>s cercanías <strong>de</strong> <strong>la</strong> margen izquierda <strong>de</strong> Bilbao y los <strong>de</strong> <strong>la</strong>rgo recorrido,<br />
regional y cercanías en <strong>la</strong>s líneas Miranda <strong>de</strong> Ebro - Bilbao y Miranda <strong>de</strong> Ebro - Vitoria-Gasteiz - Hendaia. FEVE<br />
presta servicios en el trayecto Bilbao - Balmaseda y en <strong>la</strong> conexión con Santan<strong>de</strong>r, Asturias y Galicia. Finalmente,<br />
Metro <strong>de</strong> Bilbao, da servicio a <strong>la</strong> movilidad <strong>de</strong>l entorno metropolitano <strong>de</strong> Bilbao.<br />
A continuación se presenta una tab<strong>la</strong> resumen <strong>de</strong> <strong>la</strong> evolución <strong>de</strong> <strong>la</strong> <strong>de</strong>manda <strong>de</strong> transporte canalizada por<br />
ferrocarril en el período 1995 – 2003 (para todos los operadores), en función <strong>de</strong> <strong>la</strong> naturaleza <strong>de</strong>l viaje. La<br />
<strong>de</strong>manda <strong>de</strong> transporte se refiere exclusivamente a los viajes que superan el ámbito comarcal.<br />
257<br />
Revisión <strong>de</strong>l Segundo P<strong>la</strong>n General <strong>de</strong> Carreteras <strong>de</strong>l País Vasco
Naturaleza <strong>de</strong>l<br />
viaje EuskoTren Cer.<br />
RENFE<br />
DEMANDA DE TRANSPORTE DE VIAJEROS POR FERROCARRIL EN LA CAPV 8<br />
Viajes / día <strong>la</strong>borable medio (1995) Viajes / día medio (2001) Viajes / día medio (2002) Viajes / día medio (2003)<br />
Reg.<br />
RENFE<br />
G.L.<br />
RENFE<br />
FEVE Total EuskoTren Cer.<br />
RENFE<br />
Reg.<br />
RENFE<br />
G.L.<br />
RENFE<br />
FEVE Metro Total EuskoTren Cer.<br />
RENFE<br />
Reg.<br />
RENFE<br />
G.L.<br />
RENFE<br />
FEVE Metro Total EuskoTren Cer.<br />
RENFE<br />
Reg.<br />
RENFE<br />
G.L.<br />
RENFE<br />
258<br />
FEVE Metro Total<br />
Viajes Internos 18.004 2<strong>2.</strong>652 3.215 114 4.882 48.867 19.844 30.577 547 299 3.236 10.077 64.580 18.138 27.200 579 85 3.471 10.058 59.531 18.454 28.128 574 62 3.394 10.307 60.919<br />
Viajes Originados 879 0 704 <strong>2.</strong>990 256 4.829 1.312 0 641 <strong>2.</strong>338 104 0. 4.395 1.124 0 590 <strong>2.</strong>464 100 0 4.279 1.103 0 630 <strong>2.</strong>153 162 0 4.049<br />
Total viajes 18.883 2<strong>2.</strong>652 3.919 4.699 5.138 55.291 21.156 30.577 1.188 <strong>2.</strong>637 3.340 10.077 68.975 19.262 27.200 1.169 <strong>2.</strong>549 3.571 10.058 63.810 19.557 28.128 1.204 <strong>2.</strong>215 3.556 10.307 64.967<br />
Naturaleza <strong>de</strong>l<br />
viaje EuskoTren Cer.<br />
RENFE<br />
Fuente: E<strong>la</strong>boración propia a partir <strong>de</strong> <strong>la</strong> Imagen Final <strong>de</strong> <strong>la</strong> Demanda 1995, 2001 y <strong>actual</strong>ización 2002 y 2003.<br />
CUOTA DE REPARTO SEGÚN OPERADOR FERROVIARIO Y TIPOLOGÍA DE VIAJE<br />
% (año 1995) % (año 2001) % (año 2002) % (año 2003)<br />
Reg.<br />
RENFE<br />
G.L.<br />
RENFE<br />
FEVE Total EuskoTren Cer.<br />
RENFE<br />
Reg.<br />
RENFE<br />
G.L.<br />
RENFE<br />
FEVE Metro<br />
Bilbao<br />
Total EuskoTren Cer.<br />
RENFE<br />
Reg.<br />
RENFE<br />
G.L.<br />
RENFE<br />
FEVE Metro<br />
Bilbao<br />
Total EuskoTren Cer.<br />
RENFE<br />
Reg.<br />
RENFE<br />
G.L.<br />
RENFE<br />
FEVE Metro<br />
Bilbao<br />
Viajes Internos 36,8 46,4 6,6 0,2 10,0 100,0 30,7 47,3 0,8 0,5 5,0 15,6 100,0 30,5 45,7 1,0 0,1 5,8 16,9 100,0 30,3 46,2 0,9 0,1 5,6 16,9 100,0<br />
Viajes Originados 18,2 0,0 14,6 61,9 5,3 100,0 29,9 0,0 14,6 53,2 2,4 0,0 100,0 26,3 0,0 13,8 57,6 2,3 0,0 100,0 27,3 0,0 15,6 53,2 4,0 0,0 100,0<br />
Total viajes 34,2 41,0 7,1 8,5 9,3 100,0 30,7 44,3 1,7 3,8 4,8 14,6 100,0 30,2 42,6 1,8 4,0 5,6 15,8 100,0 30,1 43,3 1,9 3,4 5,5 15,9 100,0<br />
Fuente: E<strong>la</strong>boración propia a partir <strong>de</strong> <strong>la</strong> Imagen Final <strong>de</strong> <strong>la</strong> Demanda 1995, 2001 y <strong>actual</strong>ización 2002 y 2003.<br />
8 En el año 1995 se consi<strong>de</strong>ra el número <strong>de</strong> personas que viajan en el día medio <strong>la</strong>borable, mientras que en los años 2001, 2002 y 2003 es en el día medio anual.<br />
Revisión <strong>de</strong>l Segundo P<strong>la</strong>n General <strong>de</strong> Carreteras <strong>de</strong>l País Vasco<br />
Total
La <strong>de</strong>manda <strong>de</strong> viajeros por ferrocarril ha aumentado un 17,5% en el período 1995 – 2003 (64.967 viajeros<br />
diarios en 2003 frente a 55.291 viajeros diarios en 1995), lo que equivale a una tasa anual <strong>de</strong> crecimiento <strong>de</strong>l<br />
2,0%. Este incremento es imputable únicamente a los viajes interiores al País Vasco, ya que los exteriores han<br />
disminuido ligeramente en dicho período.<br />
La evolución <strong>de</strong> <strong>la</strong> <strong>de</strong>manda <strong>de</strong> viajeros ferroviarios presenta una ten<strong>de</strong>ncia <strong>de</strong>creciente en el período 2001 -<br />
2003, observándose un <strong>de</strong>scenso medio anual <strong>de</strong>l 3%. Mientras en el período 1995 – 2001 esta ten<strong>de</strong>ncia<br />
<strong>de</strong>creciente se constataba únicamente en los viajes exteriores a <strong>la</strong> CAPV, entre 2001 y 2003 el <strong>de</strong>scenso afecta<br />
también a los viajes interiores.<br />
En el modo ferroviario, <strong>la</strong> mayor parte <strong>de</strong> los viajes realizados son viajes internos; en el año 2003, representan el<br />
93,8% <strong>de</strong> los viajes por ferrocarril, valor muy simi<strong>la</strong>r al correspondiente a 2001, en que el porcentaje <strong>de</strong> viajes<br />
internos fue <strong>de</strong>l 93,6%. Ambos valores son muy superiores al <strong>de</strong>l año 1995 (88,4% <strong>de</strong> los viajes por ferrocarril).<br />
Por el contrario, los viajes con origen y / o <strong>de</strong>stino el País Vasco canalizados por el modo ferroviario han<br />
disminuido en el período 1995 - 2003, con un ritmo <strong>de</strong> <strong>de</strong>crecimiento medio anual <strong>de</strong>l 2,2%.<br />
Atendiendo a <strong>la</strong> compañía operadora <strong>de</strong> los servicios, Cercanías RENFE y EuskoTren son <strong>la</strong>s más utilizadas por los<br />
viajeros: en el año 2003 los usuarios <strong>de</strong> estos servicios representan el 46,2% y el 30,3%, respectivamente, <strong>de</strong>l<br />
total <strong>de</strong> viajes internos. En 1995 <strong>la</strong> <strong>situación</strong> <strong>de</strong> prevalencia <strong>de</strong> estos operadores era idéntica, aunque con cuotas<br />
<strong>de</strong> mercado superiores a <strong>la</strong>s <strong>de</strong> 2003: concretamente Cercanías RENFE canalizaba el 46,4% <strong>de</strong> <strong>la</strong> <strong>de</strong>manda<br />
interna y EuskoTren el 36,8%.<br />
Respecto a los viajes con origen y / o <strong>de</strong>stino el País Vasco, los principales operadores son Gran<strong>de</strong>s Líneas RENFE<br />
(53,2% <strong>de</strong> los viajes originados en 2003) y EuskoTren (27,3%), <strong>situación</strong> que se mantiene <strong>de</strong>s<strong>de</strong> el año 1995<br />
(Gran<strong>de</strong>s Líneas RENFE, 61,9% <strong>de</strong> los viajes; y EuskoTren, 18,2%).<br />
Por otra parte, es importante <strong>de</strong>stacar <strong>la</strong> incorporación <strong>de</strong>l Metro <strong>de</strong> Bilbao, que en el año 2003 llega a superar los<br />
10.300 viajes; es <strong>de</strong>cir, el 15,9% <strong>de</strong> los viajes canalizados por el modo ferroviario en el País Vasco (14,6% en el<br />
año 2001).<br />
<strong>2.</strong>3.3.1. Euskotren<br />
Actualmente, EuskoTren cuenta con tres líneas (tras <strong>la</strong> incorporación en noviembre <strong>de</strong> 1995 <strong>de</strong> <strong>la</strong> línea Bilbao –<br />
Plentzia al Metro <strong>de</strong> Bilbao). Éstas son: Deusto – Lezama (<strong>de</strong> carácter exclusivamente intracomarcal); Bilbao –<br />
Bermeo y Bilbao – Hendaia (prestan, a<strong>de</strong>más servicios intercomarcales y, en el caso <strong>de</strong> <strong>la</strong> última, servicio<br />
internacional).<br />
En conjunto (viajes intra e intercomarcales, e internacionales), han canalizado un total <strong>de</strong> 17.90<strong>2.</strong>544 viajeros en<br />
el año 2003 (19.279.483 viajeros en 2001), lo que significa en el día medio anual un volumen <strong>de</strong> 49.048 viajeros<br />
(5<strong>2.</strong>821 viajeros en 2001). Se observa, por tanto, una ten<strong>de</strong>ncia a <strong>la</strong> baja <strong>de</strong>s<strong>de</strong> 2001.<br />
La línea Bilbao – Hendaia canaliza en 2003 el 73,5% <strong>de</strong> <strong>la</strong> <strong>de</strong>manda total <strong>de</strong> EuskoTren (<strong>la</strong> misma cuota que en<br />
2001); es <strong>la</strong> línea <strong>de</strong> mayor amplitud geográfica ya que une Bizkaia y Gipuzkoa con Hendaia. Por su parte, <strong>la</strong>s<br />
líneas <strong>de</strong> Bilbao – Bermeo y Deusto – Lezama han movido en 2003 porcentajes simi<strong>la</strong>res 13,5% y 13,0%,<br />
respectivamente, <strong>de</strong>l total <strong>de</strong> viajes canalizados por este operador (12,2% y 14,3%, respectivamente, en el año<br />
2001).<br />
Con respecto al crecimiento que estas líneas han experimentado en el período 1995 -2001, <strong>la</strong> línea Bilbao –<br />
Bermeo y <strong>la</strong> línea Deusto – Lezama han crecido, respectivamente, un 35,0% y un 30,0%. La línea Bilbao –<br />
Hendaia no es comparable puesto que en año 1995 estaba <strong>de</strong>sdob<strong>la</strong>da (Bilbao – Donostia-San Sebastián y<br />
Donostia-San Sebastián – Hendaia) <strong>de</strong> modo que los viajeros que hacían trasbordo eran contabilizados dos veces.<br />
Des<strong>de</strong> 2001 hasta 2003, <strong>la</strong>s líneas Bilbao – Hendaia y Deusto – Lezama presentan una ten<strong>de</strong>ncia <strong>de</strong>creciente, más<br />
acusada en esta última (disminuyendo en dicho período un 7,2% y un 15,9%, respectivamente); por el contrario,<br />
<strong>la</strong> línea Bilbao – Bermeo presenta un comportamiento muy irregu<strong>la</strong>r pues si entre 2002 y 2001 cayó un 4,0%,<br />
entre 2003 y 2002 ganó ese mismo porcentaje.<br />
En 2003, el 93,0% <strong>de</strong> los viajeros <strong>de</strong> EuskoTren se mueven <strong>de</strong>ntro <strong>de</strong>l mismo Territorio Histórico (ya sea Bizkaia o<br />
Gipuzkoa). En re<strong>la</strong>ción con los datos <strong>de</strong> 2001, se observa una ligera ganancia <strong>de</strong> peso <strong>de</strong> los viajes interiores a<br />
Bizkaia en el conjunto <strong>de</strong> <strong>la</strong> <strong>de</strong>manda <strong>de</strong> EuskoTren. Éstos han crecido a un ritmo medio <strong>de</strong>l 3,4% anual. En<br />
cambio, <strong>la</strong> <strong>de</strong>manda entre Bizkaia y Gipuzkoa ha <strong>de</strong>crecido a un ritmo <strong>de</strong>l 7,0% anual.<br />
Consi<strong>de</strong>rando los viajes que exce<strong>de</strong>n el ámbito comarcal, los viajeros que utilizaron EuskoTren en 2003<br />
ascendieron a 19.557 (un 2,3% menos que en el año 2001). La línea Bilbao – Hendaia, es <strong>la</strong> línea que más<br />
viajeros mueve (16.098 viajeros diarios en 2003, lo que representa el 82,0% <strong>de</strong> los viajeros intercomarcales <strong>de</strong><br />
este operador). En el año 2001, los viajeros intercomarcales que utilizaron EuskoTren fueron 21.156 viajeros / día.<br />
Respecto a <strong>la</strong> línea Bilbao – Hendaia, su <strong>de</strong>manda ascendió a 17.579 viajeros diarios, el 83,0% <strong>de</strong> los viajeros<br />
intercomarcales <strong>de</strong> EuskoTren.<br />
<strong>2.</strong>3.3.<strong>2.</strong> RENFE<br />
Cercanías RENFE<br />
RENFE presta servicios <strong>de</strong> Cercanías en <strong>la</strong> CAPV:<br />
√ Núcleo <strong>de</strong> Bilbao<br />
• C1: Bilbao – Santurtzi.<br />
• C2: Bilbao – Muskiz.<br />
• C3: Bilbao – Orduña.<br />
259<br />
Revisión <strong>de</strong>l Segundo P<strong>la</strong>n General <strong>de</strong> Carreteras <strong>de</strong>l País Vasco
√ Núcleo <strong>de</strong> Donostia-San Sebastián<br />
• Irun – Brinko<strong>la</strong>.<br />
En 2003 Cercanías transportó 90.744 viajeros diarios, <strong>red</strong>uciéndose en un 3,5% con respecto al año anterior; en<br />
2002 se registró una <strong>de</strong>manda diaria <strong>de</strong> 94.048 viajeros, lo que representa un retroceso <strong>de</strong>l 6,4% con respecto a<br />
2001.<br />
El conjunto <strong>de</strong> <strong>la</strong> <strong>de</strong>manda <strong>de</strong> Cercanías en el País Vasco ha <strong>de</strong>crecido <strong>de</strong>s<strong>de</strong> 2001 a un ritmo medio <strong>de</strong>l 4,9%. Se<br />
invierte así <strong>la</strong> ten<strong>de</strong>ncia observada entre 1995 y 2001, en que <strong>la</strong> <strong>de</strong>manda <strong>de</strong> cercanías creció a un ritmo medio<br />
anual <strong>de</strong>l 2,0%.<br />
Respecto al período 2001 – 2003, el núcleo <strong>de</strong> Bizkaia, que aglutina en torno al 75% <strong>de</strong> <strong>la</strong> <strong>de</strong>manda <strong>de</strong> Cercanías<br />
en el País Vasco, es el principal responsable <strong>de</strong> esta caída, y más concretamente <strong>la</strong>s líneas Bilbao - Santurtzi y<br />
Bilbao - Orduña, cuya <strong>de</strong>manda ha <strong>de</strong>crecido a un ritmo medio <strong>de</strong>l 9,6 y 6,0% anual respectivamente. Por el<br />
contrario, <strong>la</strong> línea Bilbao - Muskiz, lo mismo que <strong>la</strong> línea guipuzcoana Irán - Brinko<strong>la</strong> cayeron ligeramente en 2002<br />
y crecieron también <strong>de</strong> forma ligera en 2003.<br />
En 2003, los viajes intercomarcales han crecido un 3,4%, a pesar <strong>de</strong> <strong>la</strong> disminución registrada en <strong>la</strong> <strong>de</strong>manda<br />
total. Sin embargo ha sido en 2002 cuando se ha producido el mayor <strong>de</strong>scenso en el número <strong>de</strong> viajes <strong>de</strong> carácter<br />
intercomarcal, con una caída <strong>de</strong>l 11,0%.<br />
Regionales RENFE<br />
La mayor parte <strong>de</strong> <strong>la</strong> oferta regional <strong>de</strong> RENFE <strong>la</strong> constituyen los servicios entre Irun y Vitoria-Gasteiz, llegando<br />
algunos <strong>de</strong> ellos a Miranda <strong>de</strong> Ebro y otros a Burgos. Existen a<strong>de</strong>más servicios entre Burgos y Pamplona, pasando<br />
por Vitoria-Gasteiz, y otros entre Vitoria y Zaragoza, pasando por Pamplona. Por último, existen servicios entre<br />
Madrid y Vitoria-Gasteiz.<br />
El número total <strong>de</strong> viajeros que han utilizado en el año 2003 los servicios Regionales, tanto viajes internos como<br />
originados, han sido <strong>de</strong> 516.252 viajeros anuales (1.414 en el día medio), frente a los 499.878 viajeros <strong>de</strong>l año<br />
2002 (1.370 viajeros / día medio) y los 52<strong>2.</strong>938 <strong>de</strong>l año 2001 (1.433 viajeros diarios). Entre 2002 y 2003 <strong>la</strong><br />
<strong>de</strong>manda creció un 3,3%, mientras que entre 2002 y 2001 se produjo un <strong>de</strong>scenso <strong>de</strong>l 4,4%.<br />
Entre 1995 y 2001, <strong>la</strong> <strong>de</strong>manda <strong>de</strong> servicios regionales sufrió una caída espectacu<strong>la</strong>r, <strong>red</strong>uciéndose a menos <strong>de</strong> <strong>la</strong><br />
tercera parte. Des<strong>de</strong> 2001, <strong>la</strong> ten<strong>de</strong>ncia general es ligeramente <strong>de</strong>creciente (como se ha indicado anteriormente,<br />
<strong>la</strong> <strong>de</strong>manda registrada en 2003 es ligeramente inferior a <strong>la</strong> registrada en 2001).<br />
Respecto a los viajes que exce<strong>de</strong>n el ámbito comarcal (intercomarcales y exteriores), en 2003 se movieron 1.204<br />
viajeros al día, frente a los 1.169 <strong>de</strong>l año anterior y los 1.188 <strong>de</strong>l año 2001.<br />
Los viajes intercomarcales han crecido, en el período 2001 – 2003, a un ritmo medio <strong>de</strong>l 0,1% anual y los<br />
exteriores han <strong>de</strong>crecido al 0,9% anual. Éstos últimos son los que presentan <strong>la</strong> curva evolutiva más irregu<strong>la</strong>r,<br />
puesto que <strong>de</strong>spués <strong>de</strong> caer un 7,9% en 2002 crecieron un 6,7% en 2003.<br />
La estructura espacial <strong>de</strong> <strong>la</strong> <strong>de</strong>manda <strong>de</strong> Regionales <strong>de</strong> RENFE apenas ha experimentado cambios <strong>de</strong>s<strong>de</strong> el año<br />
2001. Si bien los viajes exteriores y los interiores a Á<strong>la</strong>va perdieron peso en 2002, lo recuperaron en 2003.<br />
Gran<strong>de</strong>s Líneas RENFE<br />
La <strong>de</strong>manda <strong>de</strong> trenes <strong>de</strong> <strong>la</strong>rgo recorrido <strong>de</strong> RENFE en el País Vasco en 2003 supuso 808.503 viajeros anuales, <strong>de</strong><br />
los cuales un 97,2% correspon<strong>de</strong>n a viajes externos a <strong>la</strong> CAPV y el resto a los viajes interiores. En 2002,<br />
totalizaron 930.411 viajeros anuales, con un 96,7% <strong>de</strong> viajes externos y un 3,4% <strong>de</strong> viajes internos.<br />
En lo re<strong>la</strong>tivo a <strong>la</strong> <strong>de</strong>manda <strong>de</strong> transporte diaria, en el año 2002 Gran<strong>de</strong>s Líneas transportó <strong>2.</strong>549 viajeros diarios,<br />
un 3,3% menos que en 2001. En 2003 <strong>la</strong> caída fue aún mayor, situándose en <strong>2.</strong>215 viajeros (un 13,1% menos<br />
que en el año anterior). Esta ten<strong>de</strong>ncia <strong>de</strong>creciente se observa <strong>de</strong>s<strong>de</strong> 1995: entre 1995 y 2001 <strong>la</strong> <strong>de</strong>manda cayó a<br />
un ritmo medio anual <strong>de</strong>l 2,7%.<br />
Este <strong>de</strong>scenso fue especialmente relevante en los viajes interiores al País Vasco (una fracción muy pequeña con<br />
respecto al total) y que, paradójicamente, se habían triplicado entre 1995 y 2001. Los viajes internos han perdido<br />
cuota con respecto a 2001. En 2002 ésta era <strong>de</strong>l 3,3% y en 2003 <strong>de</strong>l 2,8%.<br />
Los externos, que entre 1995 y 2001 habían <strong>de</strong>scendido a un ritmo <strong>de</strong>l 4,0% <strong>de</strong> media anual, crecieron un 5,4%<br />
en 2002, pero en 2003 cayeron un 12,6%. En lo que a viajes externos se refiere, Gipuzkoa ha pasado a ser el<br />
Territorio Histórico que más viajeros mueve con el resto <strong>de</strong> España en trenes <strong>de</strong> <strong>la</strong>rgo recorrido <strong>de</strong> RENFE.<br />
En 2003, <strong>la</strong>s principales re<strong>la</strong>ciones <strong>de</strong> <strong>la</strong> CAPV con el exterior son<br />
√ Á<strong>la</strong>va: Castil<strong>la</strong> y León, Madrid y Galicia y Cataluña.<br />
√ Bizkaia: Castil<strong>la</strong> y León, Cataluña y Madrid.<br />
√ Gipuzkoa: Madrid, Castil<strong>la</strong> y León y Cataluña.<br />
Los resultados reproducen <strong>la</strong> configuración <strong>de</strong> los servicios <strong>de</strong> <strong>la</strong>rgo recorrido, y sus correspon<strong>de</strong>ncias con los<br />
servicios Regionales, <strong>de</strong> manera que son más abundantes los viajes con Madrid y Castil<strong>la</strong> y León que con Navarra<br />
y Aragón, estás última conectadas directamente con los servicios Regionales.<br />
En cualquier caso, y <strong>de</strong> forma generalizada, se observa <strong>de</strong>s<strong>de</strong> 2001 un <strong>de</strong>scenso <strong>de</strong> <strong>la</strong>s re<strong>la</strong>ciones principales:<br />
Castil<strong>la</strong> y León, Madrid y Cataluña.<br />
260<br />
Revisión <strong>de</strong>l Segundo P<strong>la</strong>n General <strong>de</strong> Carreteras <strong>de</strong>l País Vasco
<strong>2.</strong>3.3.3. FEVE<br />
FEVE ha movido en el año 2003 un total <strong>de</strong> 1.970.974 viajeros, equivalentes a 5.300 viajeros al día. La <strong>de</strong>manda<br />
registrada en el año 2002 (5.400 viajeros / día) representa un 3,4% más que en 2001. Por el contrario, en 2003 <strong>la</strong><br />
<strong>de</strong>manda ha disminuido un 2,0%.<br />
Si bien, <strong>la</strong> <strong>de</strong>manda registrada en 2003 es ligeramente superior a <strong>la</strong> registrada en 2001, el dato más reciente <strong>de</strong><br />
2003 parece apuntar hacia un cambio <strong>de</strong> signo en <strong>la</strong> ten<strong>de</strong>ncia creciente <strong>de</strong> <strong>la</strong> <strong>de</strong>manda <strong>de</strong> FEVE mantenida<br />
<strong>de</strong>s<strong>de</strong> 1995.<br />
Es en los viajes intracomarcales en los que se observa una evolución más negativa; éstos han <strong>de</strong>crecido <strong>de</strong>s<strong>de</strong><br />
2001 a un ritmo medio <strong>de</strong>l 3,8%. Por el contrario, los viajes externos, que en 2002 cayeron en un 3,6%, crecieron<br />
en 2003 un 61,2% en 2003, <strong>de</strong>bido a <strong>la</strong> ampliación <strong>de</strong> los servicios <strong>de</strong> FEVE hacia Burgos, Palencia y León.<br />
Gracias a ello, <strong>la</strong> cuota <strong>de</strong> los viajes externos en el total <strong>de</strong> <strong>la</strong> <strong>de</strong>manda <strong>de</strong> FEVE en el País Vasco alcanzó en 2003<br />
el 3,1%, cuando en 2001 era <strong>de</strong>l 2,0% y en 2002 <strong>de</strong>l 1,9%.<br />
<strong>2.</strong>3.3.4. Metro <strong>de</strong> Bilbao<br />
El Metro <strong>de</strong> Bilbao entró en servicio a finales <strong>de</strong> 1995, por lo que el <strong>análisis</strong> <strong>de</strong> <strong>la</strong> movilidad en este modo<br />
únicamente pue<strong>de</strong> hacerse para los años 2001, 2002 y 2003.<br />
El Metro <strong>de</strong> Bilbao movió en el año 2003 un total <strong>de</strong> 7<strong>2.</strong>609.409 viajeros, <strong>de</strong> los cuales 68.847.385 correspon<strong>de</strong>n<br />
a viajeros intracomarcales y los restantes 3.76<strong>2.</strong>024 a intercomarcales (algo más <strong>de</strong>l 5% <strong>de</strong>l total). En el año<br />
2002, transportó un total <strong>de</strong> 66.705.562 <strong>de</strong> viajeros, <strong>de</strong> los que 63.034.437 fueron viajeros intracomarcales y<br />
3.671.125 intercomarcales.<br />
Respecto a los viajeros diarios transportados (intra e intercomarcales), en el año 2002 ascendieron a 18<strong>2.</strong>755, un<br />
19,3% más que en el año anterior. En 2003, se movieron 198.930 viajeros al día, que supone un 9,0% más que<br />
en 200<strong>2.</strong> En conclusión, <strong>la</strong> <strong>de</strong>manda está creciendo a un ritmo <strong>de</strong>l 14,0% <strong>de</strong> media anual.<br />
No obstante, si se consi<strong>de</strong>ran únicamente los viajes que exce<strong>de</strong>n el ámbito <strong>de</strong> <strong>la</strong> comarca, éstos presentan un<br />
ritmo <strong>de</strong> crecimiento más mo<strong>de</strong>rado; <strong>de</strong> hecho, en el año 2002 <strong>de</strong>crecieron un 0,2%, si bien en 2003 volvieron a<br />
crecer un 2,5%.<br />
Las estaciones más importantes, por ser <strong>la</strong> que mayor número <strong>de</strong> viajeros mueven son <strong>la</strong>s <strong>de</strong> Abando y Casco<br />
Viejo (con más <strong>de</strong> 28.000 viajeros diarios) y <strong>la</strong>s <strong>de</strong> Santutxu, Moyúa, Indautxu, San Mamés y Deusto (con más <strong>de</strong><br />
20.000 viajeros diarios), todas el<strong>la</strong>s en Bilbao.<br />
<strong>2.</strong>3.4 Transporte aéreo<br />
En el año 2003 los aeropuertos <strong>de</strong>l País Vasco (Foronda, Loiu y Hondarribia) movieron un total <strong>de</strong> 3.216.777<br />
pasajeros, <strong>de</strong> los cuales <strong>2.</strong>337.332 son domésticos (72,7%) y 879.445 son internacionales (27,3%). Si se<br />
consi<strong>de</strong>ran los tránsitos, los viajeros <strong>de</strong>l modo aéreo ascien<strong>de</strong>n a 3.225.245 anuales, <strong>de</strong> los que 8.468 son <strong>de</strong><br />
tránsito.<br />
Si se compara con los datos <strong>de</strong> 2001, los aeropuertos vascos movieron <strong>2.</strong>870.427 pasajeros anuales, <strong>de</strong> los cuales<br />
<strong>2.</strong>07<strong>2.</strong>213 correspondieron a viajeros nacionales -72,2%- y 798.214 a internacionales -27,8%. Si se consi<strong>de</strong>ran los<br />
viajeros en tránsito, el tráfico aéreo transportó un total <strong>de</strong> <strong>2.</strong>887.164 viajeros en dicho año 2001, <strong>de</strong> los que<br />
16.737 fueron viajeros en tránsito.<br />
En 1995, se totalizaron 1.716.322 pasajeros anuales, <strong>de</strong> los que 1.374.893 fueron viajeros nacionales -80,0%-, y<br />
341.429 viajeros internacionales -20,0%.<br />
El tráfico aéreo <strong>de</strong> viajeros ha crecido un 64,7% entre 1995 y 2003, a un ritmo <strong>de</strong>l 6,4% anual. Mientras el tráfico<br />
doméstico ha crecido prácticamente un 50%, a un ritmo <strong>de</strong>l 5,1% anual, el tráfico internacional ha experimentado<br />
en el período 1995 – 2003 un incremento <strong>de</strong>l 125,6%, equivalente a una tasa <strong>de</strong> crecimiento medio anual <strong>de</strong>l<br />
10,7%.<br />
Analizando el período 2001 – 2003, el tráfico aéreo ha crecido a un ritmo <strong>de</strong>l 5,7% anual, tras remontar en 2003<br />
<strong>la</strong> caída registrada en el año anterior (consecuencia <strong>de</strong>l impacto que en el tráfico aéreo produjo el atentado <strong>de</strong>l<br />
11-S), recuperando así <strong>la</strong> ten<strong>de</strong>ncia c<strong>la</strong>ramente alcista observada entre 1995 y 2001, período en que el ritmo <strong>de</strong><br />
crecimiento medio anual fue <strong>de</strong>l 6,7%.<br />
261<br />
Revisión <strong>de</strong>l Segundo P<strong>la</strong>n General <strong>de</strong> Carreteras <strong>de</strong>l País Vasco
Naturaleza <strong>de</strong>l<br />
viaje<br />
DEMANDA DE TRANSPORTE DE VIAJEROS EN LOS AEROPUERTOS DE LA CAPV<br />
Viajeros / día <strong>la</strong>borable medio (año 1995) Viajeros / día medio (año 2001) Viajeros / día medio (año 2002) Viajeros / día medio (año 2003)<br />
Á<strong>la</strong>va Bizkaia Gipuzkoa Total Á<strong>la</strong>va Bizkaia Gipuzkoa Total Á<strong>la</strong>va Bizkaia Gipuzkoa Total Á<strong>la</strong>va Bizkaia Gipuzkoa Total<br />
Doméstico 549 3.351 397 4.297 290 4.636 751 5.677 242 4.618 727 5.587 251 5.394 758 6.403<br />
Internacional 42 1.023 3 1.068 58 <strong>2.</strong>128 2 <strong>2.</strong>188 27 <strong>2.</strong>084 1 <strong>2.</strong>112 23 <strong>2.</strong>384 2 <strong>2.</strong>409<br />
Tránsito - - - - - - - - 1 34 0 35 1 22 0 23<br />
Total 591 4.374 400 5.365 348 6.767 753 7.865 270 6.736 728 7.734 275 7.800 760 8.835<br />
Naturaleza <strong>de</strong>l<br />
viaje<br />
Fuente: E<strong>la</strong>boración propia a partir <strong>de</strong> <strong>la</strong> Imagen Final <strong>de</strong> <strong>la</strong> Demanda 1995, 2001 y <strong>actual</strong>ización 2002 y 2003.<br />
DISTRIBUCIÓN DEL TRANSPORTE ÁEREO DE PASAJEROS DEL PAÍS VASCO<br />
% (año 1995) % (año 2001) % (año 2002) % (año 2003)<br />
Á<strong>la</strong>va Bizkaia Gipuzkoa Total Á<strong>la</strong>va Bizkaia Gipuzkoa Total Á<strong>la</strong>va Bizkaia Gipuzkoa Total Á<strong>la</strong>va Bizkaia Gipuzkoa Total<br />
Doméstico 12,78 77,98 9,24 100,00 5,11 81,66 13,23 100,00 4,33 82,66 13,01 100,00 3,92 84,24 11,84 100,00<br />
Internacional 3,93 95,79 0,28 100,00 2,65 97,26 0,09 100,00 1,28 98,67 0,05 100,00 0,95 98,96 0,08 100,00<br />
Tránsito - - - - - - - - 2,86 97,14 0,00 100,00 4,35 95,65 0,00 100,00<br />
Total 11,02 81,53 7,46 100,00 4,42 86,04 9,57 100,00 3,49 87,10 9,41 100,00 3,11 88,29 8,60 100,00<br />
Fuente: E<strong>la</strong>boración propia a partir <strong>de</strong> <strong>la</strong> Imagen Final <strong>de</strong> <strong>la</strong> Demanda 1995, 2001 y <strong>actual</strong>ización 2002 y 2003.<br />
262<br />
Revisión <strong>de</strong>l Segundo P<strong>la</strong>n General <strong>de</strong> Carreteras <strong>de</strong>l País Vasco
El aeropuerto <strong>de</strong> Loiu (Bizkaia) canaliza en el año 2003 el 88,3% <strong>de</strong> <strong>la</strong> <strong>de</strong>manda, frente a un 8,6% <strong>de</strong><br />
Hondarribia y un 3,1% <strong>de</strong> Foronda.<br />
Des<strong>de</strong> el año 1995 el aeropuerto <strong>de</strong> Hondarribia ha experimentado un importante incremento en su<br />
tráfico, un 117,5% en el período 1995 - 2003 (ha pasado <strong>de</strong> 127.655 viajeros y una cuota <strong>de</strong>l 7,4% en<br />
1995 a los <strong>actual</strong>es 277.637 pasajeros y <strong>la</strong> cuota antes citada <strong>de</strong>l 8,6%). Respecto al aeropuerto <strong>de</strong><br />
Bizkaia, también se aprecia un importante incremento <strong>de</strong>l conjunto <strong>de</strong>l tráfico <strong>de</strong> viajeros, un 103,4% en<br />
el período <strong>de</strong> <strong>análisis</strong>. Por el contrario, el aeropuerto <strong>de</strong> Foronda ha visto disminuir su tráfico <strong>de</strong> viajeros<br />
un 46,8% en dicho período.<br />
Por lo que respecta a <strong>la</strong> distribución espacial <strong>de</strong> los viajes, <strong>la</strong>s principales re<strong>la</strong>ciones geográficas <strong>de</strong>l País<br />
Vasco en modo aéreo se han mantenido estables en el período 1995 – 2001. Éstas son:<br />
%<br />
80<br />
70<br />
60<br />
50<br />
40<br />
30<br />
20<br />
10<br />
0<br />
34,9<br />
33,4<br />
Origen / Destino <strong>de</strong> los viajeros<br />
26,7<br />
18,8<br />
17,3<br />
13,5<br />
10,3<br />
Madrid Europa Barcelona Canarias Baleares<br />
5,4<br />
Año 1995 Año 2001<br />
Fuente: E<strong>la</strong>boración propia<br />
Durante los dos últimos años (2002 y 2003) han ganado peso <strong>la</strong>s re<strong>la</strong>ciones con los países <strong>de</strong> <strong>la</strong> Unión<br />
Europea, en especial con los adscritos al acuerdo <strong>de</strong> Schengen. Este efecto es atribuible, casi en<br />
exclusividad, al aeropuerto <strong>de</strong> Bizkaia que soporta más <strong>de</strong>l 85,0% <strong>de</strong>l tráfico aéreo internacional, aunque<br />
también se observa en los otros dos aeropuertos.<br />
Respecto a <strong>la</strong> evolución <strong>de</strong>l motivo <strong>de</strong> viaje en el período 1995 – 2001 (últimos años para los que existen<br />
datos disponibles) cabe indicar que, para el conjunto <strong>de</strong> los aeropuertos vascos, el trabajo sigue siendo el<br />
motivo principal <strong>de</strong> viaje, tanto en vuelos nacionales como en internacionales (ha incrementado su cuota<br />
en más <strong>de</strong> 20 puntos en este período, pasando <strong>de</strong> un 51% en 1995 al 71% en el año 2001), seguido por<br />
el motivo ocio (que ha disminuido 11 puntos en el período <strong>de</strong> <strong>análisis</strong>, siendo <strong>de</strong> un 23% en el año 2001).<br />
4,4<br />
9,4<br />
Respecto al modo <strong>de</strong> acceso / dispersión a los aeropuertos vascos, el vehículo privado es el modo mayoritario en sus<br />
distintas modalida<strong>de</strong>s (alquiler, propio, acompañante), con más <strong>de</strong> un 50% <strong>de</strong> los viajes en 2001, excepto en Foronda. Le<br />
sigue el taxi, con un 30%. Cabe indicar que únicamente en Vitoria el autobús cobra protagonismo, ya que presenta una<br />
cuota <strong>de</strong> mercado <strong>de</strong>l 27%. Esta <strong>situación</strong> se mantiene estable <strong>de</strong>s<strong>de</strong> 1995.<br />
263<br />
Revisión <strong>de</strong>l Segundo P<strong>la</strong>n General <strong>de</strong> Carreteras <strong>de</strong>l País Vasco
<strong>2.</strong>4. LA MOVILIDAD EN LA RED FUNCIONAL DEL PAÍS VASCO<br />
Se han analizado <strong>la</strong>s distribuciones <strong>de</strong> los tráficos entre los diferentes itinerarios alternativos existentes<br />
para <strong>la</strong>s principales re<strong>la</strong>ciones origen – <strong>de</strong>stino en <strong>la</strong> <strong>red</strong> <strong>viaria</strong> <strong>de</strong>l País Vasco, consi<strong>de</strong>rándose tanto los<br />
tráficos internos al País Vasco, y los que tienen su origen o <strong>de</strong>stino fuera <strong>de</strong>l mismo, como los exteriores<br />
al País Vasco pero que en su tránsito por este territorio utilizan <strong>la</strong> Red Funcional.<br />
Las bases documentales empleadas en el <strong>análisis</strong> han sido <strong>la</strong>s encuestas <strong>de</strong> carretera realizadas por el<br />
Gobierno Vasco para los estudios <strong>de</strong> “Imagen Final <strong>de</strong> <strong>la</strong> Demanda <strong>de</strong> Transporte en el País Vasco”<br />
correspondientes a los años 1995 y 2001.<br />
Las principales re<strong>la</strong>ciones <strong>de</strong>tectadas son <strong>la</strong>s siguientes:<br />
1. A.F. Balmaseda - Zal<strong>la</strong> Bilbao Metropolitano<br />
2 A.F. Beasain - Zumarraga Arrasate - Bergara<br />
Donostia-San Sebastián<br />
3. A.F. Bilbao Metropolitano Cornisa Cantábrica<br />
Durango<br />
Balmaseda - Zal<strong>la</strong><br />
Donostia-San Sebastián<br />
Mungia<br />
Llodio<br />
Vitoria-Gasteiz<br />
Eibar<br />
Gernika<br />
Madrid<br />
4. A.F. Donostia-San Sebastián Francia y Resto U.E.<br />
Zarautz - Azpeitia<br />
Navarra<br />
5. A.F. Durango Bilbao Metropolitano<br />
7. A.F. Gernika Bilbao Metropolitano<br />
8. A.F. Igorre Bilbao Metropolitano<br />
10. A.F. Llodio Bilbao Metropolitano<br />
11. A.F. Arrasate - Bergara Beasain - Zumarraga<br />
Donostia-San Sebastián<br />
Vitoria-Gasteiz<br />
1<strong>2.</strong> A.F. Mungia Bilbao Metropolitano<br />
13. A.F. Tolosa Donostia-San Sebastián<br />
14. A.F. Vitoria-Gasteiz Bilbao Metropolitano<br />
Arrasate - Bergara<br />
Navarra<br />
Burgos<br />
Beasain - Zumarraga<br />
Donostia-San Sebastián<br />
15. A.F. Zarautz - Azpeitia Donostia-San Sebastián<br />
Navarra Donostia-San Sebastián<br />
Vitoria-Gasteiz<br />
Europa<br />
Castil<strong>la</strong> - León Vitoria-Gasteiz<br />
Bilbao Metropolitano<br />
Donostia-San Sebastián<br />
La Rioja Vitoria-Gasteiz<br />
Bilbao Metropolitano<br />
Donostia-San Sebastián<br />
Cataluña Cornisa Cantábrica<br />
Vitoria-Gasteiz<br />
Donostia-San Sebastián<br />
Bilbao Metropolitano<br />
Comunidad Valenciana Bilbao Metropolitano<br />
Donostia-San Sebastián<br />
Madrid Bilbao Metropolitano<br />
Portugal Europa<br />
Francia Donostia-San Sebastián<br />
Burgos Vitoria-Gasteiz<br />
Bilbao Metropolitano<br />
A partir <strong>de</strong> <strong>la</strong>s explotaciones <strong>de</strong> <strong>la</strong>s encuestas realizadas se han obtenido los flujos <strong>de</strong> tráfico (vehículos ligeros, pesados y<br />
total) en los itinerarios interiores y exteriores a <strong>la</strong> CAPV en el día medio <strong>de</strong>l año 2001, así como <strong>la</strong>s matrivces O / D<br />
(ambos sentidos) para cada tipología <strong>de</strong> vehículo consi<strong>de</strong>rada.<br />
264<br />
Revisión <strong>de</strong>l Segundo P<strong>la</strong>n General <strong>de</strong> Carreteras <strong>de</strong>l País Vasco
ITINERARIOS INTERIORES A LA CAPV: FLUJOS DE TRÁFICO EN LA RED FUNCIONAL DE CARRETERAS<br />
DÍA MEDIO DEL AÑO 2001<br />
Origen Destino Itinerario Total Ligeros Total Pesados Total Vehículos Total Pasajeros Total Mercancías (Tn)<br />
Beasain - Zumarraga Vitoria-Gasteiz<br />
Bilbao Metropolitano<br />
Donostia-San Sebastián<br />
Donostia-San Sebastián<br />
Durango<br />
Igorre<br />
Mungia<br />
Vitoria-Gasteiz<br />
Bilbao Metropolitano<br />
Arrasate - Bergara<br />
Vitoria-Gasteiz<br />
N-I 585 89,1% 163 100,0% 748 91,3% 790 88,4% 1.106 100,0%<br />
GI-627 / N-636 72 10,9% 0 0,0% 72 8,7% 104 11,6% 0 0,0%<br />
Total 657 100,0% 163 100,0% 820 100,0% 894 100,0% 1.106 100,0%<br />
A-8 1.970 81,7% 476 62,7% <strong>2.</strong>446 77,2% 3.359 96,0% 4.050 59,9%<br />
N-634 441 18,3% 282 37,3% 724 22,8% 141 4,0% <strong>2.</strong>716 40,1%<br />
Total <strong>2.</strong>412 100,0% 758 100,0% 3.170 100,0% 3.500 100,0% 6.766 100,0%<br />
A-8 <strong>2.</strong>922 36,2% 216 15,3% 3.138 33,1% 3.498 36,6% 1.014 36,1%<br />
N-634 5.142 63,8% 1.191 84,7% 6.333 66,9% 6.057 63,4% 1.791 63,9%<br />
Total 8.064 100,0% 1.407 100,0% 9.471 100,0% 9.555 100,0% <strong>2.</strong>805 100,0%<br />
A-8 15 0,3% 0 0,0% 15 0,2% 17 0,3% 0 0,0%<br />
N-634 5.431 99,7% 472 100,0% 5.903 99,8% 6.628 99,7% 452 100,0%<br />
Total 5.446 100,0% 472 100,0% 5.918 100,0% 6.645 100,0% 452 100,0%<br />
BI-631 6.791 91,9% 352 92,1% 7.143 91,9% 9.466 94,1% 284 90,4%<br />
BI-634 414 5,6% 0 0,0% 414 5,3% 343 3,4% 0 0,0%<br />
BI-2122 0 0,0% 30 7,9% 30 0,4% 0 0,0% 30 9,6%<br />
BI-2704 182 2,5% 0 0,0% 182 2,3% 248 2,5% 0 0,0%<br />
Total 7.387 100,0% 382 100,0% 7.769 100,0% 10.058 100,0% 315 100,0%<br />
A-68 / N-622 3.873 87,6% 256 45,8% 4.128 82,9% 4.482 87,8% 3.535 51,1%<br />
N-240 550 12,4% 303 54,2% 852 17,1% 625 12,2% 3.376 48,9%<br />
Total 4.422 100,0% 558 100,0% 4.981 100,0% 5.106 100,0% 6.911 100,0%<br />
A-8 <strong>2.</strong>310 92,2% 467 84,1% <strong>2.</strong>777 90,7% 5.163 98,1% 3.262 98,8%<br />
N-634 196 7,8% 88 15,9% 284 9,3% 102 1,9% 40 1,2%<br />
Total <strong>2.</strong>506 100,0% 555 100,0% 3.061 100,0% 5.265 100,0% 3.302 100,0%<br />
N-634 / N-I 1.090 77,8% 0 0,0% 1.090 69,0% 1.098 73,4% 16 3,0%<br />
A-8 / GI-627 284 20,3% 18 10,2% 302 19,1% 358 24,0% 231 43,8%<br />
N-634 / GI-627 28 2,0% 160 89,8% 187 11,9% 40 2,7% 280 53,1%<br />
Total 1.402 100,0% 178 100,0% 1.579 100,0% 1.496 100,0% 526 100,0%<br />
N-I 981 88,4% 112 74,2% 1.093 86,7% 1.739 93,8% 538 96,1%<br />
N-622 / A-68 / A-8 8 0,7% 4 2,4% 11 0,9% 9 0,5% 22 3,9%<br />
N-240 / A-BI-623 / A-8 65 5,9% 0 0,0% 65 5,2% 77 4,1% 0 0,0%<br />
N-240 / A-BI-627 / A-8 0 0,0% 0 0,0% 0 0,0% 0 0,0% 0 0,0%<br />
N-I / N-240 / A-15 / N-I 24 2,2% 0 0,0% 24 1,9% 29 1,6% 0 0,0%<br />
N-240 / A-BI-623 / N-634 32 2,9% 35 23,3% 67 5,3% 0 0,0% 0 0,0%<br />
Total 1.110 100,0% 151 100,0% 1.261 100,0% 1.854 100,0% 561 100,0%<br />
265<br />
Revisión <strong>de</strong>l Segundo P<strong>la</strong>n General <strong>de</strong> Carreteras <strong>de</strong>l País Vasco
Origen Destino Itinerario Total Ligeros Total Pesados Total Vehículos Total Pasajeros Total Mercancías (Tn)<br />
Zarautz - Azpeitia<br />
Durango Bilbao Metropolitano<br />
Igorre Bilbao Metropolitano<br />
Arrasate - Bergara Donostia-San Sebastián<br />
Mungia Bilbao Metropolitano<br />
Vitoria-Gasteiz<br />
Beasain - Zumarraga<br />
Bilbao Metropolitano<br />
Donostia-San Sebastián<br />
Zarautz - Azpeitia Donostia-San Sebastián<br />
N-634 <strong>2.</strong>636 38,5% 255 61,9% <strong>2.</strong>891 39,8% 3.060 37,5% 1.732 81,7%<br />
A-8 4.123 60,1% 157 38,1% 4.280 58,9% 4.981 61,0% 388 18,3%<br />
N-I 96 1,4% 0 0,0% 96 1,3% 123 1,5% 0 0,0%<br />
Total 6.856 100,0% 412 100,0% 7.268 100,0% 8.164 100,0% <strong>2.</strong>120 100,0%<br />
A-8 <strong>2.</strong>670 33,1% 275 18,6% <strong>2.</strong>944 30,8% 3.254 32,9% 1.739 28,4%<br />
N-634 5.399 66,9% 1.204 81,4% 6.604 69,2% 6.637 67,1% 4.393 71,6%<br />
Total 8.069 100,0% 1.479 100,0% 9.548 100,0% 9.891 100,0% 6.132 100,0%<br />
A-8 0 0,0% 0 0,0% 0 0,0% 0 0,0% 0 0,0%<br />
N-634 5.515 100,0% 437 100,0% 5.952 100,0% 6.328 100,0% 5.372 100,0%<br />
Total 5.515 100,0% 437 100,0% 5.952 100,0% 6.328 100,0% 5.372 100,0%<br />
N-634 / N-I 799 60,9% 211 93,7% 1.011 65,7% 911 59,5% 1.450 100,0%<br />
A-8 / GI-627 464 35,3% 14 6,3% 478 31,1% 549 35,9% 0 0,0%<br />
N-634 / GI-627 50 3,8% 0 0,0% 50 3,2% 70 4,6% 0 0,0%<br />
Total 1.313 100,0% 225 100,0% 1.538 100,0% 1.530 100,0% 1.450 100,0%<br />
BI-631 6.985 92,9% 520 100,0% 7.505 93,4% 8.368 93,0% 989 100,0%<br />
BI-634 291 3,9% 0 0,0% 291 3,6% 365 4,1% 0 0,0%<br />
BI-2122 0 0,0% 0 0,0% 0 0,0% 0 0,0% 0 0,0%<br />
BI-2704 242 3,2% 0 0,0% 242 3,0% 261 2,9% 0 0,0%<br />
Total 7.518 100,0% 520 100,0% 8.038 100,0% 8.994 100,0% 989 100,0%<br />
N-I 599 100,0% 221 100,0% 820 100,0% 687 100,0% 849 100,0%<br />
GI-627 / N-636 0 0,0% 0 0,0% 0 0,0% 0 0,0% 0 0,0%<br />
Total 599 100,0% 221 100,0% 820 100,0% 687 100,0% 849 100,0%<br />
A-68 / N-622 4.289 95,3% 289 86,4% 4.577 94,7% 4.765 95,0% <strong>2.</strong>364 100,0%<br />
N-240 211 4,7% 45 13,6% 257 5,3% 250 5,0% 0 0,0%<br />
Total 4.500 100,0% 334 100,0% 4.834 100,0% 5.015 100,0% <strong>2.</strong>364 100,0%<br />
N-I 1.015 88,8% 145 91,3% 1.160 89,1% 990 88,2% 740 78,4%<br />
N-622 / A-68 / A-8 55 4,8% 14 8,7% 69 5,3% 65 5,8% 184 19,5%<br />
N-240 / A-BI-623 / A-8 43 3,7% 0 0,0% 43 3,3% 32 2,8% 21 2,2%<br />
N-240 / A-BI-627 / A-8 0 0,0% 0 0,0% 0 0,0% 0 0,0% 0 0,0%<br />
N-I / N-240 / A-15 / N-I 30 2,6% 0 0,0% 30 2,3% 36 3,2% 0 0,0%<br />
N-240 / A-BI-623 / N-634 0 0,0% 0 0,0% 0 0,0% 0 0,0% 0 0,0%<br />
Total 1.143 100,0% 159 100,0% 1.302 100,0% 1.122 100,0% 944 100,0%<br />
N-634 <strong>2.</strong>348 36,0% 631 75,3% <strong>2.</strong>978 40,4% <strong>2.</strong>973 28,5% 1.470 54,1%<br />
A-8 4.070 62,3% 207 24,7% 4.277 58,1% 7.333 70,2% 1.247 45,9%<br />
N-I 111 1,7% 0 0,0% 111 1,5% 136 1,3% 0 0,0%<br />
Total 6.529 100,0% 838 100,0% 7.366 100,0% 10.442 100,0% <strong>2.</strong>717 100,0%<br />
Fuente: Imagen Final <strong>de</strong> <strong>la</strong> Demanda <strong>de</strong> Transporte en el País Vasco 2001<br />
266<br />
Revisión <strong>de</strong>l Segundo P<strong>la</strong>n General <strong>de</strong> Carreteras <strong>de</strong>l País Vasco
ITINERARIOS EXTERIORES A LA CAPV: FLUJOS DE TRÁFICO EN LA RED FUNCIONAL DE CARRETERAS<br />
DÍA MEDIO DEL AÑO 2001<br />
Origen Destino Itinerario Total Ligeros Total Pesados Total Vehículos Total Pasajeros Total Mercancías (T)<br />
Vitoria-Gasteiz<br />
Donostia-San Sebastián<br />
Cornisa Cantábrica<br />
Europa<br />
La Rioja<br />
Navarra<br />
Valle <strong>de</strong>l Ebro<br />
Centro<br />
La Rioja<br />
Navarra<br />
N-622 / A-68 / A-8 221 72,9% 48 73,5% 269 73,0% 323 98,1% 64 10,0%<br />
N-240 / A-8 82 27,1% 17 26,5% 99 27,0% 6 1,9% 582 90,0%<br />
Total 303 100,0% 66 100,0% 369 100,0% 330 100,0% 647 100,0%<br />
N-622 / A-68 / A-8 0 0,0% 0 0,0% 0 0,0% 0 0,0% 0 0,0%<br />
N-240 / A-8 0 0,0% 0 0,0% 0 0,0% 0 0,0% 0 0,0%<br />
N-240 / GI-627 / A-8 0 0,0% 0 0,0% 0 0,0% 0 0,0% 0 0,0%<br />
N-I / A-8 101 100,0% 171 100,0% 271 100,0% 145 100,0% 3.288 100,0%<br />
Total 101 100,0% 171 100,0% 271 100,0% 145 100,0% 3.288 100,0%<br />
N-I / N-124 1.947 93,8% 39 19,1% 1.985 87,1% <strong>2.</strong>642 93,5% 345 100,0%<br />
A-2124 / A-124 0 0,0% 164 80,9% 164 7,2% 0 0,0% 0 0,0%<br />
N-I / A-132 129 6,2% 0 0,0% 129 5,7% 183 6,5% 0 0,0%<br />
Total <strong>2.</strong>076 100,0% 203 100,0% <strong>2.</strong>279 100,0% <strong>2.</strong>826 100,0% 345 100,0%<br />
N-I / A-240 <strong>2.</strong>354 68,0% 264 96,1% <strong>2.</strong>617 70,1% <strong>2.</strong>834 67,8% <strong>2.</strong>055 96,4%<br />
N-I / A-132 1.106 32,0% 11 3,9% 1.116 29,9% 1.348 32,2% 77 3,6%<br />
Total 3.459 100,0% 275 100,0% 3.734 100,0% 4.183 100,0% <strong>2.</strong>132 100,0%<br />
N-I / A-68 463 89,1% 0 0,0% 463 59,3% 600 87,9% 0 0,0%<br />
N-I / A-240 43 8,3% 258 98,7% 301 38,6% 63 9,2% 5.333 99,4%<br />
N-I / A-132 0 0,0% 0 0,0% 0 0,0% 0 0,0% 0 0,0%<br />
N-I / A-124 13 2,5% 3 1,3% 16 2,1% 19 2,8% 33 0,6%<br />
Total 519 100,0% 261 100,0% 780 100,0% 683 100,0% 5.366 100,0%<br />
A-8 / A-68 187 21,1% 72 19,5% 259 20,7% 160 15,7% 517 13,6%<br />
N-I 696 78,9% 298 80,5% 994 79,3% 862 84,3% 3.274 86,4%<br />
A-8 / GI-627 / N-240 / N-I 0 0,0% 0 0,0% 0 0,0% 0 0,0% 0 0,0%<br />
Total 883 100,0% 370 100,0% 1.252 100,0% 1.022 100,0% 3.791 100,0%<br />
N-I 143 67,7% 0 - 143 67,7% 216 69,0% 0 -<br />
A-15 por Estel<strong>la</strong> 66 31,1% 0 - 66 31,1% 94 30,0% 0 -<br />
A-8 / A-68 3 1,2% 0 - 3 1,2% 3 1,0% 0 -<br />
Total 212 100,0% 0 - 212 100,0% 313 100,0% 0 -<br />
A-8 / A-15 4.092 70,3% 385 100,0% 4.477 72,1% 4.880 69,4% 5.541 100,0%<br />
N-121-A 1.731 29,7% 0 0,0% 1.731 27,9% <strong>2.</strong>149 30,6% 0 0,0%<br />
Total 5.823 100,0% 385 100,0% 6.208 100,0% 7.029 100,0% 5.541 100,0%<br />
267<br />
Revisión <strong>de</strong>l Segundo P<strong>la</strong>n General <strong>de</strong> Carreteras <strong>de</strong>l País Vasco
Origen Destino Itinerario Total Ligeros Total Pesados Total Vehículos Total Pasajeros Total Mercancías (T)<br />
Bilbao Metropolitano<br />
Cornisa Cantábrica<br />
Valle <strong>de</strong>l Ebro<br />
Centro<br />
La Rioja<br />
Navarra<br />
Valle <strong>de</strong>l Ebro<br />
Vitoria-Gasteiz<br />
La Rioja<br />
A-8 / A-15 77 16,0% 0 0,0% 77 13,5% 99 14,5% 0 0,0%<br />
N-121-A 0 0,0% 89 100,0% 89 15,7% 0 0,0% 893 100,0%<br />
N-I 393 82,0% 0 0,0% 393 69,1% 573 83,6% 0 0,0%<br />
A-8 / A-68 9 1,9% 0 0,0% 9 1,6% 13 1,9% 0 0,0%<br />
Total 479 100,0% 89 100,0% 568 100,0% 685 100,0% 893 100,0%<br />
A-68 <strong>2.</strong>466 80,5% 808 44,8% 3.274 67,3% 3.593 79,0% 14.213 59,8%<br />
A-68 / N-622 / N-I 27 0,9% 0 0,0% 27 0,6% 39 0,9% 0 0,0%<br />
N-240 / N-I 0 0,0% 581 32,2% 581 11,9% 0 0,0% 9.289 39,1%<br />
BI-636 506 16,5% 414 23,0% 920 18,9% 824 18,1% 272 1,1%<br />
BI-2701 63 2,1% 0 0,0% 63 1,3% 92 2,0% 0 0,0%<br />
Total 3.062 100,0% 1.802 100,0% 4.865 100,0% 4.549 100,0% 23.774 100,0%<br />
A-68 1.216 100,0% 260 100,0% 1.476 100,0% 1.787 100,0% 3.711 100,0%<br />
A-68 / N-622 / N-I 0 0,0% 0 0,0% 0 0,0% 0 0,0% 0 0,0%<br />
N-240 0 0,0% 0 0,0% 0 0,0% 0 0,0% 0 0,0%<br />
Total 1.216 100,0% 260 100,0% 1.476 100,0% 1.787 100,0% 3.711 100,0%<br />
A-68 / N-622 / A-132 0 0,0% 0 0,0% 0 0,0% 0 0,0% 0 0,0%<br />
A-68 / N-622 / N-I 942 71,8% 151 40,3% 1.094 64,8% 1.217 72,9% 3.053 59,1%<br />
N-240 / A-1 329 25,0% 172 45,8% 501 29,6% 399 23,9% 1.460 28,3%<br />
A-8 / N-121-A 0 0,0% 0 0,0% 0 0,0% 0 0,0% 0 0,0%<br />
A-8 / A-15 42 3,2% 52 13,9% 94 5,6% 54 3,3% 651 12,6%<br />
A-68 0 0,0% 0 0,0% 0 0,0% 0 0,0% 0 0,0%<br />
Total 1.313 100,0% 375 100,0% 1.688 100,0% 1.670 100,0% 5.164 100,0%<br />
A-68 / N-622 / A-132 0 0,0% 0 0,0% 0 0,0% 0 0,0% 0 0,0%<br />
A-68 / N-622 / N-I 0 0,0% 0 0,0% 0 0,0% 0 0,0% 0 0,0%<br />
N-240 / A-1 0 0,0% 15 4,5% 15 1,4% 0 0,0% 59 1,0%<br />
A-8 / N-121-A 0 0,0% 0 0,0% 0 0,0% 0 0,0% 0 0,0%<br />
A-8 / A-15 0 0,0% 0 0,0% 0 0,0% 0 0,0% 0 0,0%<br />
A-68 729 100,0% 312 95,5% 1.040 98,6% 852 100,0% 5.674 99,0%<br />
Total 729 100,0% 326 100,0% 1.055 100,0% 852 100,0% 5.733 100,0%<br />
N-622 / A-68 / A-8 138 61,0% 143 100,0% 280 76,1% 196 63,1% 0 -<br />
N-240 / A-8 88 39,0% 0 0,0% 88 23,9% 114 36,9% 0 -<br />
Total 226 100,0% 143 100,0% 369 100,0% 310 100,0% 0 -<br />
A-68 160 100,0% 96 100,0% 256 100,0% 278 100,0% 0 -<br />
A-68 / N-622 0 0,0% 0 0,0% 0 0,0% 0 0,0% 0 -<br />
268<br />
Revisión <strong>de</strong>l Segundo P<strong>la</strong>n General <strong>de</strong> Carreteras <strong>de</strong>l País Vasco
Origen Destino Itinerario Total Ligeros Total Pesados Total Vehículos Total Pasajeros Total Mercancías (T)<br />
Centro<br />
La Rioja<br />
Navarra<br />
Valle <strong>de</strong>l Ebro<br />
Donostia-San Sebastián<br />
Bilbao Metropolitano<br />
Europa<br />
Vitoria-Gasteiz<br />
N-240 0 0,0% 0 0,0% 0 0,0% 0 0,0% 0 -<br />
Total 160 100,0% 96 100,0% 256 100,0% 278 100,0% 0 -<br />
A-68 / N-622 / A-132 0 0,0% 0 - 0 0,0% 0 0,0% 0 0,0%<br />
A-68 / N-622 / N-I 286 89,0% 0 - 286 89,0% 235 81,6% 152 100,0%<br />
N-240 / A-1 0 0,0% 0 - 0 0,0% 0 0,0% 0 0,0%<br />
A-8 / N-121-A 0 0,0% 0 - 0 0,0% 0 0,0% 0 0,0%<br />
A-8 / A-15 0 0,0% 0 - 0 0,0% 0 0,0% 0 0,0%<br />
A-68 35 11,0% 0 - 35 11,0% 53 18,4% 0 0,0%<br />
Total 321 100,0% 0 - 321 100,0% 288 100,0% 152 100,0%<br />
A-68 / N-622 / A-132 0 0,0% 0 0,0% 0 0,0% 0 0,0% 0 0,0%<br />
A-68 / N-622 / N-I 0 0,0% 0 0,0% 0 0,0% 0 0,0% 0 0,0%<br />
N-240 / A-1 0 0,0% 0 0,0% 0 0,0% 0 0,0% 0 0,0%<br />
A-8 / N-121-A 0 0,0% 0 0,0% 0 0,0% 0 0,0% 0 0,0%<br />
A-8 / A-15 0 0,0% 0 0,0% 0 0,0% 0 0,0% 0 0,0%<br />
A-68 260 100,0% 262 100,0% 522 100,0% 529 100,0% 4.917 100,0%<br />
Total 260 100,0% 262 100,0% 522 100,0% 529 100,0% 4.917 100,0%<br />
A-8 / A-68 272 29,8% 63 16,6% 335 26,0% 421 14,0% 690 22,2%<br />
N-I 640 70,2% 316 83,4% 956 74,0% <strong>2.</strong>588 86,0% <strong>2.</strong>414 77,8%<br />
A-8 / GI-627 / N-240 / N-I 0 0,0% 0 0,0% 0 0,0% 0 0,0% 0 0,0%<br />
Total 912 100,0% 379 100,0% 1.291 100,0% 3.009 100,0% 3.104 100,0%<br />
A-68 1.689 65,7% 839 46,6% <strong>2.</strong>528 57,8% <strong>2.</strong>521 67,7% 7.822 48,0%<br />
A-68 / N-622 / N-I 340 13,2% 962 53,4% 1.302 29,8% 453 12,2% 8.443 51,8%<br />
N-240 / N-I 0 0,0% 0 0,0% 0 0,0% 0 0,0% 0 0,0%<br />
BI-636 525 20,4% 0 0,0% 525 12,0% 722 19,4% 21 0,1%<br />
BI-2701 18 0,7% 0 0,0% 18 0,4% 28 0,7% 0 0,0%<br />
Total <strong>2.</strong>572 100,0% 1.801 100,0% 4.372 100,0% 3.724 100,0% 16.286 100,0%<br />
A-1 / A-68 117 17,7% 16 1,8% 133 8,5% 730 44,9% 0 0,0%<br />
N-I 543 82,3% 889 98,2% 1.431 91,5% 895 55,1% 1<strong>2.</strong>935 100,0%<br />
A-8 / GI-627 / N-240 / N-I 0 0,0% 0 0,0% 0 0,0% 0 0,0% 0 0,0%<br />
Total 659 100,0% 905 100,0% 1.564 100,0% 1.624 100,0% 1<strong>2.</strong>935 100,0%<br />
N-I / N-124 1.971 96,7% 223 91,6% <strong>2.</strong>194 96,1% <strong>2.</strong>756 96,9% 1.768 84,1%<br />
A-2124 / A-124 0 0,0% 0 0,0% 0 0,0% 0 0,0% 0 0,0%<br />
N-I / A-132 68 3,3% 20 8,4% 88 3,9% 88 3,1% 334 15,9%<br />
Total <strong>2.</strong>039 100,0% 243 100,0% <strong>2.</strong>283 100,0% <strong>2.</strong>844 100,0% <strong>2.</strong>103 100,0%<br />
269<br />
Revisión <strong>de</strong>l Segundo P<strong>la</strong>n General <strong>de</strong> Carreteras <strong>de</strong>l País Vasco
Origen Destino Itinerario Total Ligeros Total Pesados Total Vehículos Total Pasajeros Total Mercancías (T)<br />
Navarra<br />
Donostia-San Sebastián<br />
Bilbao Metropolitano<br />
Cornisa Cantábrica<br />
Europa<br />
Vitoria-Gasteiz<br />
Donostia-San Sebastián<br />
Bilbao Metropolitano<br />
Cornisa Cantábrica<br />
N-I 84 18,2% 0 - 84 18,2% 124 39,4% 0 0,0%<br />
A-15 por Estel<strong>la</strong> 378 81,8% 0 - 378 81,8% 191 60,6% 125 100,0%<br />
A-8 / A-68 0 0,0% 0 - 0 0,0% 0 0,0% 0 0,0%<br />
Total 462 100,0% 0 - 462 100,0% 316 100,0% 125 100,0%<br />
A-68 1.198 93,3% 155 76,0% 1.353 90,9% 1.772 100,0% 1.097 88,2%<br />
A-68 / N-622 / N-I 86 6,7% 49 24,0% 135 9,1% 0 0,0% 147 11,8%<br />
N-240 0 0,0% 0 0,0% 0 0,0% 0 0,0% 0 0,0%<br />
Total 1.285 100,0% 204 100,0% 1.488 100,0% 1.772 100,0% 1.243 100,0%<br />
A-68 160 100,0% 96 100,0% 256 100,0% 240 100,0% 1.524 100,0%<br />
A-68 / N-622 0 0,0% 0 0,0% 0 0,0% 0 0,0% 0 0,0%<br />
N-240 0 0,0% 0 0,0% 0 0,0% 0 0,0% 0 0,0%<br />
Total 160 100,0% 96 100,0% 256 100,0% 240 100,0% 1.524 100,0%<br />
N-I 0 - 0 0,0% 0 0,0% 0 - 0 0,0%<br />
A-15 0 - 60 100,0% 60 100,0% 0 - 775 100,0%<br />
Total 0 - 60 100,0% 60 100,0% 0 - 775 100,0%<br />
N-I / A-240 <strong>2.</strong>033 62,5% 246 52,5% <strong>2.</strong>279 61,2% <strong>2.</strong>810 68,6% 963 100,0%<br />
N-I / A-132 1.222 37,5% 223 47,5% 1.445 38,8% 1.284 31,4% 0 0,0%<br />
Total 3.255 100,0% 469 100,0% 3.724 100,0% 4.095 100,0% 964 100,0%<br />
A-8 / A-15 3.901 74,5% 702 66,8% 4.603 73,2% 5.099 72,7% 7.430 100,0%<br />
N-121-A 1.338 25,5% 349 33,2% 1.687 26,8% 1.911 27,3% 0 0,0%<br />
Total 5.239 100,0% 1.050 100,0% 6.289 100,0% 7.010 100,0% 7.430 100,0%<br />
A-68 / N-622 / A-132 123 9,1% 0 0,0% 123 7,4% 190 11,2% 0 0,0%<br />
A-68 / N-622 / N-I 711 52,3% 264 87,1% 975 58,7% 967 57,1% 454 100,0%<br />
N-240 / A-1 361 26,6% 0 0,0% 361 21,8% 485 28,6% 0 0,0%<br />
A-8 / N-636 0 0,0% 39 12,9% 39 2,4% 0 0,0% 0 0,0%<br />
A-8 / A-15 40 2,9% 0 0,0% 40 2,4% 52 3,1% 0 0,0%<br />
A-68 123 9,0% 0 0,0% 123 7,4% 0 0,0% 0 0,0%<br />
Total 1.357 100,0% 303 100,0% 1.661 100,0% 1.694 100,0% 454 100,0%<br />
A-68 / N-622 / A-132 0 0,0% 33 17,3% 33 9,2% 0 0,0% 462 20,6%<br />
A-68 / N-622 / N-I 127 75,4% 149 78,0% 276 76,8% 105 81,3% 1.704 76,1%<br />
N-240 / A-1 16 9,6% 0 0,0% 16 4,5% 24 18,7% 0 0,0%<br />
A-8 / N-121-A 0 0,0% 0 0,0% 0 0,0% 0 0,0% 0 0,0%<br />
A-8 / A-15 0 0,0% 9 4,7% 9 2,5% 0 0,0% 36 1,6%<br />
A-68 25 15,0% 0 0,0% 25 7,1% 0 0,0% 38 1,7%<br />
270<br />
Revisión <strong>de</strong>l Segundo P<strong>la</strong>n General <strong>de</strong> Carreteras <strong>de</strong>l País Vasco
Origen Destino Itinerario Total Ligeros Total Pesados Total Vehículos Total Pasajeros Total Mercancías (T)<br />
Valle <strong>de</strong>l Ebro<br />
Europa<br />
Vitoria-Gasteiz<br />
Donostia-San Sebastián<br />
Bilbao Metropolitano<br />
Cornisa Cantábrica<br />
Europa<br />
Europa Vitoria-Gasteiz<br />
Total 169 100,0% 191 100,0% 359 100,0% 129 100,0% <strong>2.</strong>240 100,0%<br />
A-8 / A-15 581 76,3% 198 40,8% 779 62,5% 1.067 75,4% <strong>2.</strong>196 24,7%<br />
N-121-A 181 23,7% 288 59,2% 469 37,5% 348 24,6% 6.708 75,3%<br />
Total 762 100,0% 486 100,0% 1.248 100,0% 1.415 100,0% 8.904 100,0%<br />
N-I / A-68 0 - 13 4,9% 13 4,9% 0 - 19 7,6%<br />
N-I / A-240 0 - 11 4,3% 11 4,3% 0 - 233 92,4%<br />
N-I / A-132 0 - 237 90,8% 237 90,8% 0 - 0 0,0%<br />
N-I / A-124 0 - 0 0,0% 0 0,0% 0 - 0 0,0%<br />
Total 0 - 261 100,0% 261 100,0% 0 - 253 100,0%<br />
A-8 / A-15 340 64,6% 149 53,2% 489 60,7% 441 71,6% 1.408 97,0%<br />
N-121-A 0 0,0% 0 0,0% 0 0,0% 0 0,0% 0 0,0%<br />
N-I 186 35,4% 74 26,4% 260 32,3% 175 28,4% 44 3,0%<br />
A-8 / A-68 0 0,0% 57 20,4% 57 7,1% 0 0,0% 0 0,0%<br />
Total 527 100,0% 280 100,0% 806 100,0% 616 100,0% 1.452 100,0%<br />
A-68 / N-622 / A-132 0 0,0% 0 0,0% 0 0,0% 0 0,0% 0 0,0%<br />
A-68 / N-622 / N-I 0 0,0% 133 29,9% 133 14,1% 0 0,0% 0 0,0%<br />
N-240 / A-1 0 0,0% 0 0,0% 0 0,0% 0 0,0% 0 0,0%<br />
A-8 / N-121-A 0 0,0% 0 0,0% 0 0,0% 0 0,0% 0 0,0%<br />
A-8 / A-15 0 0,0% 0 0,0% 0 0,0% 0 0,0% 0 0,0%<br />
A-68 501 100,0% 311 70,1% 813 85,9% 852 100,0% 3.198 100,0%<br />
Total 501 100,0% 444 100,0% 946 100,0% 852 100,0% 3.198 100,0%<br />
A-68 / N-622 / A-132 0 0,0% 0 0,0% 0 0,0% 0 0,0% 0 0,0%<br />
A-68 / N-622 / N-I 76 29,3% 39 14,7% 115 22,0% 114 23,7% 841 30,9%<br />
N-240 / A-1 0 0,0% 0 0,0% 0 0,0% 0 0,0% 0 0,0%<br />
A-8 / N-121-A 0 0,0% 0 0,0% 0 0,0% 0 0,0% 0 0,0%<br />
A-8 / A-15 0 0,0% 0 0,0% 0 0,0% 0 0,0% 0 0,0%<br />
A-68 184 70,7% 223 85,3% 407 78,0% 368 76,3% 1.878 69,1%<br />
Total 260 100,0% 262 100,0% 522 100,0% 482 100,0% <strong>2.</strong>719 100,0%<br />
A-8 / A-15 61 43,4% 93 100,0% 153 65,9% 0 0,0% 1.572 100,0%<br />
N-121-A 0 0,0% 0 0,0% 0 0,0% 0 0,0% 0 0,0%<br />
A-68 / A-8 79 56,6% 0 0,0% 79 34,1% 119 100,0% 0 0,0%<br />
Total 140 100,0% 93 100,0% 233 100,0% 119 100,0% 1.572 100,0%<br />
N-622 / A-68 / A-8 11 11,4% 0 0,0% 11 4,1% 20 14,7% 0 0,0%<br />
N-240 / A-8 0 0,0% 6 3,4% 6 2,2% 0 0,0% 121 3,9%<br />
271<br />
Revisión <strong>de</strong>l Segundo P<strong>la</strong>n General <strong>de</strong> Carreteras <strong>de</strong>l País Vasco
Origen Destino Itinerario Total Ligeros Total Pesados Total Vehículos Total Pasajeros Total Mercancías (T)<br />
Centro<br />
La Rioja<br />
Navarra<br />
Valle <strong>de</strong>l Ebro<br />
N-240 / GI-627 / A-8 0 0,0% 0 0,0% 0 0,0% 0 0,0% 0 0,0%<br />
N-I / A-8 89 88,6% 171 96,6% 260 93,7% 118 85,3% <strong>2.</strong>992 96,1%<br />
Total 101 100,0% 177 100,0% 277 100,0% 139 100,0% 3.112 100,0%<br />
A-1 / A-68 279 44,4% 14 1,3% 293 16,8% 1.175 68,7% 0 0,0%<br />
N-I 349 55,6% 1.106 98,7% 1.455 83,2% 535 31,3% 16.656 100,0%<br />
A-8 / GI-627 / N-240 / N-I 0 0,0% 0 0,0% 0 0,0% 0 0,0% 0 0,0%<br />
Total 628 100,0% 1.121 100,0% 1.749 100,0% 1.710 100,0% 16.656 100,0%<br />
N-I 0 - 0 0,0% 0 0,0% 0 - 0 0,0%<br />
A-15 0 - 60 100,0% 60 100,0% 0 - 1.304 100,0%<br />
Total 0 - 60 100,0% 60 100,0% 0 - 1.304 100,0%<br />
A-8 / A-15 756 76,6% 40 22,0% 796 68,1% 1.085 71,4% 601 100,0%<br />
N-121-A 230 23,4% 142 78,0% 372 31,9% 434 28,6% 0 0,0%<br />
Total 986 100,0% 182 100,0% 1.168 100,0% 1.519 100,0% 601 100,0%<br />
A-8 / A-15 73 91,6% 115 75,1% 188 80,7% 133 93,0% <strong>2.</strong>049 70,9%<br />
N-121-A 0 0,0% 38 24,9% 38 16,4% 0 0,0% 840 29,1%<br />
A-68 / A-8 7 8,4% 0 0,0% 7 2,9% 10 7,0% 0 0,0%<br />
Total 79 100,0% 153 100,0% 233 100,0% 143 100,0% <strong>2.</strong>889 100,0%<br />
Fuente: Imagen Final <strong>de</strong> <strong>la</strong> Demanda <strong>de</strong> Transporte en el País Vasco 2001<br />
272<br />
Revisión <strong>de</strong>l Segundo P<strong>la</strong>n General <strong>de</strong> Carreteras <strong>de</strong>l País Vasco
La matriz Origen / Destino <strong>de</strong> vehículos ligeros (motos, turismos y furgonetas), ambos sentidos, es <strong>la</strong> que se recoge a continuación:<br />
MATRIZ ORIGEN / DESTINO (VIAJES INTERIORES Y EXTERIORES A LA CAPV): VEHÍCULOS LIGEROS<br />
O / D Á<strong>la</strong>va Bizkaia Gipuzkoa Cornisa Cantábrica Centro – Sur La Rioja Navarra Valle <strong>de</strong>l Ebro Europa Resto Total<br />
Á<strong>la</strong>va 14.586 6.295 4.604 303 6.353 <strong>2.</strong>076 3.459 519 101 0 38.297<br />
Bizkaia 5.933 91.253 7.995 17.523 3.333 1.383 1.467 795 682 0 130.364<br />
Gipuzkoa 4.774 8.097 97.141 828 1.269 376 7.064 591 16.606 0 136.746<br />
Cornisa Cantábrica 313 16.789 524 0 137 160 388 260 73 32 18.676<br />
Centro – Sur 5.418 3.353 1.286 160 0 0 312 0 805 0 11.335<br />
La Rioja <strong>2.</strong>039 1.464 684 160 0 0 0 0 0 0 4.347<br />
Navarra 3.255 1.584 6.371 223 324 0 55 0 762 0 1<strong>2.</strong>576<br />
Valle <strong>de</strong>l Ebro 0 551 637 260 0 0 0 0 140 0 1.588<br />
Europa 101 682 17.148 130 720 0 986 79 0 0 19.847<br />
Resto 0 0 0 0 0 0 0 0 0 0 0<br />
Total 36.420 130.069 136.390 19.588 1<strong>2.</strong>137 3.995 13.731 <strong>2.</strong>245 19.168 32 373.776<br />
La matriz Origen / Destino <strong>de</strong> vehículos pesados (camiones y autobuses), ambos sentidos, es <strong>la</strong> siguiente:<br />
Fuente: Imagen Final <strong>de</strong> <strong>la</strong> Demanda <strong>de</strong> Transporte en el País Vasco 2001<br />
MATRIZ ORIGEN / DESTINO (VIAJES INTERIORES Y EXTERIORES A LA CAPV): VEHÍCULOS PESADOS<br />
O / D Á<strong>la</strong>va Bizkaia Gipuzkoa Cornisa Cantábrica Centro - Sur La Rioja Navarra Valle <strong>de</strong>l Ebro Europa Resto Total<br />
Á<strong>la</strong>va 837 650 758 66 0 203 275 261 171 0 3.220<br />
Bizkaia 1.299 9.679 1.981 1.390 <strong>2.</strong>233 348 418 462 405 0 18.215<br />
Gipuzkoa 565 1.783 6.236 270 598 283 563 124 1.345 0 11.768<br />
Cornisa Cantábrica 160 <strong>2.</strong>065 227 0 74 96 0 262 216 0 3.100<br />
Centro - Sur 1.682 <strong>2.</strong>360 665 106 0 0 324 0 1.031 11 6.180<br />
La Rioja 243 235 38 96 0 0 0 0 60 0 672<br />
Navarra 469 367 1.361 191 0 0 0 0 486 0 <strong>2.</strong>874<br />
Valle <strong>de</strong>l Ebro 261 583 328 262 0 0 0 0 93 0 1.527<br />
Europa 177 420 950 153 1.188 60 182 153 0 0 3.283<br />
Resto 0 0 0 0 0 0 0 0 0 0 0<br />
Total 5.694 18.142 1<strong>2.</strong>545 <strong>2.</strong>534 4.093 990 1.761 1.263 3.806 11 50.839<br />
Fuente: Imagen Final <strong>de</strong> <strong>la</strong> Demanda <strong>de</strong> Transporte en el País Vasco 2001<br />
273<br />
Revisión <strong>de</strong>l Segundo P<strong>la</strong>n General <strong>de</strong> Carreteras <strong>de</strong>l País Vasco
Por último, <strong>la</strong> matriz Origen / Destino total (ambos sentidos), es:<br />
Siendo:<br />
MATRIZ ORIGEN / DESTINO (VIAJES INTERIORES Y EXTERIORES A LA CAPV): VEHÍCULOS TOTALES<br />
O / D Á<strong>la</strong>va Bizkaia Gipuzkoa Cornisa Cantábrica Centro - Sur La Rioja Navarra Valle <strong>de</strong>l Ebro Europa Resto Total<br />
Á<strong>la</strong>va 15.423 6.946 5.362 369 6.353 <strong>2.</strong>279 3.734 780 271 0 41.517<br />
Bizkaia 7.233 100.932 9.976 18.914 5.566 1.731 1.884 1.257 1.088 0 148.580<br />
Gipuzkoa 5.339 9.881 103.377 1.098 1.867 659 7.627 715 17.951 0 148.514<br />
Cornisa Cantábrica 473 18.853 751 0 211 256 388 522 289 32 21.776<br />
Cornisa Cantábrica: Asturias, Cantabria y Galicia.<br />
Centro - Sur 7.100 5.713 1.951 267 0 0 636 0 1.836 11 17.515<br />
La Rioja <strong>2.</strong>283 1.699 723 256 0 0 0 0 60 0 5.019<br />
Navarra 3.724 1.951 7.732 414 324 0 55 0 1.248 0 15.449<br />
Valle <strong>de</strong>l Ebro 261 1.134 965 522 0 0 0 0 233 0 3.115<br />
Europa 277 1.102 18.098 283 1.908 60 1.168 233 0 0 23.129<br />
Resto 0 0 0 0 0 0 0 0 0 0 0<br />
Total 4<strong>2.</strong>114 148.211 148.935 2<strong>2.</strong>122 16.229 4.985 15.493 3.507 2<strong>2.</strong>975 44 424.615<br />
Centro – Sur: Castil<strong>la</strong> y León, Madrid, Castil<strong>la</strong> La Mancha, Andalucía, Extremadura, Portugal, Burgos.<br />
Valle <strong>de</strong>l Ebro: Aragón, Cataluña, Comunidad Valenciana, Murcia.<br />
Europa: Francia, Resto U.E.<br />
Fuente: Imagen Final <strong>de</strong> <strong>la</strong> Demanda <strong>de</strong> Transporte en el País Vasco 2001<br />
274<br />
Revisión <strong>de</strong>l Segundo P<strong>la</strong>n General <strong>de</strong> Carreteras <strong>de</strong>l País Vasco
<strong>2.</strong>5. ACCESIBILIDAD TERRITORIAL<br />
<strong>2.</strong>5.1 Introducción<br />
Con objeto <strong>de</strong> <strong>de</strong>terminar <strong>la</strong> accesibilidad territorial así como, en fases posteriores, los impactos <strong>de</strong>rivados<br />
<strong>de</strong> <strong>la</strong> ejecución <strong>de</strong>l P<strong>la</strong>n, se ha e<strong>la</strong>borado un Mo<strong>de</strong>lo <strong>de</strong> Transporte <strong>de</strong>l País Vasco <strong>de</strong> acuerdo con el<br />
siguiente esquema metodológico.<br />
275<br />
Revisión <strong>de</strong>l Segundo P<strong>la</strong>n General <strong>de</strong> Carreteras <strong>de</strong>l País Vasco
ESQUEMA METODOLÓGICO<br />
276<br />
Revisión <strong>de</strong>l Segundo P<strong>la</strong>n General <strong>de</strong> Carreteras <strong>de</strong>l País Vasco
Las activida<strong>de</strong>s realizadas se estructuran en cuatro niveles:<br />
√ Trabajos previos<br />
• Análisis <strong>de</strong> <strong>la</strong> información: recopi<strong>la</strong>ción <strong>de</strong> <strong>la</strong> información existente en cuanto a aforos <strong>de</strong> tráfico <strong>de</strong><br />
<strong>la</strong>s Diputaciones Forales <strong>de</strong> Á<strong>la</strong>va, Bizkaia y Gipuzkoa.<br />
• Formu<strong>la</strong>ción <strong>de</strong> mo<strong>de</strong>los: <strong>de</strong>finición conceptual y analítica <strong>de</strong> los mo<strong>de</strong>los que se utilizarán.<br />
• Determinación <strong>de</strong> <strong>la</strong> movilidad en <strong>la</strong> <strong>situación</strong> <strong>actual</strong>: cálculo <strong>de</strong> <strong>la</strong>s matrices Origen / Destino<br />
<strong>actual</strong>es, para vehículos ligeros y pesados, en re<strong>la</strong>ciones internas al País Vasco (PV - PV), externas<br />
al País Vasco (PV - Exterior) y <strong>de</strong> paso (Exterior - Exterior).<br />
• Construcción <strong>de</strong> escenarios futuros: proyección <strong>de</strong> <strong>la</strong>s variables que caracterizan estos escenarios.<br />
√ Implementación <strong>de</strong>l Mo<strong>de</strong>lo<br />
• Calibración <strong>de</strong> los mo<strong>de</strong>los: obtención <strong>de</strong> los parámetros <strong>de</strong> <strong>la</strong> formu<strong>la</strong>ción <strong>de</strong> los mo<strong>de</strong>los, y<br />
validación <strong>de</strong> los mismos por comparación <strong>de</strong> sus resultados frente a los observados.<br />
• Determinación <strong>de</strong> <strong>la</strong> movilidad futura: cálculo <strong>de</strong> <strong>la</strong>s matrices Origen / Destino futuras, para<br />
vehículos ligeros y pesados, en re<strong>la</strong>ciones internas al País Vasco (PV - PV), externas al País Vasco<br />
(PV - Exterior) y <strong>de</strong> paso (Exterior - Exterior).<br />
√ Ejecución <strong>de</strong>l Mo<strong>de</strong>lo<br />
• Cálculo <strong>de</strong> <strong>la</strong> <strong>de</strong>manda futura: ejecución <strong>de</strong>l mo<strong>de</strong>lo para obtener <strong>la</strong>s <strong>de</strong>mandas futuras para los<br />
escenarios temporales <strong>de</strong>finidos.<br />
√ Procesamiento <strong>de</strong> los resultados<br />
• Análisis y procesamiento <strong>de</strong> los resultados: tráficos en escenarios futuros, isocronas y variables<br />
condicionantes <strong>de</strong> <strong>la</strong> accesibilidad.<br />
Se ha recopi<strong>la</strong>do información <strong>de</strong> todas <strong>la</strong>s estaciones <strong>de</strong> aforo <strong>de</strong> <strong>la</strong> CAPV para diferentes años, y se ha<br />
tomado como referencia para <strong>la</strong> calibración posterior <strong>de</strong>l mo<strong>de</strong>lo los datos <strong>de</strong>l año 2005.<br />
De entre toda <strong>la</strong> información existente para <strong>la</strong>s estaciones <strong>de</strong> aforo se han seleccionado puntos <strong>de</strong> control<br />
<strong>de</strong> aforos (estaciones <strong>de</strong> aforo para comparar con los resultados <strong>de</strong>l mo<strong>de</strong>lo) para cada uno <strong>de</strong> los tres<br />
Territorios Históricos, <strong>de</strong> tal forma que se ha construido un cordón exterior al País Vasco y un cordón<br />
interior entre <strong>la</strong>s tres provincias.<br />
También se han reforzado los puntos <strong>de</strong> control <strong>de</strong> aforos en algunas áreas como <strong>la</strong>s zonas<br />
metropolitanas <strong>de</strong> <strong>la</strong>s tres Capitales Vascas y algunos ejes viales <strong>de</strong> especial interés como son:<br />
√ A-8 entre Behobia y El Haya.<br />
√ AP-68 entre Buia y Zambrana.<br />
√ N-I entre Irun y Ribabellosa.<br />
√ GI-627, A-627 y N-240 entre Maltzaga y Vitoria-Gasteiz.<br />
√ N-636 entre Beasain y Durango.<br />
√ N-622 entre Altube y Vitoria-Gasteiz.<br />
√ N-637 entre Kuku<strong>la</strong>rra y Erletxe.<br />
El p<strong>la</strong>no adjunto muestra los puntos <strong>de</strong> control <strong>de</strong> aforo que se han incluido en esta fase y que se han consi<strong>de</strong>rado en <strong>la</strong><br />
posterior calibración <strong>de</strong>l mo<strong>de</strong>lo.<br />
277<br />
Revisión <strong>de</strong>l Segundo P<strong>la</strong>n General <strong>de</strong> Carreteras <strong>de</strong>l País Vasco
PUNTOS DE CONTROL DE AFOROS. AÑO 2005<br />
278<br />
Revisión <strong>de</strong>l Segundo P<strong>la</strong>n General <strong>de</strong> Carreteras <strong>de</strong>l País Vasco
<strong>2.</strong>5.2 Formu<strong>la</strong>ción <strong>de</strong> los mo<strong>de</strong>los<br />
El Mo<strong>de</strong>lo <strong>de</strong> Tráfico se ha construido sobre el Software VISUM <strong>de</strong> PTV VISION. Las componentes <strong>de</strong>l<br />
Mo<strong>de</strong>lo que se han formu<strong>la</strong>do son:<br />
√ Zonificación: se ha a<strong>de</strong>cuado <strong>la</strong> zonificación para el correcto <strong>análisis</strong> <strong>de</strong> orígenes y <strong>de</strong>stinos <strong>de</strong> los<br />
usuarios <strong>de</strong> <strong>la</strong>s infraestructuras <strong>de</strong> transporte en el País Vasco. Se han consi<strong>de</strong>rado un total <strong>de</strong> 92 zonas<br />
<strong>de</strong> <strong>la</strong>s que 81 son zonas internas y 11 son zonas externas.<br />
√ Re<strong>de</strong>s: se consi<strong>de</strong>ra toda <strong>la</strong> <strong>red</strong> vial <strong>de</strong>l País Vasco y Norte <strong>de</strong> Navarra, con su topología <strong>de</strong><br />
intersecciones y con <strong>la</strong>s características <strong>de</strong> cada tramo en cuanto a distancias, capacida<strong>de</strong>s, velocida<strong>de</strong>s<br />
<strong>de</strong> flujo libre y funciones flujo-velocidad. En el exterior <strong>de</strong>l País Vasco, <strong>la</strong> <strong>red</strong> es más esquemática, pero<br />
refleja <strong>de</strong> forma correcta tiempos y costes <strong>de</strong> viaje. La topología <strong>de</strong> <strong>la</strong> <strong>red</strong> se <strong>de</strong>fine en los p<strong>la</strong>nos<br />
incluidos más a<strong>de</strong><strong>la</strong>nte en el informe.<br />
√ Estratificación <strong>de</strong> <strong>la</strong> <strong>de</strong>manda: se ha estratificado <strong>la</strong> <strong>de</strong>manda según tipo <strong>de</strong> vehículos (Ligeros y<br />
Pesados).<br />
√ Función <strong>de</strong> coste generalizado: integra <strong>la</strong> valoración subjetiva <strong>de</strong>l usuario respecto al coste que<br />
representa un <strong>de</strong>sp<strong>la</strong>zamiento en un itinerario concreto. La función <strong>de</strong> Coste Generalizado (CG) que se ha<br />
utilizado es <strong>la</strong> que sigue:<br />
CG = Kt * TV + Kd * Long + PEAJE<br />
siendo Kt el “valor <strong>de</strong>l tiempo” para cada estrato <strong>de</strong> <strong>de</strong>manda, TV el tiempo <strong>de</strong> viaje (minutos) para<br />
cada arco <strong>de</strong> <strong>la</strong> <strong>red</strong>, Kd el coste unitario por kilómetro recorrido sin peajes (costes <strong>de</strong> funcionamiento)<br />
para cada tipo <strong>de</strong> vehículo (o c<strong>la</strong>se <strong>de</strong> usuario) que es proporcional a <strong>la</strong> longitud <strong>de</strong>l arco y PEAJE <strong>la</strong><br />
tarifa <strong>de</strong> peaje que se aplica a <strong>la</strong> c<strong>la</strong>se <strong>de</strong> usuario.<br />
√ Submo<strong>de</strong>lo <strong>de</strong> generación <strong>de</strong> rutas alternativas: se utiliza el algoritmo propio <strong>de</strong> VISUM, basado<br />
en una generación estocástica, tipo Montecarlo, y en un filtrado posterior <strong>de</strong> subrutas.<br />
√ Submo<strong>de</strong>lo <strong>de</strong> elección <strong>de</strong> ruta: se ha utilizado mo<strong>de</strong>lo logit aplicado a <strong>la</strong>s rutas alternativas<br />
<strong>de</strong>tectadas para cada par origen-<strong>de</strong>stino.<br />
<strong>2.</strong>5.3 Determinación <strong>de</strong> <strong>la</strong> movilidad <strong>actual</strong><br />
El cálculo <strong>de</strong> <strong>la</strong>s matrices Origen / Destino en <strong>la</strong> <strong>situación</strong> <strong>actual</strong> (escenario 2005) para cada segmento <strong>de</strong><br />
<strong>de</strong>manda <strong>de</strong>finido (vehículos ligeros y vehículos pesados) se realiza siguiendo el siguiente procedimiento:<br />
√ Construcción <strong>de</strong> matrices O / D "observadas": <strong>la</strong> construcción <strong>de</strong> <strong>la</strong>s matrices O / D se ha<br />
realizado ensamb<strong>la</strong>ndo los resultados <strong>de</strong> diferentes encuestas, ya que <strong>la</strong> única que proporciona<br />
información completa para todas <strong>la</strong>s re<strong>la</strong>ciones (internas, externas y <strong>de</strong> paso) es <strong>la</strong> encuesta cordón en<br />
carretera <strong>de</strong>l año 1996, que ya está un tanto obsoleta y se ha utilizado únicamente para cubrir <strong>la</strong>gunas<br />
<strong>de</strong> <strong>la</strong> información más reciente.<br />
La construcción <strong>de</strong> <strong>la</strong>s matrices se ha realizado a partir <strong>de</strong> <strong>la</strong>s siguientes fuentes <strong>de</strong> información:<br />
• Imagen Global <strong>de</strong> <strong>la</strong> Demanda <strong>de</strong>l Transporte en el País Vasco 200<strong>2.</strong> Departamento <strong>de</strong> Transportes y<br />
Obras Públicas <strong>de</strong>l Gobierno Vasco.<br />
Supone una buena recopi<strong>la</strong>ción <strong>de</strong> información, aunque no con el <strong>de</strong>talle requerido para este<br />
<strong>análisis</strong>. Se usa <strong>de</strong> referencia y contraste <strong>de</strong> los resultados que se obtienen.<br />
• Estudio <strong>de</strong> <strong>la</strong> Movilidad en <strong>la</strong> Comunidad Autónoma Vasca 2003. Departamento <strong>de</strong> Transportes y<br />
Obras Públicas <strong>de</strong>l Gobierno Vasco.<br />
Encuesta Domiciliaria <strong>de</strong> Movilidad <strong>de</strong>l País Vasco que proporciona información sobre<br />
<strong>de</strong>sp<strong>la</strong>zamientos <strong>de</strong> personas resi<strong>de</strong>ntes en el País Vasco, aunque infravalora los <strong>de</strong>sp<strong>la</strong>zamientos<br />
motivados por gestiones profesionales.<br />
• Encuesta <strong>de</strong> Movilidad <strong>de</strong> <strong>la</strong>s Personas Resi<strong>de</strong>ntes en España Movilia 2000. Ministerio <strong>de</strong> Fomento.<br />
Da buena información, aunque poco <strong>de</strong>sagregada espacialmente, sobre todo para los<br />
<strong>de</strong>sp<strong>la</strong>zamientos <strong>de</strong> viajeros externos al País Vasco <strong>de</strong> más <strong>de</strong> 100 km <strong>de</strong> longitud.<br />
• Encuesta <strong>de</strong> Movimientos Turísticos en Fronteras. 200<strong>2.</strong> FRONTUR.<br />
Proporciona información sobre flujos transfronterizos. En lo re<strong>la</strong>tivo al País Vasco esta encuesta ha<br />
sido procesada para el Informe <strong>de</strong>l Turismo Vasco (2002) <strong>de</strong> <strong>la</strong> Viceconsejería <strong>de</strong> Turismo <strong>de</strong>l<br />
Gobierno Vasco.<br />
• Encuesta Permanente <strong>de</strong> Transporte <strong>de</strong> Mercancías por Carretera. 200<strong>2.</strong> Ministerio <strong>de</strong> Fomento.<br />
Da información sobre tráficos externos <strong>de</strong> camiones, aunque con agregación espacial insuficiente.<br />
• Tránsito <strong>de</strong> Mercancías Transpirenaico. 1999. Observatorio Transpirenaico.<br />
Da información sobre tráfico <strong>de</strong> camiones transfronterizo.<br />
Como pue<strong>de</strong> observarse <strong>la</strong> información sobre tráfico <strong>de</strong> mercancías, y muy especialmente en flujos<br />
internos al País Vasco, es pobre. A falta <strong>de</strong> otra información más <strong>actual</strong> se ha utilizado <strong>la</strong> <strong>de</strong> <strong>la</strong>s<br />
encuestas cordón <strong>de</strong>l año 1996, proyectadas al año 2002 por comparación <strong>de</strong> los aforos <strong>de</strong> pesados<br />
en 1996 y 200<strong>2.</strong><br />
279<br />
Revisión <strong>de</strong>l Segundo P<strong>la</strong>n General <strong>de</strong> Carreteras <strong>de</strong>l País Vasco
Origen<br />
Interno País Vasco<br />
Externo<br />
FUENTES DE MOVILIDAD CONSULTADAS: VIAJEROS<br />
Área Especial<br />
(Castro Urdiales,<br />
Miranda <strong>de</strong> Ebro,<br />
Aquitania)<br />
Peninsu<strong>la</strong>r<br />
(CCAA)<br />
Internacional<br />
Destino<br />
Interno Externo<br />
País Vasco Área<br />
Especial<br />
EOD 2002<br />
Operadores<br />
Transporte<br />
Püblico<br />
Aforos<br />
Informe<br />
Turismo País<br />
Vasco 2002<br />
Aforos<br />
Operadores<br />
Transporte<br />
Püblico<br />
EOD 1996<br />
Movilia 2000<br />
Imagen Global<br />
País Vasco<br />
2002<br />
EOD 1996<br />
Informe<br />
Turismo País<br />
Vasco 2002<br />
(Datos<br />
FRONTUR)<br />
EOD 2002<br />
Operadores<br />
Transporte<br />
Püblico<br />
Aforos<br />
Peninsu<strong>la</strong>r Internacional<br />
EOD 2002<br />
EOD 1996<br />
RENFE-Larga<br />
Distancia<br />
AENA<br />
EOD 1996<br />
Movilia 2000<br />
EOD 1996<br />
FRONTUR<br />
Proyecto<br />
Europeo<br />
DATELINE<br />
EOD 2002<br />
Movilia 2000<br />
EOD 1996<br />
AENA<br />
EOD 1996<br />
Movilia 2000<br />
EOD 1996<br />
Proyecto Europeo<br />
DATELINE<br />
Origen<br />
Interno País Vasco<br />
Externo<br />
FUENTES DE MOVILIDAD CONSULTADAS: MERCANCÍAS<br />
Área Especial<br />
(Castro<br />
Ud¡rdiales,<br />
Miranda <strong>de</strong> Ebro,<br />
Aquitania)<br />
Peninsu<strong>la</strong>r<br />
(CCAA)<br />
Internacional<br />
Destino<br />
Interno Externo<br />
País Vasco Área Especial Peninsu<strong>la</strong>r Internacional<br />
EOD 2002<br />
Imagen Global<br />
País Vasco 2002<br />
Operadores<br />
Transporte<br />
(RENFE, FEVE)<br />
Aforos<br />
Informe<br />
Mercancías<br />
Pirineos<br />
Operadores<br />
Transporte<br />
(terrestre,<br />
marítimo, aéreo)<br />
EOD 1996<br />
Imagen Global<br />
País Vasco<br />
Encuesta<br />
Permanente <strong>de</strong><br />
Transporte <strong>de</strong><br />
Mercancías por<br />
Carretera<br />
Operadores<br />
Transporte<br />
Informe<br />
Mercancías<br />
Pirineos<br />
Imagen Global<br />
País Vasco 2002<br />
Operadores<br />
Ferroviarios<br />
Puertos <strong>de</strong><br />
Bilbao y Pasaia<br />
EOD 1996<br />
Imagen Global<br />
País Vasco 2002<br />
Operadores<br />
Transporte<br />
(terrestre,<br />
marítimo,<br />
aéreo)<br />
Encuesta<br />
Permanente <strong>de</strong><br />
Transporte <strong>de</strong><br />
Mercancías por<br />
Carretera<br />
Encuesta<br />
Permanente <strong>de</strong><br />
Transporte <strong>de</strong><br />
Mercancías por<br />
Carretera<br />
Informe<br />
Mercancías<br />
Pirineos<br />
280<br />
Encuesta<br />
Permanente <strong>de</strong><br />
Transporte <strong>de</strong><br />
Mercancías por<br />
Carretera<br />
Informe<br />
Mercancías<br />
Pirineos<br />
Operadores<br />
Transporte<br />
Encuesta<br />
Permanente <strong>de</strong><br />
Transporte <strong>de</strong><br />
Mercancías por<br />
Carretera<br />
Informe<br />
Mercancías<br />
Pirineos<br />
Informe<br />
Mercancías<br />
Pirineos<br />
Revisión <strong>de</strong>l Segundo P<strong>la</strong>n General <strong>de</strong> Carreteras <strong>de</strong>l País Vasco
A partir <strong>de</strong> esta información se han construido <strong>la</strong>s matrices para el año 2002 para vehículos ligeros y<br />
para vehículos pesados.<br />
√ Proyección <strong>de</strong> <strong>la</strong>s matrices <strong>de</strong>l año 2002 al año 2005: se han proyectado <strong>la</strong>s matrices<br />
calcu<strong>la</strong>das en el año 2002 al año 2005 aplicando <strong>la</strong>s tasas <strong>de</strong> crecimiento históricas observadas en <strong>la</strong> <strong>red</strong><br />
<strong>viaria</strong> <strong>de</strong> <strong>la</strong> CAPV.<br />
√ Ajuste <strong>de</strong> matrices O / D "observadas": para solventar <strong>la</strong>s carencias y heterogeneidad <strong>de</strong><br />
información, se ha realizado un ajuste <strong>de</strong> <strong>la</strong>s matrices construídas a partir <strong>de</strong> los aforos observados en <strong>la</strong>s<br />
carreteras. Se han utilizado para este proceso los puntos <strong>de</strong> control <strong>de</strong> aforo <strong>de</strong>terminados en el capitulo<br />
anterior.<br />
Para hacer el ajuste <strong>de</strong> <strong>la</strong>s matrices se ha utilizado el software TFlow-Fuzzy, incluido <strong>de</strong>ntro <strong>de</strong>l<br />
paquete <strong>de</strong> simu<strong>la</strong>ción VISUM. Este software aplica el enfoque <strong>de</strong> ajuste <strong>de</strong> matrices <strong>de</strong>sarrol<strong>la</strong>do por<br />
Rinowski (1996), basado en <strong>la</strong> minimización <strong>de</strong> <strong>la</strong> entropía para conjuntos dispersos.<br />
<strong>2.</strong>5.4 Calibración y validación <strong>de</strong>l Mo<strong>de</strong>lo<br />
Una vez calcu<strong>la</strong>das <strong>la</strong>s matrices <strong>de</strong> <strong>de</strong>manda para el año 2005, se estiman los parámetros necesarios para el<br />
correcto funcionamiento <strong>de</strong>l Mo<strong>de</strong>lo que permita validar los resultados obtenidos respecto a <strong>la</strong> IMD para el<br />
año 2005 con aquellos observados en <strong>la</strong> realidad para el mismo escenario temporal.<br />
En el Mo<strong>de</strong>lo se <strong>de</strong>finen y <strong>de</strong>sarrol<strong>la</strong>n <strong>la</strong>s siguientes tareas:<br />
√ Zonificación<br />
Respecto a <strong>la</strong>s zonas internas (81 zonas), se adopta <strong>la</strong> división municipal en <strong>la</strong>s Áreas Metropolitanas<br />
<strong>de</strong> Bilbao y Donostia-San Sebastián. En áreas menos <strong>de</strong>nsamente pob<strong>la</strong>das y con un nivel <strong>de</strong> actividad<br />
menor, <strong>la</strong>s zonas <strong>de</strong>l mo<strong>de</strong>lo incluyen más <strong>de</strong> un municipio. En cuanto a <strong>la</strong> zonificación externa, se<br />
han consi<strong>de</strong>rado 11 zonas que se <strong>de</strong>tal<strong>la</strong>n en <strong>la</strong>s tab<strong>la</strong>s y el p<strong>la</strong>no adjuntos.<br />
El p<strong>la</strong>no <strong>de</strong> zonificación incluido refleja <strong>la</strong> zonificación incorporada. La tab<strong>la</strong> adjunta resume <strong>la</strong>s zonas<br />
que se han <strong>de</strong>finido.<br />
ZONIFICACIÓN ADOPTADA<br />
Zonificación Nombre Zona Zonificación Nombre Zona<br />
ZONAS INTERNAS<br />
1 VITORIA-GASTEIZ 31 PLENTZIA<br />
2 ALEGRÍA 32 MUNGIA<br />
3 CAMPEZO 33 BERMEO<br />
4 ARMIÑÓN 34 MUNDAKA<br />
5 SALINAS 35 GERNIKA<br />
6 ZUIA 36 AMOREBIETA<br />
7 LEGUTIANO 37 LEMOA<br />
8 OION 38 IGORRE<br />
9 LAGUARDIA 39 OROZKO<br />
10 AMURRIO 40 GÜEÑES<br />
11 LLODIO 41 ABANTO<br />
12 SALVATIERRA 42 SANTURTZI<br />
20 BILBAO 551 MUSKIZ SAN JUAN<br />
21 SONDIKA 552 MUSKIZ KOBARÓN<br />
22 DERIO 44 BALMASEDA<br />
23 LEZAMA 45 KARRANZA<br />
24 BASAURI 46 EREÑO<br />
25 GALDAKAO 47 MENDATA<br />
26 ARRIGORRIAGA 48 LEKEITIO<br />
27 BARAKALDO 49 MARKINA<br />
28 ORTUELLA 50 ONDARROA<br />
29 PORTUGALETE 51 ERMUA<br />
30 GETXO 52 BERRIZ<br />
53 ELORRIO 82 ZUMAIA<br />
54 DURANGO 83 AZPEITIA<br />
55 ERANDIO 84 ALBIZTUR<br />
56 ORDUÑA 85 TOLOSA<br />
57 ALONSOTEGI 86 DEBA<br />
70 DONOSTIA – SAN SEBASTIÁN 87 ELGOIBAR<br />
71 PASAIA 88 EIBAR<br />
281<br />
Revisión <strong>de</strong>l Segundo P<strong>la</strong>n General <strong>de</strong> Carreteras <strong>de</strong>l País Vasco
Zonificación Nombre Zona Zonificación Nombre Zona<br />
72 HONDARRIBIA 89 BERGARA<br />
73 IRUN 90 ZUMARRAGA<br />
74 OIARTZUN 91 LEGAZPI<br />
75 RENTERIA 92 ORDIZIA<br />
76 HERNANI 93 AMEZKETA<br />
77 BERASTEGI 94 ATAUN<br />
78 ANDOAIN 95 IDIAZABAL<br />
79 LASARTE 96 OÑATI<br />
80 VILLABONA 97 ARRASATE - MONDRAGÓN<br />
602 ZARAUTZ 98 ESKORIATZA<br />
603 ORIO<br />
ZONAS EXTERNAS<br />
150 CASTRO URDIALES<br />
201 CORNISA CANTÁBRICA<br />
206 VALLE EBRO<br />
208 MESETA<br />
209 LA RIOJA<br />
250 MIRANDA DE EBRO<br />
501 RESTO DEL MUNDO<br />
550 AQUITANIA<br />
604 PAMPLONA<br />
606 ESTELLA<br />
607 TUDELA<br />
608 VERA DE BIDASOA<br />
282<br />
Revisión <strong>de</strong>l Segundo P<strong>la</strong>n General <strong>de</strong> Carreteras <strong>de</strong>l País Vasco
√ Re<strong>de</strong>s<br />
Las re<strong>de</strong>s incorporadas al mo<strong>de</strong>lo están constituidas por una serie <strong>de</strong> elementos que contienen una<br />
re<strong>la</strong>ción <strong>de</strong> atributos que recogen <strong>la</strong>s características más importantes <strong>de</strong> los mismos, necesarias para<br />
el proceso <strong>de</strong> asignación <strong>de</strong> tráficos a <strong>la</strong> <strong>red</strong>. En este sentido, cabe matizar:<br />
• Nodos<br />
• Arcos<br />
Son objetos que <strong>de</strong>finen <strong>la</strong>s intersecciones <strong>de</strong> los arcos <strong>de</strong> <strong>la</strong> <strong>red</strong>. Los arcos comienzan y acaban<br />
en un nodo. Solo se ha <strong>de</strong>finido un tipo <strong>de</strong> nodo.<br />
Conectan los nodos y por tanto representan <strong>la</strong> infraestructura <strong>viaria</strong>. Son direccionales. Se han<br />
consi<strong>de</strong>rado diferentes tipos <strong>de</strong> arcos en <strong>la</strong> <strong>red</strong> que incorporan <strong>la</strong>s características en cuanto a<br />
velocidad, capacidad y coste <strong>de</strong> <strong>la</strong> <strong>red</strong> <strong>de</strong> carreteras.<br />
Para <strong>la</strong> <strong>red</strong> <strong>viaria</strong>, se han <strong>de</strong>finido diferentes tipos <strong>de</strong> arco según <strong>la</strong> funcionalidad <strong>de</strong> <strong>la</strong>s carreteras<br />
siguiendo lo establecido en el P<strong>la</strong>n <strong>de</strong> Carreteras. Los tipos <strong>de</strong> arco consi<strong>de</strong>rado son los que<br />
siguen:<br />
- Autopistas<br />
- Autovías.<br />
- Red <strong>de</strong> Interés Preferente.<br />
- Red Básica.<br />
- Red Comarcal.<br />
- Re<strong>de</strong>s Urbanas.<br />
In<strong>de</strong>pendientemente <strong>de</strong> <strong>la</strong>s características generales <strong>de</strong> cada tipo <strong>de</strong> <strong>red</strong>, los arcos <strong>de</strong>l mo<strong>de</strong>lo<br />
incorporan <strong>de</strong> forma individual <strong>la</strong>s siguientes características:<br />
- Longitud.<br />
- Número <strong>de</strong> carriles.<br />
- Capacidad.<br />
- Velocidad <strong>de</strong> flujo libre.<br />
- Peajes.<br />
Para el cálculo <strong>de</strong> los tiempos <strong>de</strong> viaje en <strong>la</strong> <strong>red</strong> <strong>viaria</strong> congestionada se utilizan funciones <strong>de</strong><br />
restricción <strong>de</strong> capacidad (BPR-2), que vincu<strong>la</strong>n <strong>la</strong> caída <strong>de</strong> velocidad por congestión, en re<strong>la</strong>ción a<br />
<strong>la</strong> <strong>de</strong> flujo libre, con <strong>la</strong> saturación (Flujo / Capacidad).<br />
El gráfico adjunto muestra <strong>la</strong>s funciones <strong>de</strong> restricción <strong>de</strong> capacidad incorporadas al mo<strong>de</strong>lo para<br />
dos carreteras “tipo”. La curva violeta correspon<strong>de</strong>ría a una autopista y <strong>la</strong> azul a una carretera<br />
bidireccional.<br />
V/V0<br />
120<br />
110<br />
100<br />
• Re<strong>la</strong>ciones <strong>de</strong> giro<br />
• Conectores<br />
90<br />
80<br />
70<br />
60<br />
50<br />
40<br />
30<br />
20<br />
10<br />
FUNCIONES DE RESTRICCION DE CAPACIDAD<br />
0<br />
0 0.1 0.2 0.3 0.4 0.5 0.6 0.7 0.8<br />
q/qmax<br />
0.9 1 1.1 1.2 1.3 1.4 1.5 1.6<br />
Indican los movimientos <strong>de</strong> giro permitidos en una intersección <strong>de</strong>terminada. En cada uno <strong>de</strong> los<br />
nodos incorporados al mo<strong>de</strong>lo se han <strong>de</strong>finido <strong>la</strong>s re<strong>la</strong>ciones <strong>de</strong> giro que están permitidas y<br />
aquel<strong>la</strong>s prohibiciones <strong>de</strong> giro que existen en <strong>la</strong> <strong>red</strong> <strong>de</strong> carreteras mo<strong>de</strong><strong>la</strong>da. Las prohibiciones <strong>de</strong><br />
giro se han activado únicamente en los semien<strong>la</strong>ces <strong>de</strong> <strong>la</strong>s autopistas.<br />
Conectan los centroi<strong>de</strong>s zonales con los arcos <strong>de</strong> <strong>la</strong> <strong>red</strong>. Cada zona <strong>de</strong>finida en el mo<strong>de</strong>lo, está<br />
<strong>de</strong>finida por un centroi<strong>de</strong>, que se une a <strong>la</strong> <strong>red</strong> a través <strong>de</strong> estos conectores.<br />
284<br />
Revisión <strong>de</strong>l Segundo P<strong>la</strong>n General <strong>de</strong> Carreteras <strong>de</strong>l País Vasco
√ Estratificación <strong>de</strong> <strong>la</strong> <strong>de</strong>manda<br />
La <strong>de</strong>manda se ha estratificado según tipo <strong>de</strong> vehículos (ligeros y pesados). En <strong>la</strong> sección anterior se<br />
han ajustado <strong>la</strong>s matrices observadas <strong>de</strong> Ligeros y Pesados a los aforos mediante el procedimiento<br />
TFLOW - FUZZY.<br />
√ Función <strong>de</strong> coste generalizado<br />
Los valores <strong>de</strong>l tiempo utilizados han tomado como referencia los valores <strong>de</strong>l tiempo calibrados en<br />
estudios anteriores realizados en proyectos vincu<strong>la</strong>dos a <strong>la</strong> CAPV.<br />
Estos valores <strong>de</strong>l tiempo se han obtenido realizando encuestas <strong>de</strong> preferencias <strong>de</strong>c<strong>la</strong>radas, siendo el<br />
último resultado el correspondiente al año 2005.<br />
La tab<strong>la</strong> adjunta muestra los valores <strong>de</strong>l tiempo incorporados al mo<strong>de</strong>lo.<br />
Estrato Demanda Valor <strong>de</strong>l Tiempo<br />
(€/hora)<br />
Ligeros 12,17<br />
Pesados 24,00<br />
√ Submo<strong>de</strong>lo <strong>de</strong> generación y elección <strong>de</strong> rutas<br />
Los métodos utilizados para mo<strong>de</strong><strong>la</strong>r el comportamiento <strong>de</strong> los viajes se basan en algoritmos <strong>de</strong><br />
búsqueda que <strong>de</strong>terminan rutas o conexiones entre un origen y un <strong>de</strong>stino. Una vez <strong>de</strong>terminadas<br />
estas rutas, los viajes <strong>de</strong> una re<strong>la</strong>ción origen / <strong>de</strong>stino son distribuidos entre <strong>la</strong>s anteriores. Esta<br />
combinación <strong>de</strong> búsqueda y distribución <strong>de</strong> viajes es lo que se conoce con el nombre <strong>de</strong> “Asignación”.<br />
VISUM utiliza distintos métodos <strong>de</strong> asignación. En concreto el mo<strong>de</strong>lo VISUM diseñado para el estudio<br />
ha utilizado un método <strong>de</strong> asignación estocástica.<br />
Este método parte <strong>de</strong>l hecho <strong>de</strong> que, los individuos en su búsqueda <strong>de</strong> rutas parten <strong>de</strong> una<br />
información incompleta y cada uno <strong>de</strong> ellos son diferentes en cuanto a <strong>la</strong> percepción <strong>de</strong>l entorno y en<br />
términos <strong>de</strong> preferencias. En este sentido es posible calcu<strong>la</strong>r no solo “<strong>la</strong> ruta mínima” en términos <strong>de</strong><br />
impedancia, sino también rutas alternativas. Una vez generadas estas rutas <strong>la</strong> distribución <strong>de</strong> los<br />
viajes entre <strong>la</strong>s mismas se realiza mediante un algoritmo LOGIT basado en <strong>la</strong> Impedancia <strong>de</strong> cada una<br />
<strong>de</strong> <strong>la</strong>s rutas.<br />
La “impedancia” que interviene tanto en <strong>la</strong> búsqueda <strong>de</strong> rutas como en <strong>la</strong> asignación <strong>de</strong> cada par O /D<br />
a <strong>la</strong> <strong>red</strong> es una función que <strong>de</strong>pen<strong>de</strong> <strong>de</strong>l tiempo en <strong>la</strong> <strong>red</strong> congestionada, <strong>de</strong> los peajes, y <strong>de</strong> factores<br />
específicos que se pue<strong>de</strong>n incorporar a los objetos <strong>de</strong> <strong>la</strong> <strong>red</strong> (penalizaciones etc.).<br />
Esta impedancia se expresa en términos monetarios (céntimos <strong>de</strong> EURO), y <strong>la</strong> impedancia <strong>de</strong> una ruta<br />
incorpora <strong>la</strong> impedancia <strong>de</strong> los conectores, <strong>de</strong> los arcos y <strong>de</strong> <strong>la</strong>s re<strong>la</strong>ciones <strong>de</strong> giro que intervienen en<br />
esa ruta.<br />
El gráfico adjunto <strong>de</strong>scribe brevemente el procedimiento <strong>de</strong> asignación estocástica.<br />
BUSQUEDA DE RUTAS<br />
ASIGNACION DE LOS FLUJOS A LA RED<br />
CALCULO DE IMPEDANCIAS EN LA RED "SIN CARGAR"<br />
CALCULAR PARA CADA PAR O-D LA RUTA MINIMA (EN TERMINOS DE IMPEDANCIA)<br />
GENERACION DE RUTAS ALTERNATIVAS VARIANDO LA IMPEDANCIA (IMPEDANCIA<br />
SE DISTRIBUYE DE FORMA ALEATORIA - DETERMINACION DE LOS PARAMETROS<br />
DE MEDIA Y VARIANZA)<br />
PRESELECION DE RUTAS - ELIMINACION DE RUTAS TRIVIALES<br />
CALCULO DEL "FACTOR DE SIMILITUD" QUE CONSIDERA EL SOLAPAMIENTO DE<br />
RUTAS<br />
CACULO INICIAL DE IMPEDANCIA EN LA RED SIN CARGAR<br />
CALCULO DE LA IMPEDANCIA EN LA RED CARGADA Y CONSIDERANDO EL<br />
"FACTOR DE SIMILITUD"<br />
ASIGNACION DE CADA PAR O-D MODELO LOGIT<br />
285<br />
Revisión <strong>de</strong>l Segundo P<strong>la</strong>n General <strong>de</strong> Carreteras <strong>de</strong>l País Vasco
<strong>2.</strong>5.5 Conclusiones <strong>de</strong>l escenario 2005<br />
<strong>2.</strong>5.5.1. Carga <strong>de</strong> <strong>la</strong> <strong>red</strong><br />
Con estos parámetros se ha realizado simu<strong>la</strong>ciones para el año base que en este caso es el año 2005. Se<br />
han realizado comparaciones en cuanto a <strong>la</strong>s IMD en <strong>la</strong> vialidad <strong>de</strong>l País Vasco y especialmente en aquellos<br />
tramos que resultan especialmente relevantes <strong>de</strong>s<strong>de</strong> <strong>la</strong> perspectiva <strong>de</strong>l P<strong>la</strong>n.<br />
El siguiente p<strong>la</strong>no muestra los tráficos obtenidos para el año 2005. Los mayores tráficos se registran<br />
lógicamente en el entorno <strong>de</strong> <strong>la</strong>s tres capitales vascas. En cuanto a los tráficos <strong>de</strong> tipo interurbano se<br />
concentran básicamente en el triángulo formado por los tres núcleos <strong>de</strong> pob<strong>la</strong>ción más importantes (Bilbao,<br />
Vitoria-Gasteiz y Donostia-San Sebastián) cuyo volumen se materializa en <strong>la</strong>s cargas que soportan <strong>la</strong>s<br />
carreteras A-8, AP-68, N-I y N-622 que presentan flujos <strong>de</strong> vehículos superiores a 20.000 vehículos / día.<br />
Hay que seña<strong>la</strong>r qu, en el caso <strong>de</strong> <strong>la</strong> vialidad próxima a núcleos urbanos que presentan tráficos <strong>de</strong> agitación<br />
importantes, el Mo<strong>de</strong>lo carece <strong>de</strong> <strong>de</strong>talle suficiente para simu<strong>la</strong>r estas situaciones y, por tanto <strong>la</strong>s IMD que<br />
se obtienen en estos casos pue<strong>de</strong>n ser inferiores a <strong>la</strong>s observadas.<br />
286<br />
Revisión <strong>de</strong>l Segundo P<strong>la</strong>n General <strong>de</strong> Carreteras <strong>de</strong>l País Vasco
<strong>2.</strong>5.6 Isocronas<br />
Con el fin <strong>de</strong> visualizar <strong>de</strong> forma inmediata los tiempos <strong>de</strong> acceso por carretera al territorio <strong>de</strong> <strong>la</strong> CAPV en <strong>la</strong><br />
<strong>situación</strong> <strong>actual</strong>, se han calcu<strong>la</strong>do <strong>la</strong>s isocronas <strong>de</strong>s<strong>de</strong> puntos representativos <strong>de</strong> <strong>la</strong> <strong>red</strong> <strong>viaria</strong>.<br />
El cálculo <strong>de</strong> los tiempos <strong>de</strong> viaje se ha realizado sobre los arcos <strong>de</strong> <strong>la</strong> <strong>red</strong> incluida en el Mo<strong>de</strong>lo y se ha<br />
utilizado el módulo <strong>de</strong>l cálculo <strong>de</strong> isocronas incorporado en el software VISUM. Este modulo calcu<strong>la</strong> los<br />
tiempos <strong>de</strong> recorrido <strong>de</strong>s<strong>de</strong> un punto <strong>de</strong> <strong>la</strong> <strong>red</strong> consi<strong>de</strong>rando <strong>la</strong> topología y <strong>la</strong> congestión <strong>viaria</strong> simu<strong>la</strong>da<br />
para un día <strong>la</strong>borable medio.<br />
Con el fin <strong>de</strong> representar <strong>de</strong> forma visual los resultados obtenidos, se han construido <strong>la</strong>s isocronas en<br />
intervalos <strong>de</strong> 15 minutos <strong>de</strong>s<strong>de</strong> <strong>la</strong>s tres capitales vascas, y <strong>de</strong>s<strong>de</strong> dos zonas con un nivel <strong>de</strong> accesibilidad<br />
complejo <strong>de</strong>ntro <strong>de</strong>l correspondiente Territorio Histórico, como son Rioja A<strong>la</strong>vesa y Gernika - Bermeo.<br />
A <strong>la</strong> vista <strong>de</strong> estas isocronas cabe <strong>de</strong>stacar los siguientes aspectos:<br />
√ Des<strong>de</strong> Vitoria-Gasteiz se acce<strong>de</strong> a prácticamente a todo el País Vasco en tiempos inferiores a 1 hora y<br />
45 minutos, lo que refleja por un <strong>la</strong>do su centralidad y por otro <strong>la</strong>do <strong>la</strong> buena calidad <strong>de</strong> sus conexiones<br />
<strong>viaria</strong>s.<br />
√ Partiendo <strong>de</strong> Donostia-San Sebastián <strong>la</strong> isocrona <strong>de</strong> 1 hora 45 minutos <strong>de</strong>ja fuera <strong>la</strong> zona <strong>de</strong> Rioja<br />
A<strong>la</strong>vesa y Valles A<strong>la</strong>veses. También queda fuera <strong>de</strong> <strong>la</strong> misma, parte <strong>de</strong>l área <strong>de</strong> Encartaciones.<br />
√ Des<strong>de</strong> Bilbao so<strong>la</strong>mente parte <strong>de</strong> <strong>la</strong> Rioja A<strong>la</strong>vesa queda fuera <strong>de</strong> <strong>la</strong> isocrona <strong>de</strong> 1 hora y 45 minutos.<br />
√ La isocrona <strong>de</strong> 1 hora y 45 minutos <strong>de</strong>s<strong>de</strong> Laguardia llega hasta Etxegarate y Arrasate – Mondragón,<br />
en Gipuzkoa, y hasta Bilbao, Durango, Mungia y Zal<strong>la</strong> en Bizkaia. El <strong>red</strong>ucido radio <strong>de</strong> <strong>la</strong> isocrona en<br />
comparación con los núcleos <strong>de</strong> <strong>la</strong>s tres capitales vascas refleja c<strong>la</strong>ramente problemas <strong>de</strong> accesibilidad en<br />
<strong>la</strong> zona.<br />
√ Finalmente <strong>la</strong> isocrona <strong>de</strong> 1 hora y 45 minutos <strong>de</strong>s<strong>de</strong> Bermeo llega hasta Vitoria-Gasteiz, Miranda <strong>de</strong><br />
Ebro y Tolosal<strong>de</strong>a. Al igual que <strong>la</strong> zona <strong>de</strong> Rioja A<strong>la</strong>vesa se trata <strong>de</strong> una zona que reve<strong>la</strong> cierto déficit <strong>de</strong><br />
accesibilidad.<br />
Los siguientes p<strong>la</strong>nos muestran <strong>la</strong>s isocronas en intervalos <strong>de</strong> 15´ <strong>de</strong>s<strong>de</strong> cada uno <strong>de</strong> los puntos<br />
seleccionados en <strong>la</strong> CAPV.<br />
288<br />
Revisión <strong>de</strong>l Segundo P<strong>la</strong>n General <strong>de</strong> Carreteras <strong>de</strong>l País Vasco
<strong>2.</strong>5.7 Accesibilidad territorial<br />
Para cada una <strong>de</strong> <strong>la</strong>s comarcas <strong>de</strong> <strong>la</strong> Comunidad Autónoma Vasca se han calcu<strong>la</strong>do los indicadores <strong>de</strong><br />
Accesibilidad Territorial, los cuales a<strong>de</strong>más <strong>de</strong> aportar elementos <strong>de</strong> diagnóstico respecto a <strong>la</strong> operatividad<br />
<strong>actual</strong> <strong>de</strong> <strong>la</strong> Red <strong>de</strong> Carreteras, van a servir para medir los impactos territoriales <strong>de</strong> <strong>la</strong>s actuaciones que<br />
finalmente se propongan en <strong>la</strong> Revisión <strong>de</strong>l P<strong>la</strong>n <strong>de</strong> Carreteras.<br />
Los indicadores <strong>de</strong> accesibilidad se expresan en distancias (Ad) y en tiempos (At) atien<strong>de</strong>n a <strong>la</strong>s siguientes<br />
fórmu<strong>la</strong>s y son los mismos que los empleados en el P<strong>la</strong>n <strong>de</strong> Carreteras <strong>de</strong>l País Vasco 1999 – 2010:<br />
Don<strong>de</strong>:<br />
Ad j Accesibilidad en distancia <strong>de</strong> <strong>la</strong> comarca j.<br />
Pj<br />
Pob<strong>la</strong>ción <strong>de</strong> <strong>la</strong> comarca j. (Padrón 2001).<br />
Ad j = ∑j Pj dij r / ∑j Pj dij f<br />
Ad t = ∑j Pj tij r / ∑j Pj tij f<br />
dij r Distancia entre i y j medida en <strong>la</strong> <strong>red</strong> sobre el camino <strong>de</strong> tiempo mínimo.<br />
dij f<br />
Distancia entre i y j medido en línea recta (Velocidad = 60 km / h).<br />
Ad t Accesibilidad en tiempo <strong>de</strong> <strong>la</strong> comarca j.<br />
tij r Tiempo entre i y j medido en <strong>la</strong> <strong>red</strong> sobre el camino <strong>de</strong> tiempo mínimo.<br />
tij f Tiempo entre i y j medido en línea recta (Velocidad = 60 km / h).<br />
Los indicadores <strong>de</strong> accesibilidad pon<strong>de</strong>rados por <strong>la</strong> pob<strong>la</strong>ción son más robustos que los que no consi<strong>de</strong>ran<br />
ésta, ya que dicha pon<strong>de</strong>ración evita que los valores <strong>de</strong> los indicadores estén afectados por <strong>la</strong> división zonal<br />
consi<strong>de</strong>rada. Asimismo, con <strong>la</strong> pon<strong>de</strong>ración por <strong>la</strong> pob<strong>la</strong>ción se evita el error <strong>de</strong> valorar, en igual medida, <strong>la</strong><br />
accesibilidad a todas <strong>la</strong>s zonas, in<strong>de</strong>pendientemente <strong>de</strong> su importancia.<br />
El indicador <strong>de</strong> distancias aporta información respecto a <strong>la</strong> eficacia <strong>de</strong> <strong>la</strong> topología <strong>de</strong> <strong>la</strong> <strong>red</strong> <strong>viaria</strong>. Tomará<br />
como mínimo un valor igual a 1, que se daría para una zona que se comunicara con <strong>la</strong>s <strong>de</strong>más con<br />
distancias en <strong>la</strong> <strong>red</strong> iguales a <strong>la</strong>s distancias en línea recta. Cuanto mayor sea el indicador, más separación<br />
hay entre estas distancias y por tanto peor será <strong>la</strong> configuración <strong>de</strong> <strong>la</strong> <strong>red</strong>. Este indicador no aporta<br />
información respecto a <strong>la</strong> “calidad” <strong>de</strong> <strong>la</strong> <strong>red</strong> (velocida<strong>de</strong>s, capacida<strong>de</strong>s, etc.) sino tan sólo respecto a su<br />
tipología.<br />
El indicador <strong>de</strong> tiempos incorpora en <strong>la</strong> medición <strong>de</strong> accesibilida<strong>de</strong>s <strong>la</strong> calidad en <strong>la</strong> <strong>red</strong>, ya que los tiempos<br />
obtenidos en el mo<strong>de</strong>lo <strong>de</strong>pen<strong>de</strong>n tanto <strong>de</strong> <strong>la</strong> velocidad (en régimen libre) en cada tramo, como <strong>de</strong>l nivel <strong>de</strong><br />
congestión que registra, y que es función <strong>de</strong>l tráfico que soporta, <strong>de</strong> su capacidad y <strong>de</strong>l tipo <strong>de</strong> carretera <strong>de</strong><br />
que se trate (autovía, carretera bidireccional en terreno l<strong>la</strong>no, puerto <strong>de</strong> montaña, etc.). En este caso, el<br />
indicador pue<strong>de</strong> resultar menor que 1, ya que los tiempos en línea recta se han calcu<strong>la</strong>do para 60 km/h, que<br />
es una velocidad que se pue<strong>de</strong> superar en <strong>de</strong>terminadas re<strong>la</strong>ciones.<br />
El centroi<strong>de</strong> <strong>de</strong> cada Comarca es el punto <strong>de</strong>s<strong>de</strong> el cual se calcu<strong>la</strong>n <strong>la</strong>s distancias y tiempos sobre <strong>la</strong> <strong>red</strong> y en<br />
línea recta. Se ha incluido el centroi<strong>de</strong> para facilitar el <strong>análisis</strong> <strong>de</strong> los resultados, ya que en algunas comarcas<br />
se dan situaciones <strong>de</strong> accesibilidad bastante distintas entre unos puntos y otros, y <strong>la</strong> que se refleja en este<br />
trabajo es exactamente <strong>la</strong> <strong>de</strong>l centroi<strong>de</strong>.<br />
En los p<strong>la</strong>nos que siguen se muestran los indicadores <strong>de</strong> distancia y <strong>de</strong> tiempo finalmente obtenidos.<br />
294<br />
Revisión <strong>de</strong>l Segundo P<strong>la</strong>n General <strong>de</strong> Carreteras <strong>de</strong>l País Vasco
Las zonas que presentan mejor accesibilidad en distancia son aquel<strong>la</strong>s localizadas en <strong>la</strong>s inmediaciones <strong>de</strong> <strong>la</strong><br />
autopista A-8. En estas zonas <strong>la</strong> re<strong>la</strong>ción entre distancias sobre <strong>la</strong> <strong>red</strong> y en línea recta es buena,<br />
in<strong>de</strong>pendientemente <strong>de</strong> que ambas longitu<strong>de</strong>s sean más o menos gran<strong>de</strong>s en magnitud.<br />
En el <strong>la</strong>do contrario se sitúan zonas como Bermeo - Gernika, Markina, Rioja A<strong>la</strong>vesa y Estribaciones <strong>de</strong>l<br />
Gorbea. Son <strong>la</strong>s Comarcas con accesos menos eficientes a <strong>la</strong> <strong>red</strong> <strong>de</strong> alta capacidad existente en el año 2005.<br />
En tiempos, <strong>la</strong> zona <strong>de</strong> Bilbao, Dosnostial<strong>de</strong>a y Goierri presentan los mejores indicadores, mientras que<br />
Gernika – Bermeo, Markina – Ondarroa y Alto Deba se encuentran en <strong>la</strong> posición contraria. En el primer caso<br />
se sitúan <strong>la</strong>s zonas con centroi<strong>de</strong>s próximos a <strong>la</strong>s vías <strong>de</strong> alta velocidad, que presentan mejores posiciones<br />
en tiempos que en distancias. En el segundo caso se encuentran aquél<strong>la</strong>s que tienen conexiones directas<br />
con el resto <strong>de</strong> <strong>la</strong>s zonas, aunque éstas son lentas.<br />
297<br />
Revisión <strong>de</strong>l Segundo P<strong>la</strong>n General <strong>de</strong> Carreteras <strong>de</strong>l País Vasco