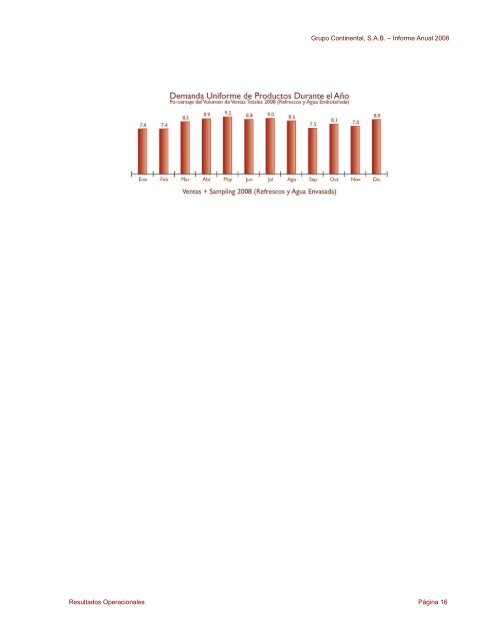
Grupo <strong>Continental</strong>, S.A.B. – Informe Anual 2008 Resultados Operacionales Página 16
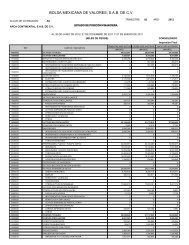
Grupo <strong>Continental</strong>, S.A.B. – Informe Anual 2008 Grupo <strong>Continental</strong>, S.A.B. y Subsidiarias Estado de Resultados Consolidado de 1999 a 2008 Millones de Pesos al 31 de Diciembre Crecimiento Anual Compuesto 1999 - 2008 (10 Años) 2008 2007 2006 2005 2004 2003 2002 2001 2000 1999 Ventas Netas 3.70% 12,826 12,283 11,899 11,469 11,132 11,679 11,910 11,992 11,019 9,843 Costo de Ventas 6,223 5,819 5,613 5,463 5,194 5,433 5,194 5,309 4,958 4,719 Utilidad Bruta 3.80% 6,603 6,464 6,286 6,006 5,938 6,246 6,716 6,683 6,061 5,124 Margen bruto 51.5% 52.6% 52.8% 52.4% 53.3% 53.5% 56.4% 55.7% 55.0% 52.1% Gastos de Operación 4,311 4,334 4,226 4,127 4,086 4,291 4,385 4,324 3,842 3,392 Porcentaje respecto a Ventas Netas 33.6% 35.3% 35.5% 36.0% 36.7% 36.7% 36.8% 36.1% 34.9% 34.5% Utilidad de Operación 3.80% 2,292 2,130 2,060 1,879 1,852 1,955 2,331 2,359 2,219 1,732 Margen de Operación 17.9% 17.3% 17.3% 16.4% 16.6% 16.7% 19.6% 19.7% 20.1% 17.6% Otros Ingresos y Gastos, Neto -194 -139 -19 -149 -248 -154 -216 -233 -231 -187 Costo Integral de Financiamiento -199 -77 -82 -3 41 -118 -143 -57 -100 -47 Participación en Asociadas 140 144 130 162 155 162 131 103 79 183 Utilidad antes de Impuestos 3.90% 2,437 2,212 2,253 1,895 1,718 2,081 2,389 2,286 2,167 1,775 Impuesto a la Utilidad 637 606 593 594 512 746 846 834 852 589 Partida Discontinua 0 0 0 0 0 0 0 33 0 0 Utilidad Neta Consolidada 4.00% 1,800 1,606 1,660 1,301 1,206 1,335 1,543 1,419 1,316 1,186 Utilidad Neta Minoritaria 1 1 1 0 1 0 -3 0 4 -2 Utilidad Neta Mayoritaria 1,799 1,605 1,659 1,301 1,205 1,335 1,546 1,419 1,312 1,188 Margen de utilidad Neta 14.0% 13.1% 13.9% 11.3% 10.8% 11.4% 13.0% 11.8% 11.9% 12.1% UPA 2.40 2.14 2.21 1.73 1.61 1.78 2.06 1.90 1.76 1.59 Acciones 750 750 750 750 750 750 750 749 747 749 Nota: De acuerdo a la nueva NIF B-10 “Efectos de la inflación”, los Estados Financieros de 2007 y años anteriores están expresados en pesos constantes de poder adquisitivo al 31 de diciembre de 2007 y los de 2008 están expresados en pesos nominales. Resultados Financieros 10 años Página 17
- Page 1 and 2: Informe Anual 2008
- Page 3 and 4: Grupo Continental, S.A.B. - Informe
- Page 5 and 6: Grupo Continental, S.A.B. - Informe
- Page 7 and 8: Grupo Continental, S.A.B. - Informe
- Page 9 and 10: Grupo Continental, S.A.B. - Informe
- Page 11 and 12: Grupo Continental, S.A.B. - Informe
- Page 13 and 14: Grupo Continental, S.A.B. - Informe
- Page 15 and 16: Grupo Continental, S.A.B. - Informe
- Page 17: Grupo Continental, S.A.B. - Informe
- Page 21 and 22: Grupo Continental, S.A.B. - Informe
- Page 23 and 24: Grupo Continental, S.A.B. - Informe
- Page 25 and 26: Grupo Continental, S.A.B. - Informe
- Page 27 and 28: Grupo Continental, S.A.B. - Informe
- Page 29 and 30: Grupo Continental, S.A.B. - Informe
- Page 31 and 32: Grupo Continental, S.A.B. - Informe
- Page 33 and 34: Grupo Continental, S.A.B. - Informe
- Page 35 and 36: Grupo Continental, S.A.B. - Informe
- Page 37 and 38: Grupo Continental, S.A.B. - Informe
- Page 39 and 40: Grupo Continental, S.A.B. - Informe
- Page 41 and 42: Grupo Continental, S.A.B. - Informe
- Page 43 and 44: Grupo Continental, S.A.B. - Informe
- Page 45 and 46: Grupo Continental, S.A.B. - Informe
- Page 47 and 48: Grupo Continental, S.A.B. - Informe
- Page 49: www.contal.com