EstadÃsticas de Comercio Exterior de Costa Rica 2012
EstadÃsticas de Comercio Exterior de Costa Rica 2012
EstadÃsticas de Comercio Exterior de Costa Rica 2012

You also want an ePaper? Increase the reach of your titles
YUMPU automatically turns print PDFs into web optimized ePapers that Google loves.
90 Estadísticas <strong>de</strong>l <strong>Comercio</strong> <strong>Exterior</strong><br />
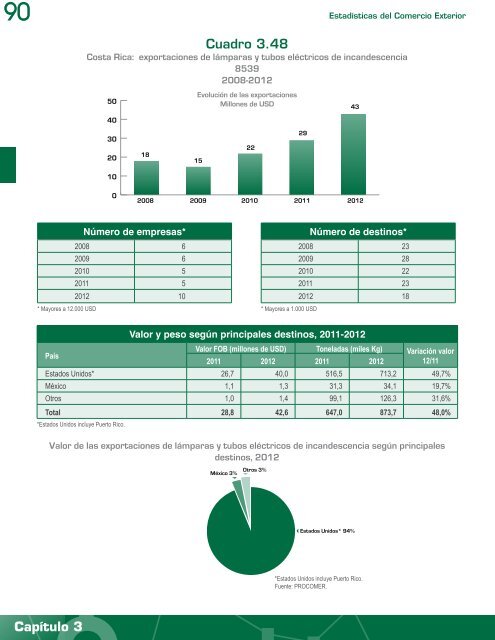
Cuadro 3.48<br />
<strong>Costa</strong> <strong>Rica</strong>: exportaciones <strong>de</strong> lámparas y tubos eléctricos <strong>de</strong> incan<strong>de</strong>scencia<br />
8539<br />
2008-<strong>2012</strong><br />
50<br />
40<br />
30<br />
20<br />
10<br />
18<br />
Evolución <strong>de</strong> las exportaciones<br />
Millones <strong>de</strong> USD<br />
15<br />
22<br />
29<br />
43<br />
0<br />
2008 2009<br />
2010 2011 <strong>2012</strong><br />
* Mayores a 12.000 USD<br />
Número <strong>de</strong> empresas*<br />
2008 6<br />
2009 6<br />
2010 5<br />
2011 5<br />
<strong>2012</strong> 10<br />
* Mayores a 1.000 USD<br />
Número <strong>de</strong> <strong>de</strong>stinos*<br />
2008 23<br />
2009 28<br />
2010 22<br />
2011 23<br />
<strong>2012</strong> 18<br />
País<br />
Valor y peso según principales <strong>de</strong>stinos, 2011-<strong>2012</strong><br />
Valor FOB (millones <strong>de</strong> USD) Toneladas (miles Kg) Variación valor<br />
12/11<br />
2011 <strong>2012</strong> 2011 <strong>2012</strong><br />
Estados Unidos* 26,7 40,0 516,5 713,2 49,7%<br />
México 1,1 1,3 31,3 34,1 19,7%<br />
Otros 1,0 1,4 99,1 126,3 31,6%<br />
Total 28,8 42,6 647,0 873,7 48,0%<br />
*Estados Unidos incluye Puerto Rico.<br />
Valor <strong>de</strong> las exportaciones <strong>de</strong> lámparas y tubos eléctricos <strong>de</strong> incan<strong>de</strong>scencia según principales<br />
<strong>de</strong>stinos, <strong>2012</strong><br />
México 3%<br />
Otros 3%<br />
Estados Unidos* 94%<br />
*Estados Unidos incluye Puerto Rico.<br />
Fuente: PROCOMER.<br />
Capítulo 3