EstadÃsticas de Comercio Exterior de Costa Rica 2012
EstadÃsticas de Comercio Exterior de Costa Rica 2012
EstadÃsticas de Comercio Exterior de Costa Rica 2012

Create successful ePaper yourself
Turn your PDF publications into a flip-book with our unique Google optimized e-Paper software.
<strong>Costa</strong> <strong>Rica</strong> <strong>2012</strong><br />
195<br />
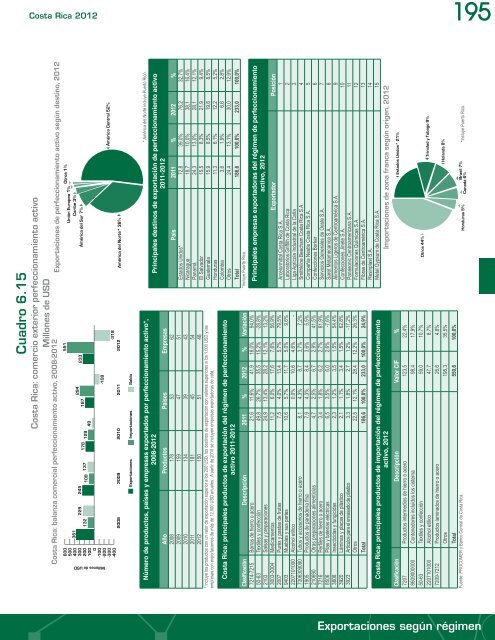
Cuadro 6.15<br />
<strong>Costa</strong> <strong>Rica</strong>: comercio exterior perfeccionamiento activo<br />
Millones <strong>de</strong> USD<br />
<strong>Costa</strong> <strong>Rica</strong>: balanza comercial perfeccionamiento activo, 2008-<strong>2012</strong> Exportaciones <strong>de</strong> perfeccionamiento activo según <strong>de</strong>stino, <strong>2012</strong><br />
600<br />
500<br />
400<br />
300<br />
200<br />
100<br />
0<br />
Millones <strong>de</strong> USD<br />
-100<br />
-200<br />
-300<br />
-400<br />
361<br />
132<br />
229 245<br />
109 137 178 129 49<br />
187<br />
294<br />
-108<br />
2008 2009 2010 2011 <strong>2012</strong><br />
233<br />
551<br />
-318<br />
Unión Europea 1%<br />
Caribe 3%<br />
América <strong>de</strong>l Sur 7%<br />
América <strong>de</strong>l Norte* 36%<br />
Otros 1%<br />
América Central 52%<br />
Exportaciones Importaciones Saldo<br />
Número <strong>de</strong> productos, países y empresas exportados por perfeccionamiento activo*,<br />
2008-<strong>2012</strong><br />
Año Productos Países Empresas<br />
2008 178 53 62<br />
2009 159 47 51<br />
2010 134 39 43<br />
2011 181 45 54<br />
<strong>2012</strong> 150 51 48<br />
* Incluye los productos con un valor <strong>de</strong> exportación superior a los 200 USD, los <strong>de</strong>stinos <strong>de</strong> exportación con valores superiores a los 1.000 USD y las<br />
empresas con exportaciones <strong>de</strong> más <strong>de</strong> 12.000 USD anuales. A partir <strong>de</strong> 2010 se incluyen empresas exportadoras <strong>de</strong> café.<br />
<strong>Costa</strong> <strong>Rica</strong>: principales productos <strong>de</strong> exportación <strong>de</strong>l régimen <strong>de</strong> perfeccionamiento<br />
activo 2011-<strong>2012</strong><br />
Clasificación Descripción 2011 % <strong>2012</strong> % Variación<br />
7214-7215 Barras <strong>de</strong> hierro o acero 21,6 11,6% 41,9 18,0% 94,0%<br />
50-63 Textiles y confección 49,8 26,7% 35,5 15,2% -28,8%<br />
2103 Salsas y preparaciones 24,9 13,4% 28,2 12,1% 13,2%<br />
3003-3004 Medicamentos 11,2 6,0% 17,6 7,6% 56,9%<br />
2007 Purés y pastas <strong>de</strong> frutas 7,5 4,0% 13,4 5,7% 79,5%<br />
9403 Muebles y sus partes 10,6 5,7% 11,7 5,0% 9,6%<br />
2207101000 Alcohol etílico 0,0% 10,6 4,6% -<br />
7306309090 Tubos y accesorios <strong>de</strong> hierro o acero 8,1 4,3% 8,7 3,7% 7,2%<br />
1905 Productos <strong>de</strong> pana<strong>de</strong>ría fina 7,9 4,3% 8,4 3,6% 5,5%<br />
210690 Otras preparaciones alimenticias 4,7 2,5% 6,7 2,9% 41,5%<br />
7216 Perfiles <strong>de</strong> hierro o acero 3,4 1,8% 6,2 2,7% 81,9%<br />
8506 Pilas y baterías eléctricas 6,5 3,5% 6,0 2,6% -7,6%<br />
3808 Insecticidas y fungicidas 2,3 1,2% 3,5 1,5% 54,4%<br />
3920 Láminas y placas <strong>de</strong> plástico 2,1 1,1% 3,4 1,5% 62,8%<br />
3923 Artículos para el envasado <strong>de</strong> plástico 3,3 1,8% 2,7 1,2% -17,2%<br />
Otros 22,5 12,1% 28,4 12,2% 26,3%<br />
Total 186,6 100,0% 233,0 100,0% 24,9%<br />
<strong>Costa</strong> <strong>Rica</strong>: principales productos <strong>de</strong> importación <strong>de</strong>l régimen <strong>de</strong> perfeccionamiento<br />
activo, <strong>2012</strong><br />
Clasificación Descripción Valor CIF %<br />
7207 Productos intermedios <strong>de</strong> hierro o acero 123,5 22,4%<br />
8609000000 Contenedores incluidos los cisterna 98,4 17,9%<br />
50-63 Textiles y confección 59,0 10,7%<br />
2207101000 Alcohol etílico 47,7 8,7%<br />
7209-7212 Productos laminados <strong>de</strong> hierro o acero 26,6 4,8%<br />
Otros 195,3 35,5%<br />
Total 550,6 100,0%<br />
Fuente: PROCOMER y Banco Central <strong>de</strong> <strong>Costa</strong> <strong>Rica</strong>.<br />
* América <strong>de</strong>l Norte incluye Puerto Rico.<br />
Principales <strong>de</strong>stinos <strong>de</strong> exportación <strong>de</strong> perfeccionamiento activo<br />
2011-<strong>2012</strong><br />
País 2011 % <strong>2012</strong> %<br />
Estados Unidos* 72,8 39,0% 76,2 32,7%<br />
Nicaragua 18,7 10,0% 38,1 16,4%<br />
Panamá 24,3 13,0% 28,1 12,1%<br />
El Salvador 15,5 8,3% 21,9 9,4%<br />
Guatemala 15,9 8,5% 19,8 8,5%<br />
Honduras 11,3 6,1% 12,2 5,2%<br />
Colombia 3,6 1,9% 6,6 2,8%<br />
Otros 24,4 13,1% 30,0 12,9%<br />
Total 186,6 100,0% 233,0 100,0%<br />
*Incluye Puerto Rico.<br />
Principales empresas exportadoras <strong>de</strong>l régimen <strong>de</strong> perfeccionamiento<br />
activo, <strong>2012</strong><br />
Exportador Posición<br />
Arcelormittal <strong>Costa</strong> <strong>Rica</strong> S.A. 1<br />
Laboratorios Griffith <strong>de</strong> <strong>Costa</strong> <strong>Rica</strong> 2<br />
Liga Agrícola Industrial <strong>de</strong> la Caña 3<br />
Smithkline Beecham <strong>Costa</strong> <strong>Rica</strong> S.A. 4<br />
Compañía Nestle <strong>Costa</strong> <strong>Rica</strong> S.A. 5<br />
Confecciones Borkar 6<br />
Servicios Generales <strong>de</strong> Oeste S.A. 7<br />
Saret Metamecanica S.A. 8<br />
Alimentos Ligeros <strong>de</strong> Centroamérica S.A. 9<br />
Confecciones Jinete S.A. 10<br />
Panasonic Centroamericana S.A. 11<br />
Formulaciones Químicas S.A. 12<br />
Fibras <strong>de</strong> Centroamérica S.A. 13<br />
Resinplast S.A. 14<br />
Metal Gypsum <strong>de</strong> <strong>Costa</strong> <strong>Rica</strong> S.A. 15<br />
Importaciones <strong>de</strong> zona franca según origen, <strong>2012</strong><br />
Otros 44%<br />
Honduras 5%<br />
Brasil 7%<br />
Canadá 6%<br />
Estados Unidos* 21%<br />
Trinidad y Tobago 9%<br />
Holanda 8%<br />
*Incluye Puerto Rico.<br />
Exportaciones según régimen