2007 Vol. 1 Num. 1 - GCG: Revista de Globalización, Competitividad ...
2007 Vol. 1 Num. 1 - GCG: Revista de Globalización, Competitividad ...
2007 Vol. 1 Num. 1 - GCG: Revista de Globalización, Competitividad ...
You also want an ePaper? Increase the reach of your titles
YUMPU automatically turns print PDFs into web optimized ePapers that Google loves.
The Challenge of the Knowledge Economy for Latin America<br />
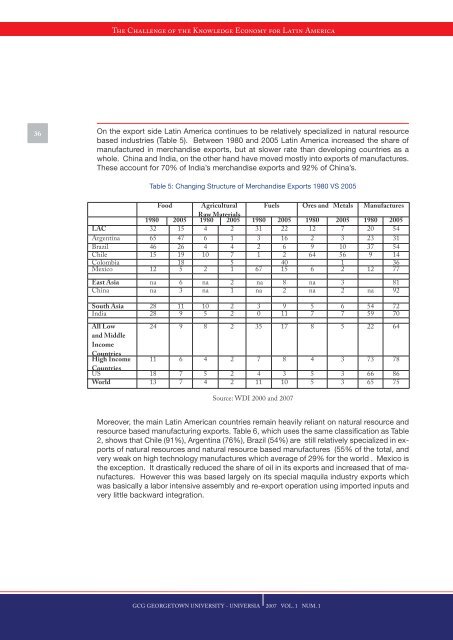
36 On the export si<strong>de</strong> Latin America continues to be relatively specialized in natural resource<br />
based industries (Table 5). Between 1980 and 2005 Latin America increased the share of<br />
manufactured in merchandise exports, but at slower rate than <strong>de</strong>veloping countries as a<br />
whole. China and India, on the other hand have moved mostly into exports of manufactures.<br />
These account for 70% of India’s merchandise exports and 92% of China’s.<br />
Table 5: Changing Structure of Merchandise Exports 1980 VS 2005<br />
Food<br />
Agricultural Fuels Ores and Metals Manufactures<br />
1980 2005<br />
Raw Materials<br />
1980 2005 1980 2005 1980 2005 1980 2005<br />
LAC 32 15 4 2 31 22 12 7 20 54<br />
Argentina 65 47 6 1 3 16 2 3 23 31<br />
Brazil 46 26 4 4 2 6 9 10 37 54<br />
Chile 15 19 10 7 1 2 64 56 9 14<br />
Colombia<br />
Mexico 12<br />
18<br />
5 2<br />
5<br />
1 67<br />
40<br />
15 6<br />
1<br />
2 12<br />
36<br />
77<br />
East Asia na 6 na 2 na 8 na 3 81<br />
China na 3 na 1 na 2 na 2 na 92<br />
South Asia 28 11 10 2 3 9 5 6 54 72<br />
India 28 9 5 2 0 11 7 7 59 70<br />
All Low<br />
24 9 8 2 35 17 8 5 22 64<br />
and Middle<br />
Income<br />
Countries<br />
High Income 11 6 4 2 7 8 4 3 73 78<br />
Countries<br />
US 18 7 5 2 4 3 5 3 66 86<br />
World 13 7 4 2 11 10 5 3 65 75<br />
Source: WDI 2000 and <strong>2007</strong><br />
Moreover, the main Latin American countries remain heavily reliant on natural resource and<br />
resource based manufacturing exports. Table 6, which uses the same classification as Table<br />
2, shows that Chile (91%), Argentina (76%), Brazil (54%) are still relatively specialized in exports<br />
of natural resources and natural resource based manufactures (55% of the total, and<br />
very weak on high technology manufactures which average of 29% for the world . Mexico is<br />
the exception. It drastically reduced the share of oil in its exports and increased that of manufactures.<br />
However this was based largely on its special maquila industry exports which<br />
was basically a labor intensive assembly and re-export operation using imported inputs and<br />
very little backward integration.<br />
<strong>GCG</strong> GEORGETOWN UNIVERSITY - UNIVERSIA <strong>2007</strong> VOL. 1 NUM. 1


