Descargar pdf de la charla de Pedro Prieto
Descargar pdf de la charla de Pedro Prieto
Descargar pdf de la charla de Pedro Prieto

Create successful ePaper yourself
Turn your PDF publications into a flip-book with our unique Google optimized e-Paper software.
Recursos fósiles no convencionales:<br />
Perspectivas tecnológicas<br />
y <strong>de</strong> cuotas <strong>de</strong> <strong>la</strong> <strong>de</strong>manda energética<br />
Val<strong>la</strong>dolid, 18 <strong>de</strong> septiembre <strong>de</strong> 2012<br />
<strong>Pedro</strong> <strong>Prieto</strong> Pérez<br />
Vicepresi<strong>de</strong>nte<br />
Asociación para el Estudio <strong>de</strong> los Recursos Energéticos<br />
(AEREN)
¿Quiénes somos (hoy)<br />
We are addicted to Oil<br />
(Somos adictos al<br />
petróleo)<br />
George W. Bush (2006)
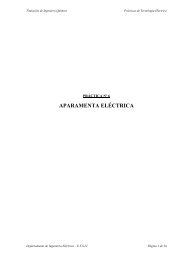
POBLACIÓN HUMANA EN MILES DE MILLONES<br />
¿De dón<strong>de</strong> venimos<br />
1. EL REGISTRO GEOLÓGICO<br />
Formación <strong>de</strong> <strong>la</strong> Tierra<br />
Formación <strong>de</strong> rocas<br />
Primeros signos <strong>de</strong> vida<br />
(Bacterias, algas)<br />
Explosión <strong>de</strong> <strong>la</strong> vida<br />
Cámbrico<br />
Ampliado en 2<br />
Dinosaurios<br />
7<br />
5.000<br />
EN MILONES DE AÑOS<br />
4.000 3.000 2.000 1.000 500<br />
2. LOS PRIMATES Y EL HOMBRE<br />
Últimos ancestros comunes entre<br />
Evolución <strong>de</strong> antiguos primates<br />
el hombre y los chimpancés<br />
Homínidos<br />
HOMO SAPIENS<br />
0<br />
Formación<br />
<strong>de</strong> combustibles<br />
fósiles<br />
6<br />
5<br />
4<br />
20 15 10 7 5<br />
EN MILONES DE AÑOS<br />
Ampliado en 3<br />
0<br />
3<br />
2<br />
Revolución industrial<br />
3. EL DISPARO DE LA POBLACIÓN HUMANA<br />
causado por <strong>la</strong> explotación <strong>de</strong> combustibles fósiles<br />
Edad mo<strong>de</strong>rna<br />
1<br />
Arranque <strong>de</strong> <strong>la</strong> agricultura<br />
9<br />
EN MILES DE AÑOS<br />
8 7<br />
E D A D D E P I E D R A<br />
6 5<br />
4<br />
3 2<br />
E D A D D E B R O N C E<br />
1 a. C. 0 d. C. 1 2<br />
E D A D D E H I E R R O<br />
0<br />
Fuente: William Stanton citado por Nate Hagens y e<strong>la</strong>boración propia
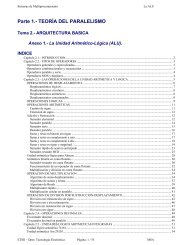
Consumo <strong>de</strong> energía primaria en Exajulios<br />
POBLACIÓN HUMANA EN MILES DE MILLONES<br />
¿De dón<strong>de</strong> venimos<br />
Renovable<br />
7<br />
6<br />
Aviación<br />
comercial<br />
Energía<br />
nuclear<br />
5<br />
Petróleo<br />
4<br />
Motor<br />
<strong>de</strong> vapor<br />
Motor<br />
Motor <strong>de</strong> gasolina<br />
eléctrico<br />
Válvu<strong>la</strong><br />
<strong>de</strong> vacío<br />
Carbón<br />
3<br />
2<br />
LA POBLACIÓN HUMANA<br />
1<br />
Arranque <strong>de</strong> <strong>la</strong> agricultura<br />
9<br />
8 7<br />
E D A D D E P I E D R A<br />
EN MILES DE AÑOS<br />
6 5<br />
4<br />
3 2<br />
E D A D D E B R O N C E<br />
1 a. C. 0 d. C. 1 2<br />
E D A D D E H I E R R O<br />
0<br />
Fuente: William Stanton citado por Nate Hagens. World Economic and Social Survey. United Nations. Overview. 2011. Página VII y e<strong>la</strong>boración propia
¿Qué hacemos<br />
12.000 MTpe<br />
15 TW<br />
Fuente: 2011 World Economic and Social survey UN.<br />
Página 30. Tomado <strong>de</strong> Cullen and Alwood 2009
¿Qué hacemos (en España)<br />
Biomasa<br />
Fuente: Energía en España, 2010. Página 42<br />
Ministerio <strong>de</strong> Industria, Turismo y Comercio<br />
y e<strong>la</strong>boración propia<br />
Hidroeléctrica 5%<br />
Otras Renovables: 6,1
¿Qué hacemos (en España)<br />
Fuerza humana<br />
Fuerza <strong>de</strong> tracción animal<br />
7.000.000 CV<br />
600.000 CV<br />
Cada ciudadano dispone <strong>de</strong> unas 300<br />
veces más potencia insta<strong>la</strong>da que <strong>la</strong> que su<br />
metabolismo ofrece y consume unas<br />
40 veces más que lo que su metabolismo<br />
precisa como mono <strong>de</strong>snudo<br />
23 millones <strong>de</strong> vehículos 1.600.000.000 CV<br />
2.300 millones <strong>de</strong> caballos <strong>de</strong> potencia<br />
a disposición <strong>de</strong> 47 millones <strong>de</strong> españoles<br />
2 millones <strong>de</strong> tractores, autobuses 200.000.000 CV<br />
y camiones<br />
49 caballos <strong>de</strong> potencia por habitante<br />
Maquinaria <strong>de</strong> obras públicas, minera 400.000.000 CV<br />
maquinaria pesada y aviación<br />
Estas máquinas funcionan el 11% <strong>de</strong> su<br />
tiempo en promedio, para consumir los<br />
140 Mtpe <strong>de</strong> energía primaria que<br />
España consume al año<br />
Maquinaria <strong>de</strong> generación <strong>de</strong><br />
energía eléctrica y electrodomésticos<br />
100.000.000 CV
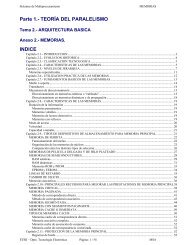
PIB PER CAPITA<br />
NOMINAL EN $<br />
CONSUMO PROMEDIO DE ENERGÍA EN VATIOS DE POTENCIA PROMEDIO PER CAPITA<br />
Otros Europa<br />
LATINOAMÉRICA<br />
Brasil<br />
Chile<br />
Argentina<br />
Venezue<strong>la</strong> Trinidad Tobago<br />
UE 16 A 27<br />
CEI<br />
ORIENTE MEDIO<br />
España<br />
Alemania<br />
JAPÓN<br />
RUSIA<br />
Suiza<br />
Noruega<br />
EE.UU.<br />
Canadá<br />
¿Cómo lo hacemos (en el mundo)<br />
50.000<br />
11.000<br />
BIOMASA<br />
RENOVABLES<br />
HIDROELÉCTRICA<br />
Luxemburgo<br />
40.000<br />
NUCLEAR<br />
CARBÓN<br />
Singapur<br />
UE 15<br />
7.500<br />
GAS NATURAL<br />
PETRÓLEO<br />
Corea <strong>de</strong>l Sur<br />
30.000<br />
Taiwán<br />
5.200<br />
20.000<br />
2.645<br />
PROMEDIO MUNDIAL DE CONSUMO<br />
Sudáfrica<br />
Turquía<br />
Ma<strong>la</strong>sia<br />
Tai<strong>la</strong>ndia<br />
CHINA<br />
10.000<br />
1.415<br />
788<br />
INDIA<br />
ÁFRICA<br />
Egipto<br />
Argelia<br />
ASIA<br />
0<br />
0<br />
1258 2.328 3.747 5.742<br />
HABITANTES EN MILLONES<br />
Fuente: BP Statistical Review of World Energy 2012 para consumos <strong>de</strong> energía. FMI para PIB per capita, Wikipedia para pob<strong>la</strong>ción por países y e<strong>la</strong>boración propia<br />
7.028
En millones <strong>de</strong> Tone<strong>la</strong>das<br />
<strong>de</strong> Petróleo Equivalente<br />
En millones <strong>de</strong> Tone<strong>la</strong>das<br />
<strong>de</strong> Petróleo Equivalente<br />
¿Adón<strong>de</strong> (dicen que) vamos<br />
Previsión <strong>de</strong> aumentos<br />
<strong>de</strong>l consumo total <strong>de</strong><br />
energía <strong>de</strong> entre<br />
el 23% y el 50% en los<br />
próximos 25 años<br />
Demanda <strong>de</strong> energía primaria mundial<br />
Escenario con <strong>la</strong> política actual<br />
Escenario con nuevas políticas<br />
Escenario para <strong>la</strong>s 450 ppm<br />
Previsión <strong>de</strong> aumentos<br />
<strong>de</strong>l consumo total <strong>de</strong><br />
energía fósil <strong>de</strong> un 50%<br />
en los próximos 25 años<br />
en el escenario <strong>de</strong> nuevas<br />
políticas<br />
Demanda <strong>de</strong> energía primaria mundial<br />
En escenario con nuevas políticas<br />
Otras renovables<br />
Biomasa y residuos<br />
Hidroeléctrica<br />
Nuclear<br />
Gas<br />
Carbón<br />
Petróleo<br />
La AIE estima que en<br />
2035 todavía el 71%<br />
<strong>de</strong> toda <strong>la</strong> energía será<br />
<strong>de</strong> origen fósil<br />
Referencia: World Energy Outlook 2011. Agencia Internacional <strong>de</strong> <strong>la</strong> Energía. Páginas 70 (Figura 2.1.) y página 76 (Figura 2.6.)
En miles <strong>de</strong> millones <strong>de</strong> Bpe (GBpe)<br />
En miles <strong>de</strong> millones <strong>de</strong> barriles<br />
<strong>de</strong> petróleo equivalente (GBpe)<br />
¿Adón<strong>de</strong> (algunos creemos que) vamos<br />
Producción mundial histórica y prevista <strong>de</strong> petróleo y gas.<br />
Caso base 2008<br />
Producción mundial histórica y prevista <strong>de</strong> carbón<br />
25<br />
20<br />
2<br />
0<br />
15<br />
10<br />
5<br />
Regu<strong>la</strong>r<br />
Convencional<br />
Pesado y<br />
Ultrapesado<br />
Aguas profundas<br />
y ultraprofundas<br />
Petróleo<br />
po<strong>la</strong>r<br />
Líquidos <strong>de</strong>l<br />
Gas natural<br />
Gas<br />
convencional<br />
Gas no<br />
Convencional<br />
Fuentes: ASPO 2008 Case Base para petróleo y gas. Energy Watch Group. 2007<br />
Report y Energy Wathc Group. Uranium Resources and Nuclear Energy. December 2006<br />
.
¿Qué pasa (últimamente) con el petróleo<br />
Extracción <strong>de</strong> petróleo en re<strong>la</strong>ción con los precios en el<br />
periodo 1997-2011<br />
Fuente C. J. Cooper. Septiembre <strong>de</strong> 2010 tomado <strong>de</strong> <strong>la</strong> AIE y <strong>de</strong> <strong>la</strong> EIA<br />
Fuente: Tom Murphy. Do the Math. Peak Oil Perspective. De un <strong>de</strong>bate con Gail Tverberg y datos <strong>de</strong>l EIA
En miles <strong>de</strong> barriles diarios<br />
¿Qué pasa (últimamente) con el petróleo<br />
90.000<br />
80.000<br />
70.000<br />
60.000<br />
Producción mundial <strong>de</strong> petróleo según varias fuentes y conceptos<br />
Regu<strong>la</strong>r-convencional ASPO<br />
Todos ASPO<br />
EIA<br />
BP<br />
O&GJ<br />
0,5%<br />
La velocidad <strong>de</strong> extracción<br />
y consumo <strong>de</strong> energía fósil<br />
es hoy un millón <strong>de</strong> veces<br />
más rápida que <strong>la</strong><br />
velocidad <strong>de</strong> formación<br />
<strong>de</strong> los yacimientos<br />
50.000<br />
40.000<br />
30.000<br />
20.000<br />
10.000<br />
0<br />
1930<br />
1934<br />
4%<br />
1938<br />
1942<br />
1946<br />
1950<br />
1954<br />
1958<br />
1962<br />
1966<br />
1970<br />
1974<br />
1978<br />
1982<br />
1986<br />
1990<br />
1994<br />
1998<br />
2002<br />
2006<br />
2010<br />
Pues que <strong>de</strong>s<strong>de</strong> 1050 y hasta 1973 estábamos acostumbrados<br />
a crecer en disponibilidad <strong>de</strong> combustibles líquidos <strong>de</strong> calidad<br />
y <strong>de</strong> bajo coste energético <strong>de</strong> extracción a un 6,4% anual<br />
y <strong>de</strong>s<strong>de</strong> hace un siglo a un 4% anual<br />
6%<br />
TODO IBA BIEN: TODO ERA CRECIMIENTO<br />
DESDE 2006, LA<br />
PRODUCCIÓN MUNDIAL<br />
DE PETRÓLEO APENAS<br />
CRECIÓ UN 0,5% ANUAL,<br />
INCLUYENDO TODOS LOS<br />
TIPOS DE COMBUSTIBLES<br />
LÍQUIDOS
La producción mundial <strong>de</strong> petróleo<br />
frena… y comienza a <strong>de</strong>clinar<br />
Des<strong>de</strong> 2004-2005, el petróleo<br />
convencional entra en una<br />
Meseta Ondu<strong>la</strong>nte<br />
(Bumpy P<strong>la</strong>teau)<br />
0,5%<br />
Y <strong>la</strong> producción mundial <strong>de</strong><br />
todos los líquidos combustibles<br />
apenas crece a un 0,5% anual<br />
BRUTO y seguramente <strong>de</strong>crece<br />
en energía NETA<br />
0% --
Los flujos nos llevan al agotamiento<br />
+<br />
30.000 Mb/año<br />
+<br />
4.000 Mb/año<br />
Hace 50 años, se <strong>de</strong>scubrían 30.000<br />
millones <strong>de</strong> barriles al año y se<br />
consumían 4.000 millones. En <strong>la</strong><br />
actualidad, se consumen 30.000 millones<br />
y se <strong>de</strong>scubren 4.000 millones.<br />
Alfonso Guerra, Presi<strong>de</strong>nte <strong>de</strong> <strong>la</strong> Comisión<br />
Constitucional <strong>de</strong>l Congreso <strong>de</strong> los Diputados,<br />
citando a Kjell Aleklett, presi<strong>de</strong>nte <strong>de</strong> ASPO Int’l.<br />
25 <strong>de</strong> junio <strong>de</strong> 2005.<br />
IV Encuentro <strong>de</strong> Políticas <strong>de</strong> <strong>la</strong> Tierra.<br />
Sa<strong>la</strong>manca<br />
4.000 Mb/año<br />
1955 2005<br />
30.000 Mb/año
La ocurrencia <strong>de</strong>l petróleo<br />
De más porosidad a………………………………………….menos porosidad<br />
Y <strong>la</strong> tasa <strong>de</strong> extracción <strong>de</strong> petróleo <strong>de</strong> cualquier roca madre NO es lineal….<br />
como <strong>la</strong> <strong>de</strong> un <strong>de</strong>pósito <strong>de</strong> gasolina <strong>de</strong> coche……. sino más bien como una esponja<br />
120 Km/h 8 litros/100 Km<br />
0 Km/h 0 litros/100 Km<br />
Fuente: Mariano Marzo. Hubbert’s Peak: The Impending World Oil Shortage,<br />
Kenneth S. Deffeyes (Princeton University Press, 2001)<br />
Poco agua Mucha agua (cenit) poco agua<br />
Poco esfuerzo Esfuerzo medio gran esfuerzo
Aún no se reconocen los límites <strong>de</strong> <strong>la</strong><br />
producción <strong>de</strong> combustibles convencionales y..<br />
…ya estamos abogando<br />
por los nuevos mi<strong>la</strong>gros<br />
energéticos.<br />
Es sorpren<strong>de</strong>nte el regocijo<br />
con el que se <strong>la</strong>nzan los<br />
apologistas a por <strong>la</strong>s<br />
migajas energéticas, sin<br />
siquiera haber reconocido<br />
el problema <strong>de</strong>l cenit <strong>de</strong><br />
los combustibles <strong>de</strong> alta<br />
calidad
Factibilidad <strong>de</strong> <strong>la</strong><br />
Recuperación económica<br />
¿Cómo c<strong>la</strong>sificar los recursos<br />
No <strong>de</strong>jarse engañar por supuestos<br />
“Recursos” muy abundantes<br />
Reservas Probadas (1P ó P90)<br />
(Únicas permitidas por <strong>la</strong> SEC para el reporte<br />
hasta diciembre <strong>de</strong> 2009)<br />
Reservas Probables (2P ó P50)<br />
(Probadas + Probables)<br />
(Permitidas por <strong>la</strong> SEC para el reporte<br />
<strong>de</strong>s<strong>de</strong> diciembre <strong>de</strong> 2009)<br />
RESERVAS<br />
Reservas Posibles (3P ó P10)<br />
(Probadas + Probables + Posibles)<br />
(Permitidas por <strong>la</strong> SEC para el reporte<br />
<strong>de</strong>s<strong>de</strong> diciembre <strong>de</strong> 2009)<br />
RECURSOS<br />
Grado <strong>de</strong> certidumbre<br />
geológica
¿Qué son los recursos fósiles<br />
no convencionales<br />
• Las “reservas probadas” <strong>de</strong> petróleo y gas son <strong>la</strong> base <strong>de</strong> <strong>la</strong>s valoraciones <strong>de</strong> <strong>la</strong>s compañías petrolíferas y <strong>de</strong><br />
<strong>la</strong>s futuras producciones.<br />
• Los fundamentos científicos para <strong>la</strong> estimación <strong>de</strong> <strong>la</strong>s reservas<br />
(incluídas <strong>la</strong>s no convencionales) tienen más <strong>de</strong> 70 años.<br />
• El petróleo inicialmente en el lugar (Original oil in p<strong>la</strong>ce ó OOIP)<br />
tienen que ser primero estimadas.<br />
• Después, se estima <strong>la</strong> cantidad <strong>de</strong> OOIP<br />
que es técnica y económicamente recuperable.<br />
• Antes <strong>de</strong> que fluya el petróleo o el gas, se realizan estimaciones volumétricas.<br />
• Despues que el petróleo o el gas surgen, es más fácil realizar <strong>la</strong>s estimaciones durante un tiempo<br />
•A medida que los campos envejecen vuelve a ser más difícil realizar lo que queda por recuperar.<br />
Fuente: Will The Proved Reserve Scandal Open The Door To Genuine Data Reform Reserve Reporting Conference. The Energy Forum. Houston, Texas. April 14, 2004<br />
Mattew Simmons
Si quedasen suficientes campos <strong>de</strong><br />
petróleo y gas <strong>de</strong> alta calidad…
…¿por qué habría que ir tan lejos,<br />
tan profundo y a yacimientos tan pobres<br />
Columna <strong>de</strong> agua<br />
2.000 a 3.000 m.<br />
profundidad<br />
Estrato rocoso 2.000 m grosor<br />
Capa <strong>de</strong> sal 200m. grosor<br />
Yacimiento<br />
Bahía <strong>de</strong> Santos en Brasil: Extracción<br />
a profundidad <strong>de</strong> 20 veces <strong>la</strong> altura<br />
<strong>de</strong> <strong>la</strong> torre Eiffel
El síndrome <strong>de</strong> <strong>la</strong>s“Bodas <strong>de</strong> Canaán”<br />
en el aporte <strong>de</strong> petróleo mundial<br />
Cuando el maestresa<strong>la</strong> probó el agua convertida<br />
en vino, como ignoraba <strong>de</strong> dón<strong>de</strong> venía<br />
(los sirvientes, que habían sacado el agua,<br />
sí lo sabían), l<strong>la</strong>ma al novio y le dice:<br />
«Todos sirven primero el vino bueno<br />
y cuando ya todos están bebidos, el inferior”.<br />
Juan, 2, 6-10<br />
Fuentes: Base <strong>de</strong> datos <strong>de</strong> ASPO. 2008<br />
Giotto di Bondone (1267-1337). La boda <strong>de</strong> Canaán.
Tipos <strong>de</strong> petróleo<br />
y cronología <strong>de</strong> su explotación<br />
West Texas Intermediate (WTI) - North American Light & Sweet Cru<strong>de</strong><br />
Iranian Light - Light Cru<strong>de</strong><br />
Tia Juana Light Venezue<strong>la</strong> - Light, Medium & Heavy Cru<strong>de</strong><br />
Arabian Extra Light - Light Cru<strong>de</strong><br />
Minas Indonesia - Light & Heavy Far East Cru<strong>de</strong><br />
Greater Burgan, Kuwait - Very Light & Light Cru<strong>de</strong><br />
Arab Light Saudi Arabia - Light & Sweet Cru<strong>de</strong><br />
Isthmus Light - Mexico in the Gulf of Mexico - Light Cru<strong>de</strong><br />
Fateh Dubai - Light Cru<strong>de</strong><br />
Bonny Light - Bonny region of Nigeria - Light Cru<strong>de</strong><br />
Saharan Blend Algeria- Sweet Cru<strong>de</strong><br />
Nasser, Libya - Light, Sweet & Heavy Cru<strong>de</strong><br />
Brent Sweet Light Cru<strong>de</strong>, Oseberg and Forties<br />
Ekofisk, Norway - Light Cru<strong>de</strong><br />
Arabian Heavy - Heavy Cru<strong>de</strong><br />
Iranian Heavy - Heavy Cru<strong>de</strong><br />
A<strong>la</strong>ska Cru<strong>de</strong> - Heavy Cru<strong>de</strong><br />
Athabasca Oil Sands - Alberta, Canada - Heavy Cru<strong>de</strong><br />
Venezue<strong>la</strong> Orinoco Oil Belt - Heavy Cru<strong>de</strong><br />
Olenik Oil Sands - Siberia, Russia - Heavy Cru<strong>de</strong><br />
Primero los<br />
buenos<br />
y cada vez a los <strong>de</strong><br />
grado<br />
más inferior
Fases <strong>de</strong> extracción <strong>de</strong>l hidrocarburo<br />
RECUPERACIÓN PRIMARIA.<br />
Es <strong>la</strong> primera etapa <strong>de</strong> producción <strong>de</strong> petróleo y gas, en el que se utilizan <strong>la</strong>s fuerzas <strong>de</strong>l yacimiento<br />
para recuperar los hidrocarburos. Debido a <strong>la</strong> diferencia <strong>de</strong> presión entre el yacimiento y el fondo<br />
<strong>de</strong>l pozo, loshidrocarburos son empujados a <strong>la</strong> superficie. En esta fase se recupera habitualmente<br />
entre el 12 y el 15% <strong>de</strong> los hidrocarburos que contiene.<br />
RECUPERACIÓN SECUNDARIA<br />
Fase que implica <strong>la</strong> necesidad <strong>de</strong> represurizar el pozo o <strong>de</strong> inyectar agua en el yacimiento para<br />
mantener <strong>la</strong> presión y conseguir que siga saliendo el hidrocarburo. Esto ayuda a extraer hasta<br />
aproximadamente un 15 ó 20% más <strong>de</strong>l hidrocarburo originalmente en el sitio<br />
RECUPERACIÓN TERCIARIA<br />
Implica <strong>la</strong> recuperación <strong>de</strong> hidrocarburo mediante métodos complejos y muy costosos,<br />
tales como <strong>la</strong> inyección <strong>de</strong> vapor, productos químicos, áridos, gases, acción microbiana,<br />
calor o una combinacióon <strong>de</strong> ellos. Para el petróleo, también se conoce como<br />
Enhanced Oil Recovery (EOR) o el petróleo que se intenta recuperar cuando <strong>la</strong><br />
Recuperación Primaria y Secundaria se han agotado.
Sal<br />
Ladrillo<br />
La permeabilidad <strong>de</strong>fine <strong>la</strong> viabilidad<br />
PERMEABILIDAD<br />
La permeabilidad <strong>de</strong> <strong>la</strong>s pizarras es mucho más baja<br />
que <strong>la</strong> <strong>de</strong> <strong>la</strong>s rocas compactas y <strong>la</strong> <strong>de</strong>l gas convencional<br />
Gas <strong>de</strong> pizarra<br />
Gas <strong>de</strong> roca<br />
compacta<br />
Gas convencional<br />
No convencional<br />
Fuente:Dr. Werner Zittel. Ludwig-Bölkow-Systemtechnik GmbH · Ottobrunn. ASPO X Viena Junio 2012
DESCUBIERTAS<br />
POR DESCUBRIR<br />
COMERCIAL<br />
SUBCOMERCIAL<br />
La gran estafa piramidal<br />
<strong>de</strong> <strong>la</strong>s reservas/recursos<br />
PRODUCCIÓN<br />
RESERVAS<br />
1P 2P 3P<br />
PROBADAS<br />
PROBABLES<br />
POSIBLES<br />
POSIBILIDADES<br />
DE DESARROLLO<br />
El “mito” <strong>de</strong> <strong>la</strong> escasez <strong>de</strong> petróleo<br />
Las “reservas” <strong>de</strong> petróleo<br />
estadouni<strong>de</strong>nse <strong>de</strong> <strong>la</strong>s que<br />
hab<strong>la</strong> Obama, apenas son<br />
<strong>la</strong> cúspi<strong>de</strong> <strong>la</strong> <strong>de</strong> pirámi<strong>de</strong><br />
22.000 Mb <strong>de</strong> reservas “probadas”<br />
400.000 Millones <strong>de</strong> barriles <strong>de</strong> petróleo<br />
“técnicamente recuperable”<br />
RECURSOS CONTINGENTES<br />
800.000 Mb <strong>de</strong> petróleo<br />
<strong>de</strong> esquistos<br />
IRRECUPERABLES<br />
RECURSOS PROSPECTIVOS<br />
POSIBILIDADES DE<br />
DESCUBRIMIENTO<br />
Fuentes:<br />
2,3 Billones<br />
<strong>de</strong> barriles <strong>de</strong><br />
“recursos<br />
no <strong>de</strong>scubiertos”<br />
IRRECUPERABLES<br />
Fuente: Dr Euan Mearns Honorary Research Fellow euan.mearns@abdn.ac.uk ASPO X Vienna June 1st. 2012
¿Qué son los recursos fósiles<br />
no convencionales<br />
• El <strong>de</strong>clive <strong>de</strong> un campo ya en producción es lo más fácil <strong>de</strong> estimar.<br />
• No hay divisiones c<strong>la</strong>ras entre cada concepto o tipo <strong>de</strong> petróleo o gas<br />
• Las divisiones <strong>de</strong> <strong>la</strong> pirámi<strong>de</strong> <strong>de</strong>l valor <strong>de</strong> <strong>la</strong>s reservas son estimadas.<br />
Probabilidad <strong>de</strong> acertar<br />
90% Producción probada: los pozos están perforados<br />
y fluye el combustible<br />
80% Reservas probadas, pero todavía sin <strong>de</strong>sarrol<strong>la</strong>r<br />
50% Reservas probables: pue<strong>de</strong>n o no ser producibles<br />
20% Reservas contingentes o prospectivas: alto riesgo<br />
Fuente: Will The Proved Reserve Scandal Open The Door To Genuine Data Reform Reserve Reporting Conference. The Energy Forum. Houston,<br />
Texas. April 14, 2004. Mattew Simmons
La pirámi<strong>de</strong> <strong>de</strong> los Recursos Fósiles<br />
(Escenario vaso medio lleno)<br />
18%<br />
CARBÓN<br />
1149<br />
PETRÓLEO<br />
1148<br />
GAS<br />
550<br />
PRODUCIDO/EXTRAÍDO<br />
2,8 BILLONES DE BPE<br />
36%<br />
46&<br />
CARBÓN<br />
3092<br />
PETRÓLEO<br />
2.800<br />
PETRÓLEO<br />
1383<br />
1235<br />
GAS<br />
GAS DE ESQUISTOS<br />
O PIZARRAS<br />
2813<br />
RESERVAS CONVENCIONALES 2P<br />
5,7 BILLONES DE BPE<br />
RECURSOS<br />
NO CONVENCIONALES<br />
7,33 BILLONES DE BPE<br />
MENOR TRE<br />
MAYOR COSTE<br />
MAYOR<br />
CONTAMINACIÓN<br />
ARENAS ASFÁLTICAS 409<br />
METANO DE LECHO DE CARBÓN (CBM) 902<br />
RECUPERACIÓN MEJORADA<br />
DE PETRÓLEO 127 TIGHT GAS ( Gas <strong>de</strong> roca compacta o prieta) 278<br />
• Coal, oil and gas production from 1830 IHS, BP, Smil compiled by Campbell and Koppe<strong>la</strong>ar<br />
• 2P reserves from BP Statistical Review 2011<br />
• Shale gas – World Energy Council 2010<br />
• Oil Shale – 33 countries, USGS report 2005-5294<br />
• Tar sands – Oil and Gas Journal<br />
• EOR @ 5% of conventional production and reserves<br />
• Tight gas and coal bed methane from Mohr Case 3 (PhD thesis)<br />
Fuente: Dr Euan Mearns Honorary Research Fellow euan.mearns@abdn.ac.uk ASPO X Vienna June 1st. 2012
La pirámi<strong>de</strong> <strong>de</strong> los Recursos Fósiles<br />
(Escenario vaso medio vacío)<br />
35%<br />
CARBÓN<br />
1149<br />
PETRÓLEO<br />
1148<br />
GAS<br />
550<br />
PRODUCIDO/EXTRAÍDO<br />
2,8 BILLONES DE BPE<br />
51%<br />
14&<br />
1481<br />
CARBÓN<br />
PETRÓLEO<br />
1387<br />
1230<br />
GAS<br />
RESERVAS CONVENCIONALES<br />
4,1 BILLONES DE BPE<br />
RECURSOS<br />
NO CONVENCIONALES<br />
1,12 BILLONES DE BPE<br />
MENOR TRE<br />
MAYOR COSTE<br />
MAYOR<br />
CONTAMINACIÓN<br />
ARENAS ASFÁLTICAS 404<br />
GAS DE ESQUISTOS O PIZAARRAS 45<br />
METANO DE LECHO DE CARBÓN (CBM) 902<br />
RECUPERACIÓN MEJORADA<br />
DE PETRÓLEO 127 TIGHT GAS ( Gas <strong>de</strong> roca compacta o prieta) 142<br />
• Coal, oil and gas production from 1830 IHS, BP, Smil compiled by Campbell and Koppe<strong>la</strong>ar<br />
• Coal, oil and gas reserves, Rutledge: Energy Supplies and Climate Policy: http://www.theoildrum.com/no<strong>de</strong>/9163<br />
• Tar, tight, CBM and Shale gas from Mohr Case 1 (PhD thesis)<br />
• EOR @ 5% of conventional production and reserves<br />
Fuente: Dr Euan Mearns Honorary Research Fellow euan.mearns@abdn.ac.uk ASPO X Vienna June 1st. 2012
Hablemos <strong>de</strong> pizarras….<br />
En <strong>la</strong> producción <strong>de</strong> petróleo y gas NO CONVENCIONAL,<br />
lo “no convencional” no es ni el petróleo ni el gas;<br />
ES EL MÉTODO DE EXTRACCIÓN DE LOS MISMOS
El petróleo y el gas <strong>de</strong> pizarra<br />
o esquistos<br />
Un pozo <strong>de</strong> perforación vertical barato pue<strong>de</strong> acce<strong>de</strong>r a todo el gas<br />
Arenisca<br />
Características <strong>de</strong> buena calidad<br />
Yacimiento convencional <strong>de</strong> arenisca<br />
• Alta porosidad<br />
• Alta permeabilidad<br />
• Alto nivel <strong>de</strong> saturación <strong>de</strong> petróleo o gas<br />
• Buena conectividad<br />
Pizarra<br />
Un pozo caro <strong>de</strong> perforación horizontal pue<strong>de</strong> per<strong>de</strong>r todo el gas<br />
Lentes <strong>de</strong> arenisca<br />
Características <strong>de</strong> un yacimiento <strong>de</strong> gas <strong>de</strong> pizarra<br />
• Baja porosidad<br />
• Baja permeabilidad<br />
• Bajo nivel <strong>de</strong> saturación <strong>de</strong> petróleo o gas<br />
•Lentes <strong>de</strong>sconectadas<br />
Pizarra<br />
La fractura (Fracking) conecta <strong>la</strong>s lentes llenas <strong>de</strong> gas<br />
al pozo <strong>de</strong> perforación<br />
Fuente: Dr Euan Mearns Honorary Research Fellow euan.mearns@abdn.ac.uk ASPO X Vienna June 1st. 2012
La diferencia esencial entre petróleo <strong>de</strong><br />
pizarra y pizarras con kerógeno<br />
Lentes <strong>de</strong> arenisca<br />
Petróleo en lentes <strong>de</strong> arenisca<br />
El petróleo <strong>de</strong> pizarra, es análogo<br />
al gas <strong>de</strong> pizarra; es <strong>de</strong>cir, es petróleo real<br />
en un yacimiento <strong>de</strong> calidad muy pobre.<br />
Se pue<strong>de</strong> producir (extraer) mediante<br />
costosos pozos horizontales y fractura<br />
Pizarra o esqusitos<br />
• Los recursos técnicamente recuperables <strong>de</strong><br />
petróleo <strong>de</strong> pizarras en EE. UU. son <strong>de</strong> unos<br />
24.000 millones <strong>de</strong> barriles (EIA)<br />
• Los recursos <strong>de</strong> pizarras con kerógeno en el<br />
sitio son unos 2,1 billones <strong>de</strong> barriles (USGS)<br />
La pizarra con kerógeno es una pizarra real, rica<br />
en materia orgánica l<strong>la</strong>mada kerógeno, que es<br />
el precursor <strong>de</strong>l petróleo. Para extraer petróleo<br />
<strong>de</strong> estas pizarras se necesita minería a cielo abierto<br />
y <strong>de</strong>spués “cocinar” el kerógeno para convertir <strong>la</strong><br />
matería orgánica en petróleo. Lo que <strong>la</strong> naturaleza<br />
ha tardado millones <strong>de</strong> años, hecho en días.<br />
Fuente: Dr Euan Mearns Honorary Research Fellow euan.mearns@abdn.ac.uk ASPO X Vienna June 1st. 2012
Costes y riesgos mayores<br />
Tecnología más avanzada<br />
¿No estaremos c<strong>la</strong>sificando como AAA<br />
bonos basura y activos tóxicos energéticos<br />
DEL<br />
"Estamos en <strong>la</strong> Champions League <strong>de</strong> <strong>la</strong><br />
economía"<br />
(11 <strong>de</strong> septiembre <strong>de</strong> 2007).<br />
"Somos <strong>la</strong> octava potencia mundial,<br />
<strong>la</strong> envidia <strong>de</strong> Europa y pronto superaremos<br />
a Francia como ya hemos hecho con Italia”<br />
Los hidrocarburos <strong>de</strong> esquistos o pizarras no son<br />
ni un renacimiento ni una revolución. Apenas<br />
resultan ser una rebusca en el basurero energético<br />
Calidad media-alta<br />
Petróleo <strong>de</strong><br />
baja<br />
permeabilidad<br />
Gas <strong>de</strong><br />
arenas<br />
compactas<br />
AL<br />
Gas <strong>de</strong><br />
pizarras<br />
Petróleo<br />
pesado<br />
Gas <strong>de</strong><br />
lecho <strong>de</strong><br />
carbón<br />
Hidratos<br />
(C<strong>la</strong>tratos)<br />
<strong>de</strong> metano<br />
Kerógeno<br />
en pizarras<br />
(Oil shale)<br />
El Foro Económico Mundial (FEM) sitúa a España<br />
en el puesto 122º —<strong>de</strong> una lista conformada por 144 países—<br />
entre los que más obstáculos presenta para obtener préstamos<br />
(5 <strong>de</strong> septiembre <strong>de</strong> 2012)<br />
Fuentes: Standard & Poors. Sovereign Government Rating Methodology And Assumptions<br />
Traditional Energy – Still Our Energy Future. C. Michael Ming. http://www.searchanddiscovery.com/documents/2011/70111ming/ndx_ming.<strong>pdf</strong>
La Tasa <strong>de</strong> Retorno Energético (TRE)<br />
Petróleo y gas <strong>de</strong> EE. UU.<br />
TRE promedio exigido<br />
para mover <strong>la</strong> sociedad<br />
industr<strong>la</strong>l (Hall y co<strong>la</strong>boradores)<br />
Petróleo <strong>de</strong> pizarras<br />
Arenas asfálticas<br />
Pizarras con kerógeno<br />
El precipicio <strong>de</strong> <strong>la</strong> energía neta<br />
Tasa <strong>de</strong> Retorno Energético (TRE o ERoEI en inglés)<br />
Energía para<br />
<strong>la</strong> sociedad<br />
Energía utilizada para obtener energía
¿Qué pasa con los yacimientos <strong>de</strong><br />
pizarra¿Quien li<strong>de</strong>ra el movimiento<br />
Los EE. UU. empezaron a forzar<br />
<strong>la</strong> máquina, con <strong>la</strong> aplicación frenética<br />
<strong>de</strong> tecnologías <strong>de</strong> todo tipo.<br />
Producción <strong>de</strong> petróleo pesado en ya cimientos seleccionados <strong>de</strong> EE. UU.<br />
Miles <strong>de</strong> barriles diarios<br />
• El petróleo y el gas <strong>de</strong> esquistos<br />
pasaron a ser objetivos prioritarios.<br />
• Biocombustibles utilizando alimentos<br />
• Explotaciones en el Círculo Po<strong>la</strong>r<br />
• Explotaciones en aguas ultraprofundas<br />
Fuente: Energy Information Administration <strong>de</strong> los EE. UU. basado en HPDI, LLC, 2011 es hasta noviembre
¿Qué pasa con los yacimientos <strong>de</strong><br />
pizarra¿Quien li<strong>de</strong>ra el movimiento<br />
Sólo <strong>la</strong> cuenca <strong>de</strong> Barnett ha perforado tanto<br />
para obtener gas como toda Rusia, pero<br />
con un rendimiento <strong>de</strong> explotación <strong>de</strong> menos<br />
<strong>de</strong> 200 veces que Rusia en m 3 <strong>de</strong> gas obtenidos<br />
por pozo<br />
1.000 m 3 <strong>de</strong> gas <strong>de</strong> Barnett necesitan:<br />
• 100 Kg <strong>de</strong> arena fina<br />
• 2.000 litros <strong>de</strong> agua limpia<br />
• 40 litros <strong>de</strong> químicos muy corrosivos<br />
• La mitad <strong>de</strong>l agua vuelve a subir y hay<br />
que procesar<strong>la</strong> para quitar los químicos<br />
El gas natural que tiene un 6% <strong>de</strong> N 2<br />
se pue<strong>de</strong> tratar, pero el gas po<strong>la</strong>co <strong>de</strong> esquistos<br />
llega a tener un 50% <strong>de</strong> N 2<br />
Fuente: Shale gas: the view from Russia. Dimitri Orlov y The Oil Crash
En miles <strong>de</strong> millones <strong>de</strong> m3<br />
Recursos y reservas <strong>de</strong> gas natural en Europa<br />
Gas <strong>de</strong> lecho <strong>de</strong> carbón<br />
Recursos<br />
Recursos <strong>de</strong> gas<br />
<strong>de</strong> pizarra<br />
Consumo mundial<br />
<strong>de</strong> gas en un año<br />
Recursos convencionales<br />
Reservas convencionales<br />
Fuente:Dr. Werner Zittel. Ludwig-Bölkow-Systemtechnik GmbH · Ottobrunn. ASPO X Viena Junio 2012
1990<br />
1991<br />
1992<br />
1993<br />
1994<br />
1995<br />
1996<br />
1997<br />
1998<br />
1999<br />
2000<br />
2001<br />
2002<br />
2003<br />
2004<br />
2005<br />
2006<br />
2007<br />
2008<br />
2009<br />
2010<br />
Evolución <strong>de</strong> <strong>la</strong> producción <strong>de</strong> gas en<br />
EE. UU. y perspectivas según agencias<br />
US Gas production<br />
700<br />
600<br />
bcm<br />
500<br />
400<br />
300<br />
200<br />
100<br />
0<br />
Fuentes: The Role of Unconventional Gas in US Supply. Centre for global Energy Studies<br />
http://www.cges.co.uk/resources/articles/2010/08/02/the-role-of-unconventional-gas-in-us-supply<br />
BP Statistical Review of World Energy. Report 2011<br />
U.S. Energy Information Administration | Annual Energy Outlook 2012 Early Release Overview
Perfiles <strong>de</strong> <strong>de</strong>clive <strong>de</strong> los yacimientos <strong>de</strong> gas<br />
en EE. UU. y estructura <strong>de</strong> producción<br />
Cerca <strong>de</strong> <strong>la</strong><br />
mitad <strong>de</strong> <strong>la</strong><br />
producción<br />
<strong>de</strong> EE. UU.<br />
proviene <strong>de</strong><br />
pozos perforados<br />
En los últimos<br />
3 años y el 25-30%<br />
<strong>de</strong> pozos<br />
perforados<br />
sólo el pasado<br />
año<br />
Las tasas <strong>de</strong> <strong>de</strong>clino total <strong>de</strong>l gas natural en los EE. UU.<br />
han aumentado con el gas <strong>de</strong> esquistos<br />
Fuente: Is it time to build natural gas. Investletters.com http://investletters.com/blog/is-it-time-to-buy-natural-gas/<br />
Arthur E. Berman Labyrinth Consulting Services, Inc. ASPO Conference 2012 Vienna, Austria May 30, 2012
Una imagen vale más que mil pa<strong>la</strong>bras<br />
Aumentos <strong>de</strong> <strong>la</strong>s<br />
perforaciones en<br />
búsqueda <strong>de</strong> gas<br />
no convencional,<br />
frente a los <strong>de</strong>clives<br />
<strong>de</strong> <strong>la</strong> producción<br />
6.000 $/mes <strong>de</strong> leasing<br />
<strong>de</strong>l terreno ¿Y qué
Técnicas y ocupación <strong>de</strong> superficie<br />
<strong>de</strong>l gas no convencional<br />
6 etapas <strong>de</strong> FH por pozo<br />
Crecimiento vertical favorecido<br />
Arena como propelente<br />
Zonas di<strong>la</strong>tadas<br />
Zona<br />
drenada<br />
El emp<strong>la</strong>zamiento <strong>de</strong> Encana en 2011<br />
(NE British Columbia) con 16 pozos consumió:<br />
• 1.576 millones <strong>de</strong> litros <strong>de</strong> agua (98 M litros/pozo)<br />
• 78, 4 millones <strong>de</strong> kilos <strong>de</strong> arena<br />
• 30 millones <strong>de</strong> litros <strong>de</strong> productos químicos para fractura (2% <strong>de</strong>l agua)<br />
• 500 etapas <strong>de</strong> fracturación (unas 32 por pozo)<br />
• 40.000 CV <strong>de</strong> potencia para bombear el fluido para fracturar<br />
Fuente: Massive Multi-Stage Hydraulic Fracturing: Where are We Maurice Dusseault, University of Waterloo John McLennan, University of Utah<br />
http://www.armarocks.org/documents/newsletters/dussealt_massive_multistage_hydrolic_fracturing.<strong>pdf</strong><br />
Unconventional Gas Development from Shale P<strong>la</strong>ys: How It Works, and Some Environmental Impacts. A. R. Ingraffea, PhD. Cornell University. ASPO USA COnference 2011. Washington November 3 2011
¿Qué pasa con los yacimientos <strong>de</strong> pizarra<br />
La locura <strong>de</strong>l hidrocarburo difícil<br />
El canto <strong>de</strong>l cisne <strong>de</strong>l gas natural<br />
Fuentes: http://explow.com/The_Environmental_Impact_of_Hydraulic_Fracking Google Earth,
Riesgos potenciales <strong>de</strong> <strong>la</strong> produccion <strong>de</strong><br />
gas no convencional<br />
Emisiones aéreas:<br />
• Benzol (Texas)<br />
• Emisiones <strong>de</strong> compuestos volátiles orgánicos (VOC) Be<strong>la</strong>stung en Texas<br />
• CO2 <strong>de</strong> los yacimientos (Pizarras <strong>de</strong> Antrim)<br />
• Los habitantes sufren dolores <strong>de</strong> cabeza (no son eventos singu<strong>la</strong>res)<br />
• Contaminación directa durante los apagones <strong>de</strong> mecheros<br />
• Emisiones <strong>de</strong>l tráfico pesado y <strong>de</strong> <strong>la</strong>s estaciones <strong>de</strong> compresión en áreas rurales<br />
TODO ELLO, A PESAR DEL<br />
TRIPLE ENCAPSULADO DEL<br />
TUBO DE PERFORACIÓN<br />
HASTA POR DEBAJO<br />
DEL ACUÍFERO<br />
Contaminación <strong>de</strong>l agua:<br />
• Más <strong>de</strong> 100 lugares i<strong>de</strong>ntificados <strong>de</strong> contaminación local <strong>de</strong>l agua subterránea/TEDX<br />
•Las pruebas <strong>de</strong> <strong>la</strong> Agencia <strong>de</strong> Protección Ambiental (EPA) muestran que un 25% <strong>de</strong> los pozos<br />
investigados estaban contaminados.<br />
• Gas y/o Benzeno, Tolueno, etilbenceno y xilenos (BTEX) en acuíferos <strong>de</strong> agua potable (Pennsylvania y Texas)<br />
Emisiones <strong>de</strong> ruidos<br />
• Torres <strong>de</strong> perforación, compresores,<br />
purificación <strong>de</strong> gas, vehículos pesados<br />
Tierra:<br />
•Difusiones incontro<strong>la</strong>das en el subsuelo<br />
Consumo <strong>de</strong> territorio<br />
. Áreas y p<strong>la</strong>taformas <strong>de</strong> perforación<br />
. Estanques para el agua contaminada<br />
. Estanques para agua dulce<br />
. Carreteras en áreas rurales<br />
Fuente:Dr. Werner Zittel. Ludwig-Bölkow-Systemtechnik GmbH · Ottobrunn. ASPO X Viena Junio 2012
Millones <strong>de</strong> m 3 /día<br />
Volúmenes anuales <strong>de</strong> gas que <strong>de</strong>ben<br />
reemp<strong>la</strong>zarse para compensar <strong>de</strong>clinos<br />
700<br />
600<br />
630Mm 3 /día<br />
500<br />
400<br />
300<br />
343Mm 3 /día<br />
200<br />
100<br />
0<br />
Fuentes:<br />
• En 2001, cuando <strong>la</strong>s tasas <strong>de</strong> <strong>de</strong>clino eran <strong>de</strong>l 23% anual, se necesitaba reemp<strong>la</strong>zar<br />
anualmente 343 millones <strong>de</strong> m3 diarios <strong>de</strong> gas, para compensar un consumo <strong>de</strong> 1.543 Mm3 diarios<br />
• Actualmente se necesitan 630 millones <strong>de</strong> m 3 diarios <strong>de</strong> gas, para compensar un consumo <strong>de</strong> 1.857 Mm 3 diarios<br />
Fuente: Arthur E. Berman Labyrinth Consulting Services, Inc. ASPO Conference 2012 Vienna, Austria May 30, 2012
En millones <strong>de</strong> US$<br />
Capital y generación <strong>de</strong> flujo <strong>de</strong> caja<br />
25.000<br />
20.000<br />
15.000<br />
Flujo <strong>de</strong> caja<br />
trimestral<br />
<strong>de</strong> <strong>la</strong> producción<br />
<strong>de</strong> gas natural<br />
Capital trimestral necesario<br />
para compensar <strong>de</strong>clinos<br />
10.000<br />
5.000<br />
¡¡Déficit <strong>de</strong> 10.000 M$<br />
trimestrales!!<br />
0<br />
Fuentes:<br />
• El análisis <strong>de</strong> los 34 mayores productores comercializadores <strong>de</strong> gas, indica que el coste <strong>de</strong> reemp<strong>la</strong>zo es <strong>de</strong> 22.00 M$/Trimestre<br />
• El flujo <strong>de</strong> caja <strong>de</strong> esas compañías en 2010 fue <strong>de</strong> 12.000 M$/trimestre. Esto significa un déficit <strong>de</strong> 10.000 M$/Trimestre.<br />
• Los insostenibles gastos <strong>de</strong> capital limitarán <strong>la</strong> capacidad para servir mediante oferta.<br />
• La aceleración <strong>de</strong> los costes <strong>de</strong> servicio se agregarán a esta limitación.<br />
Fuente: Arthur E. Berman Labyrinth Consulting Services, Inc. ASPO Conference 2012 Vienna, Austria May 30, 2012
El más que posible frau<strong>de</strong><br />
<strong>de</strong> <strong>la</strong> rentabilidad a corto p<strong>la</strong>zo<br />
Los operadores necesitan un precio<br />
mínimo para operar con beneficio<br />
Los ven<strong>de</strong>dores <strong>de</strong> servicios ganan<br />
y especu<strong>la</strong>n con rapi<strong>de</strong>z inusitada<br />
Fuente: http://www.washingtonpost.com/business/industries/natural-gas-glut-low-prices-prompt-chesapeake-to-cut-exploration-and-production/2012/01/23/gIQAJ8UoKQ_story.html<br />
http://www.bloomberg.com/news/2012-01-23/halliburton-profit-grows-as-u-s-fracking-surges.html
El interés está más en <strong>la</strong> venta <strong>de</strong> tecnología<br />
y asesoramiento, que en <strong>la</strong> explotación
Bienvenidos a <strong>la</strong>s arenas <strong>de</strong> Alberta<br />
Dos modos <strong>de</strong> extracción:<br />
• Minería<br />
• Drenaje por gravedad apoyado en vapor (SAGD)<br />
Producción y reservas en 2010:<br />
• Minería, 756.000 bpd/3.400 millones <strong>de</strong> barriles<br />
• SAGD, 704.000 bpd/135.000 millones <strong>de</strong> barriles<br />
Re<strong>la</strong>ción teórica reservas a producción: 116 años<br />
Exigen gran<strong>de</strong>s cantida<strong>de</strong>s <strong>de</strong> energía para extraer el<br />
bitumen y convertirlo en crudo sintético.<br />
Fuente: Dr Euan Mearns Honorary Research Fellow euan.mearns@abdn.ac.uk ASPO X Vienna June 1st. 2012
Consumo <strong>de</strong> energía en Mtpe<br />
1.980<br />
1.983<br />
1.986<br />
1.989<br />
1.992<br />
1.995<br />
1.998<br />
2.001<br />
2.004<br />
2.007<br />
2.010<br />
PIB en miles <strong>de</strong> millones <strong>de</strong> Euros<br />
(PPP2000)<br />
Economía y energía: una cuasi i<strong>de</strong>ntidad<br />
160<br />
900<br />
MTpe<br />
PIB<br />
140<br />
800<br />
120<br />
100<br />
Entre 1986 y 2008<br />
<strong>la</strong> economía y el<br />
consumo <strong>de</strong> energía<br />
aumentan un 3% anual<br />
700<br />
600<br />
55 millones <strong>de</strong> turistas<br />
500<br />
80<br />
60<br />
40<br />
España se<br />
Incorpora<br />
a <strong>la</strong> UE<br />
2.000 km. Líneas AVE<br />
350.000 Km<br />
<strong>de</strong> carreteras<br />
15.000 Km<br />
<strong>de</strong> autovías<br />
3 millones coches/año<br />
400<br />
300<br />
200<br />
20<br />
100<br />
0<br />
50 aeropuertos<br />
800.000 nuevas<br />
viviendas/año<br />
0<br />
Fuente: Ministerio <strong>de</strong> Industria, Turismo y Comercio. Energía 2010. Páginas 333-335 y e<strong>la</strong>boración propia
Mo<strong>de</strong>lo matemático <strong>de</strong> crecimiento al 3% anual sobre base 100 en 2010<br />
¿Por encima <strong>de</strong> nuestras posibilida<strong>de</strong>s<br />
o <strong>de</strong> vuelta a <strong>la</strong> senda <strong>de</strong>l crecimiento<br />
2500<br />
2000<br />
Turistas: 1.000 millones/año<br />
Producción <strong>de</strong> coches:<br />
57 millones/año<br />
1500<br />
950 aeropuertos<br />
1000<br />
Nuevas<br />
Viviendas:<br />
15<br />
millones /año<br />
500<br />
Carreteras:<br />
6 millones <strong>de</strong> Km<br />
Autovías:<br />
250.000 Km.<br />
0<br />
2010 2020 2030 2040 2050 2060 2070 2080 2090 2100 2110
Necesitamos una colchoneta energética<br />
con urgencia<br />
MILLONES DE<br />
BARRILES DIARIOS<br />
Pero, ¿cómo construir <strong>la</strong><br />
“colchoneta” con unas tasas<br />
<strong>de</strong> caída <strong>de</strong> entre el 2 y el 8%<br />
anual <strong>de</strong>l combustible rey<br />
sobre el que se <strong>de</strong>be apoyar<br />
el cambio<br />
Concepto tomado <strong>de</strong> Kjell Aleklett. Peeking at Peak Oil. Springer.
Muchas gracias por su atención<br />
<strong>Pedro</strong> A. <strong>Prieto</strong><br />
Vicepresi<strong>de</strong>nte<br />
www.crisisenergetica.org<br />
www.peakoil.net
![UVa [ GuÃa para recién llegados a los ALGORITMOS GENÃTICOS]](https://img.yumpu.com/51136547/1/184x260/uva-gua-a-para-reciacn-llegados-a-los-algoritmos-genaticos.jpg?quality=85)