produccion y superficie sembrada - Gobierno del Estado de ...
produccion y superficie sembrada - Gobierno del Estado de ...
produccion y superficie sembrada - Gobierno del Estado de ...

Create successful ePaper yourself
Turn your PDF publications into a flip-book with our unique Google optimized e-Paper software.
ANTECEDENTES<br />
Contexto Internacional<br />
Según datos <strong>de</strong> la Organización <strong>de</strong> las Naciones Unidas para la Agricultura y la Alimentación (FAO)<br />
los cinco principales países productores <strong>de</strong> chile durante el 2006 son China, México, Turquía, <strong>Estado</strong>s<br />
Unidos y España.<br />
PAIS<br />
AREA<br />
(HA)<br />
RENDIMIENTO<br />
(TON/HA)<br />
PRODUCCIO<br />
N<br />
(TON)<br />
CHINA 612,800 20.45 12,531,000<br />
MEXICO 140,693 13.17 1,853,610<br />
TURQUIA 88,000 19.83 1,745,000<br />
ESTADOS<br />
UNIDOS 34,400 28.42 977,760<br />
ESPAÑA 22,500 42.36 953,200<br />
INDONESIA 173,817 5.01 871,080<br />
OTROS 624,681 6,083,848<br />
TOTAL 1,696,891 14.74 25,015,498<br />
3%<br />
4%<br />
4%<br />
7%<br />
24%<br />
Produccion Mundial <strong>de</strong> Chiles<br />
FAOSTAT, 2006<br />
7%<br />
51%<br />
CHINA<br />
MEXICO<br />
TURQUIA<br />
ESTADOS<br />
UNIDOS<br />
ESPAÑA<br />
INDONESIA<br />
OTROS
CONTEXTO NACIONAL<br />
“De origen mexicano y signo <strong>de</strong> la<br />
i<strong>de</strong>ntidad nacional”<br />
Servicio <strong>de</strong> Información Agroalimentaria y Pesquera<br />
(SIAP 2005). Al año, México exporta mas <strong>de</strong> 416 mil<br />
800 toneladas <strong>de</strong> chiles en sus diferentes varieda<strong>de</strong>s<br />
a los <strong>Estado</strong>s Unidos, Canadá y países <strong>de</strong> la Unión<br />
Europea, con lo que se ubica como el segundo país<br />
exportador <strong>de</strong> esta hortaliza a nivel mundial.<br />
Con una producción <strong>de</strong> 1.8 millones <strong>de</strong><br />
toneladas, alre<strong>de</strong>dor <strong>de</strong> 150 mil hectáreas <strong>sembrada</strong>s<br />
en el país que representan un valor comercial <strong>de</strong> mas<br />
<strong>de</strong> siete mil millones <strong>de</strong> pesos, México ocupa el<br />
segundo lugar a nivel mundial como productor <strong>de</strong><br />
esta hortaliza.
PRODUCCION NACIONAL<br />
AÑO<br />
PRODUCCION<br />
(Ton)<br />
RENDIMIENTO<br />
(Ton/ha)<br />
PMR ($/ton)<br />
2000 1,741,680.45 11.96 $4,213<br />
2001 1,896,413.03 12.81 $3,639<br />
2002 1,783,438.99 12.74 $3,427<br />
2003 1,776,817.80 12.46 $4,162<br />
2004 1,864,962.44 13.41 $5,910<br />
2005 2,089,523.23 13.86 $4,715<br />
2006 2,077,324.04 13.62 $3,874<br />
2007 2,258,562.44 15.91 $5,315<br />
2008 2,051,685.32 15.63 $5,497<br />
2009 1,981,564.45 14.11 $5,571<br />
Fuente: Servicio <strong>de</strong> Información Agroalimentaria y Pesquera (SIAP)<br />
La tabla nos muestra la producción, el<br />
rendimiento y el precio medio rural <strong><strong>de</strong>l</strong><br />
cultivo <strong><strong>de</strong>l</strong> chile ver<strong>de</strong> en el país <strong><strong>de</strong>l</strong> año<br />
2000 al año 2009, y arrojo un promedio en<br />
la producción <strong>de</strong> 1,952,197.22 toneladas y<br />
un promedio en el rendimiento <strong>de</strong> 13.65<br />
toneladas por hectárea.<br />
Datos <strong><strong>de</strong>l</strong> Servicio <strong>de</strong> Información<br />
Agroalimentaria y Pesquera (SIAP), el<br />
estado <strong>de</strong> Chihuahua obtuvo el primer lugar<br />
en la producción <strong>de</strong> chile en el periodo 2000<br />
al 2009 con un promedio en la producción <strong>de</strong><br />
446,939.62 toneladas y un promedio en el<br />
rendimiento <strong>de</strong> 20.07 toneladas por<br />
hectárea, le sigue el estado <strong>de</strong> Sinaloa con<br />
un promedio en la producción <strong>de</strong><br />
434,219.06 toneladas, sin embargo en el<br />
promedio <strong>de</strong> rendimiento Sinaloa supera a<br />
Chihuahua al obtener un promedio <strong>de</strong> 28.53<br />
toneladas por hectárea en el periodo<br />
analizado.
PRODUCCION Y SUPERFICIE SEMBRADA<br />
Histórico-Nivel Nacional<br />
Producción y Sup. Sembrada<br />
Sup. Sembrada<br />
(Has)<br />
Producción<br />
(Ton)<br />
2000 2001 2002 2003 2004 2005 2006 2007 2008 2009<br />
151,690 155,503 151,027 151,571 146,758 162,837 158,743 148,944 146,264 144,110<br />
1,741,680 1,896,413 1,783,439 1,776,818 1,864,902 2,089,523 2,077,324 2,258,562 2,051,685 1,981,564<br />
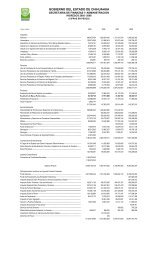
En el contexto nacional la <strong>superficie</strong> que<br />
se <strong>de</strong>stina a cultivo <strong>de</strong> chile durante los<br />
últimos años ha presentado cambios<br />
constantemente, en 2000 fue <strong>de</strong> 151,690<br />
hectáreas con una producción <strong>de</strong><br />
1,741,680 toneladas, seguido <strong>de</strong> varios<br />
años con <strong>de</strong>scensos en <strong>superficie</strong><br />
<strong>sembrada</strong>, contrario al comportamiento <strong>de</strong><br />
la producción que tiene un comportamiento<br />
a la alza, <strong>de</strong>bido a mayores rendimientos<br />
por hectáreas, como es el caso <strong><strong>de</strong>l</strong> año<br />
2007 que presenta una <strong>superficie</strong> <strong>de</strong><br />
148,944 hectáreas con una producción<br />
<strong>de</strong> 2,258,562 toneladas <strong>de</strong> chile ver<strong>de</strong>.<br />
Tan solo en el 2009 se aprecia una<br />
producción <strong>de</strong> 1,981,564 toneladas con<br />
una <strong>superficie</strong> <strong>sembrada</strong> <strong>de</strong> 144,110<br />
hectáreas <strong>de</strong> cultivo.<br />
3,000,000<br />
2,500,000<br />
2,000,000<br />
1,500,000<br />
1,000,000<br />
500,000<br />
0<br />
PRODUCCIÓN Y SUPERFICIE SEMBRADA DE CHILE VERDE A<br />
NIVEL NACIONAL<br />
2000 2001 2002 2003 2004 2005 2006 2007 2008 2009<br />
Sup. Sembrada (Has)<br />
Producción (Ton)
ANÁLISIS DE LOS PRINCIPALES<br />
PRODUCTORES<br />
Histórico-Nivel Nacional<br />
Principales estados productores<br />
2000 2001 2002 2003 2004 2005 2006 2007 2008 2009<br />
CHIHUAHUA 409,907 416,004 434,622 362,489 450,016 437,174 472,149 564,256 413,122 508,058<br />
SINALOA 295,642 361,455 386,358 329,562 319,841 469,803 488,153 694,634 611,490 385,252<br />
ZACATECAS 308,320 285,801 297,296 266,692 271,248 320,701 280,876 209,331 213,129 288,125<br />
En el contexto nacional, los estados que <strong>de</strong>stacan en la<br />
producción <strong>de</strong> chile son Chihuahua, Sinaloa y<br />
Zacatecas. El estado <strong>de</strong> Chihuahua es lí<strong>de</strong>r en la<br />
producción <strong>de</strong> este cultivo, generando volúmenes <strong>de</strong><br />
producción para los años 2000,2001 y 2002 más <strong>de</strong> 400<br />
mil toneladas, presentando una baja en el año 2003<br />
para ubicarse en 362,489 toneladas; posteriormente<br />
para el resto <strong>de</strong> los años, la producción fue <strong>de</strong> más <strong>de</strong><br />
400 mil toneladas, superando esta en el 2007 y 2009<br />
con más <strong>de</strong> 500 mil toneladas <strong>de</strong> chile. Por su parte, el<br />
estado <strong>de</strong> Sinaloa, para el año 2000, generó una<br />
producción <strong>de</strong> 295,642 toneladas <strong>de</strong> chile, aumentando<br />
la producción para los siguientes cuatro años en más<br />
300 mil toneladas; en los años 2005 y 2006 la<br />
producción <strong>de</strong> chile repuntó, ubicándose por arriba <strong>de</strong><br />
las 450 mil toneladas, siendo más significativo el<br />
aumento en la producción para 2007 y 2008, superando<br />
las 600 mil toneladas, con respecto al 2009, don<strong>de</strong><br />
disminuyó a 385,252 toneladas.<br />
Toneladas<br />
700,000<br />
600,000<br />
500,000<br />
400,000<br />
300,000<br />
200,000<br />
100,000<br />
COMPARATIVO DE LA PRODUCCIÓN DE CHILE A NIVEL<br />
NACIONAL<br />
0<br />
Año<br />
CHIHUAHUA<br />
SINALOA<br />
ZACATECAS
ANÁLISIS DE LOS PRINCIPALES<br />
PRODUCTORES<br />
Histórico-Nivel Nacional<br />
Sup. Sembrada<br />
2000 2001 2002 2003 2004 2005 2006 2007 2008 2009<br />
CHIHUAHUA 20,229 21,645 21,449 20,230 20,588 30,792 29,448 27,527 26,248 26,933<br />
SINALOA 16,765 16,927 16,525 13,242 13,177 16,350 17,181 17,309 15,124 11,777<br />
ZACATECAS 34,264 32,092 36,602 39,123 39,532 37,579 39,443 37,215 34,919 37,877<br />
Hectáreas<br />
40,000<br />
35,000<br />
30,000<br />
25,000<br />
20,000<br />
15,000<br />
10,000<br />
5,000<br />
0<br />
COMPARATIVO DE LA SUPERFICIE SEMBRADA DE CHILE A<br />
NIVEL NACIONAL<br />
Año<br />
CHIHUAHUA<br />
SINALOA<br />
ZACATECAS<br />
En <strong>superficie</strong> <strong>sembrada</strong>, el estado <strong>de</strong><br />
Zacatecas supera a Chihuahua y<br />
Sinaloa, <strong>de</strong>stinando <strong>de</strong> 32 mil a más <strong>de</strong> 39 mil<br />
hectáreas, pero sin embargo, el rendimiento<br />
generado por hectárea se traduce en menor<br />
volumen <strong>de</strong> producción. Por consiguiente<br />
Chihuahua se ubica como la segunda<br />
entidad, en don<strong>de</strong> la <strong>superficie</strong> que se <strong>de</strong>stina<br />
para la siembra <strong>de</strong> este cultivo es <strong>de</strong> 20 mil a<br />
30 mil hectáreas. Mientras tanto Sinaloa, es<br />
el estado que registra menor <strong>superficie</strong><br />
<strong>sembrada</strong>, registrando 11 mil a casi las 17 mil<br />
hectáreas anuales, en comparación con<br />
Chihuahua y Zacatecas, pero cuyo<br />
rendimiento en producción es mayor que el<br />
que presenta el estado <strong>de</strong> Zacatecas.
PRODUCCIÓN Y SUPERFICIE SEMBRADA<br />
Histórico-Nivel Estatal<br />
Producción y Sup. Sembrada<br />
Sup. Sembrada<br />
(Has)<br />
Producción<br />
(Ton)<br />
2000 2001 2002 2003 2004 2005 2006 2007 2008 2009<br />
20,229 21,645 21,449 20,230 20,588 30,792 29,448 27,527 26,248 26,933<br />
409,907 416,004 434,622 362,489 450,016 437,174 472,149 564,256 413,122 508,058<br />
700,000<br />
600,000<br />
500,000<br />
400,000<br />
300,000<br />
200,000<br />
100,000<br />
PRODUCCIÓN Y SUPERFICIE SEMBRADA DE CHILE VERDE<br />
EN CHIHUAHUA<br />
0<br />
2000 2001 2002 2003 2004 2005 2006 2007 2008 2009<br />
Sup. Sembrada (Has)<br />
Producción (Ton)<br />
A nivel estatal la <strong>superficie</strong> <strong>de</strong>dicada al<br />
cultivo <strong>de</strong> chile presenta cambios<br />
significativos en los últimos diez años, por<br />
ejemplo <strong>de</strong> 2001, se observa la menor<br />
<strong>superficie</strong> <strong>sembrada</strong> <strong>de</strong> 20,229 hectáreas<br />
con una producción generada <strong>de</strong> 409,907<br />
toneladas <strong>de</strong> chile. Solo en el año 2005 la<br />
<strong>superficie</strong> <strong>sembrada</strong> <strong>de</strong> este cultivo<br />
ascien<strong>de</strong> a 30,792 hectáreas con una<br />
producción <strong>de</strong> 437,174 toneladas; en el<br />
año 2006 a 2009 se aprecia un <strong>de</strong>scenso<br />
en la <strong>superficie</strong> <strong>sembrada</strong>, sin embargo<br />
mejoró el rendimiento por hectárea, ya que<br />
no represento bajas consi<strong>de</strong>rables en la<br />
producción, ejemplo <strong>de</strong> ello es la mayor<br />
producción que se refleja en el 2007 con<br />
564,256 toneladas con una <strong>superficie</strong> <strong>de</strong><br />
27,527 hectáreas.
REGIONALIZACIÓN PARA EL CULTIVO DE CHILE<br />
PRODUCCIÓN<br />
REGIÓN 2008 2009<br />
CASAS GRANDES 159,331 248,984<br />
CHIHUAHUA 1,280 1,410<br />
CUAUHTÉMOC 208 6<br />
DELICIAS 201,567 189,505<br />
JUÁREZ 6,953 8,663<br />
OJINAGA 1,508 2,176<br />
GUERRERO 0 60<br />
PARRAL 42,276 57,253<br />
TOTAL 413,122 508,058<br />
Toneladas<br />
300,000<br />
250,000<br />
200,000<br />
150,000<br />
100,000<br />
50,000<br />
0<br />
PRODUCCIÓN DE CHILE POR REGIÓN<br />
PRODUCCIÓN 2008 PRODUCCIÓN 2009<br />
La producción <strong>de</strong> chile en el estado <strong>de</strong> Chihuahua es importante, <strong>de</strong>bido al potencial que representa este<br />
cultivo para la agricultura. Esta actividad se <strong>de</strong>sarrolla en gran parte <strong><strong>de</strong>l</strong> territorio<br />
chihuahuense, concentrándose <strong>de</strong>ntro <strong>de</strong> ocho <strong>de</strong> las diez regiones en que se divi<strong>de</strong> el estado. Las<br />
regiones más representativas en producción son Delicias y Casas Gran<strong>de</strong>s, con producción en<br />
2008 <strong>de</strong> 201,567 y 159,331 respectivamente. Para el año 2009 la producción mayor se observa en la<br />
región <strong>de</strong> Casas Gran<strong>de</strong>s con 248,984 toneladas, mientras que la región <strong>de</strong> Delicias presenta 189,505<br />
toneladas <strong>de</strong> producción <strong>de</strong> chile.
PANORAMA GENERAL<br />
CHILE VERDE<br />
2005 2006 2007 2008 2009 2010<br />
GMF 41,651.80 42,402.24 42,933.04 43,357.06 43,786.39 44,216.58<br />
BMF 58,454.43 60,368.51 60,859.42 62,794.13 64,790.76 66,851.28<br />
En el año 2009 el <strong>Estado</strong> <strong>de</strong> Chihuahua ocupó el<br />
primer lugar a nivel nacional en Producción <strong>de</strong> chile<br />
ver<strong>de</strong>, con una <strong>superficie</strong> <strong>de</strong>stinada <strong>de</strong> 26,933.32<br />
Ha, y una participación <strong><strong>de</strong>l</strong> 18.69% <strong>de</strong> la <strong>superficie</strong><br />
total <strong>sembrada</strong>, en las cuales se implementaron<br />
dos tecnologías <strong>de</strong> riego: por bombeo (BMF) y<br />
gravedad (GMF).<br />
En BMF se obtuvo un rendimiento <strong>de</strong> 28 ton/ha y 35<br />
ton/ha en GMF, con una variación entre ambas <strong>de</strong><br />
$22,634.7 en sus costos <strong>de</strong> producción.<br />
MEX $/TON<br />
80,000.00<br />
70,000.00<br />
60,000.00<br />
50,000.00<br />
40,000.00<br />
30,000.00<br />
20,000.00<br />
10,000.00<br />
-<br />
CHIHUAHUA<br />
CICLO PV<br />
2005 2006 2007 2008 2009 2010<br />
GMF<br />
BMF
PANORAMA GENERAL<br />
CHILE VERDE<br />
2005 2006 2007 2008 2009 2010<br />
BMF 36,061.10 36,711.01 37,205.64 37,803.79 38,376.06 38,948.33<br />
En el año 2009 el <strong>Estado</strong> <strong>de</strong> Tamaulipas<br />
<strong>de</strong>stinó 3,544.21 Has. en <strong>superficie</strong><br />
<strong>sembrada</strong>, solo el 13% <strong>de</strong> la <strong>superficie</strong><br />
que utilizó Chihuahua para el cultivo <strong>de</strong><br />
chile ver<strong>de</strong>, <strong>de</strong> lo anterior obtuvo un<br />
rendimiento <strong>de</strong> 32.17 Ton/Ha, y sus costos<br />
<strong>de</strong> producción son más bajos que los<br />
registrados en Chihuahua en el mismo<br />
año, sin embargo, el volumen <strong>de</strong><br />
producción que Chihuahua registro supera<br />
en más <strong>de</strong> 400,000 toneladas.<br />
$/TON<br />
39,500.00<br />
39,000.00<br />
38,500.00<br />
38,000.00<br />
37,500.00<br />
37,000.00<br />
36,500.00<br />
36,000.00<br />
35,500.00<br />
35,000.00<br />
34,500.00<br />
TAMAULIPAS<br />
CICLO PV<br />
2005 2006 2007 2008 2009 2010<br />
BMF
SUBTOTALES EN COSTOS DE PRODUCCION<br />
CHILE VERDE GMF PV CHIHUAHUA<br />
2005 2006 2007 2008 2009 2010<br />
INSUMOS 50% 50% 50% 50% 50% 50%<br />
COSECHA 34% 33% 33% 33% 33% 33%<br />
LABORES DE<br />
POSTSIEMBRA 7% 7% 6% 6% 6% 6%<br />
PREPARACION DEL<br />
CULTIVO 5% 5% 5% 5% 5% 5%<br />
SIEMBRA 3% 3% 3% 3% 3% 3%<br />
OTROS 1% 2% 2% 2% 2% 2%<br />
TOTAL COSTO DE<br />
PRODUCCION<br />
41,651.80 42,402.24 42,933.04 43,357.06 43,786.39 44,216.58<br />
VALOR PORCENTUAL<br />
DE LOS COSTOS DE PRODUCCION AÑO 2010<br />
7%<br />
5% 3% 2%<br />
50%<br />
INSUMOS<br />
COSECHA<br />
LABORES DE<br />
PORTSIEMBRA<br />
PREPARACION<br />
DEL CULTIVO<br />
En el cultivo <strong>de</strong> chile ver<strong>de</strong> GMF, los insumos son<br />
el principal egreso con el 50% <strong><strong>de</strong>l</strong> total <strong>de</strong> costo.<br />
El valor porcentual <strong>de</strong> las labores <strong>de</strong> cosecha<br />
también influyen en el alza <strong>de</strong> los costos <strong>de</strong><br />
producción con un 33% en el alza para el año<br />
2010.<br />
SIEMBRA<br />
33%<br />
OTROS
SUBTOTALES EN COSTOS DE PRODUCCION<br />
CHILE VERDE BMF PV CHIHUAHUA<br />
2005 2006 2007 2008 2009 2010<br />
INSUMOS 69% 69% 71% 71% 71% 71%<br />
LABORES DE<br />
POSTSIEMBRA<br />
11% 11% 11% 11% 11% 11%<br />
OTROS 9% 8% 7% 7% 7% 8%<br />
COSECHA 7% 7% 7% 7% 7% 7%<br />
PREPARACION DEL<br />
CULTIVO<br />
3% 3% 3% 3% 3% 3%<br />
SIEMBRA 0.003307363 0.003176665 0.003176501 0.003177148 0.003177775 0.003178383<br />
COSTO DE<br />
PRODUCCION<br />
58,454.43 60,368.51 60,859.42 62,794.13 64,790.76 66,851.28<br />
En la tecnología BMF el alza en los costos<br />
<strong>de</strong> producción es atribuido a los insumos, ya<br />
que estos aportan el 71% en estos. Este es<br />
el costo <strong>de</strong> producción más alto <strong>de</strong> las dos<br />
tecnologías utilizadas. En cuanto a las<br />
labores <strong>de</strong> postsiembra, representaron en el<br />
año 2010 el 11% <strong><strong>de</strong>l</strong> total <strong><strong>de</strong>l</strong> costo <strong>de</strong><br />
producción.<br />
11%<br />
VALOR PORCENTUAL<br />
DE LOS COSTOS DE PRODUCCION AÑO 2010<br />
0%<br />
8%<br />
7%<br />
INSUMOS<br />
3%<br />
LABORES DE<br />
PORTSIEMBRA<br />
71%<br />
OTROS<br />
COSECHA<br />
PREPARACION DEL<br />
CULTIVO<br />
SIEMBRA
SUBTOTALES EN COSTOS DE PRODUCCION<br />
TAMAULIPAS<br />
CHILE VERDE BMF PV TAMAULIPAS<br />
2005 2006 2007 2008 2009 2010<br />
INSUMOS 48% 48% 47% 47% 47% 47%<br />
OTROS 28% 28% 29% 29% 29% 29%<br />
LABORES DE<br />
POSTSIEMBRA<br />
12% 12% 12% 12% 12% 12%<br />
SIEMBRA 9% 9% 9% 9% 9% 9%<br />
PREPARACION DEL<br />
CULTIVO<br />
3% 3% 3% 3% 3% 3%<br />
COSECHA 2% 2% 2% 2% 2% 2%<br />
COSTO DE<br />
PRODUCCION<br />
35,261.10 35,895.13 36,373.64 36,955.83 37,512.10 38,068.37<br />
VALOR PORCENTUAL<br />
DE COSTOS DE PRODUCCION AÑO 2010<br />
12%<br />
28%<br />
9%<br />
3% 2%<br />
46%<br />
INSUMOS<br />
OTROS<br />
LABORES DE PORTSIEMBRA<br />
SIEMBRA<br />
PREPARACION DEL CULTIVO<br />
En el año 2010 Tamaulipas presentó un<br />
incremento en los costos <strong>de</strong> producción <strong><strong>de</strong>l</strong><br />
1.48% con respecto al año anterior, ello<br />
es atribuido a los insumos utilizados para el<br />
cultivo <strong>de</strong> chile ver<strong>de</strong>, al representar el 47%<br />
<strong><strong>de</strong>l</strong> total <strong>de</strong> los costos <strong>de</strong> producción<br />
para la tecnología BMF.<br />
COSECHA
ANALISIS DE SENSIBILIDAD<br />
Existen varios factores que infieren en los costos <strong>de</strong> producción <strong>de</strong> un cultivo, <strong>de</strong> tal forma que <strong>de</strong> un<br />
periodo a otro el monto total se incrementa o disminuye <strong>de</strong> manera contun<strong>de</strong>nte, lo que <strong>de</strong>riva una<br />
variante en su utilidad.<br />
Sin embargo, en el año 2009 el cultivo <strong>de</strong> chile ver<strong>de</strong> colocó a Chihuahua en el primer lugar en<br />
rendimiento y producción nacional, y presentó costos <strong>de</strong> producción estables, lo que <strong>de</strong>jó un margen<br />
<strong>de</strong> utilidad favorable, que establece a este cultivo como uno <strong>de</strong> los 5 más rentables en el <strong>Estado</strong> <strong>de</strong><br />
Chihuahua.<br />
El paquete tecnológico BMF presenta 4<br />
principales conceptos gravosos: la semilla<br />
mejorada, pizca, encostale y acarreo, la<br />
aplicación <strong><strong>de</strong>l</strong> riego y las arpillas, sin<br />
embargo la semilla mejorada representa<br />
el 54% <strong><strong>de</strong>l</strong> total <strong>de</strong> los costos <strong>de</strong><br />
producción <strong><strong>de</strong>l</strong> cultivo <strong>de</strong> chile ver<strong>de</strong>.<br />
$/TON<br />
40,000.00<br />
35,000.00<br />
30,000.00<br />
25,000.00<br />
20,000.00<br />
15,000.00<br />
10,000.00<br />
5,000.00<br />
-<br />
COMPORTAMIENTO DEL PRECIO DE LOS<br />
PRINCIPALES CONCEPTOS QUE INTEGRAN LOS<br />
COSTOS DE PRODUCCION<br />
2005 2006 2007 2008 2009 2010<br />
Aplicación <strong>de</strong> riego<br />
Pizca y encostale<br />
Arpillas<br />
Semilla mejorada<br />
AÑO<br />
FUENTE: Sistema <strong>de</strong> Información Agroalimentaria y Pesquera
Para i<strong>de</strong>ntificar que tan sensible es el cultivo <strong>de</strong> chile ver<strong>de</strong> a posibles aumentos en el precio <strong>de</strong> los<br />
insumos, se creó un escenario pesimista aplicando un incremento <strong><strong>de</strong>l</strong> 25% para el periodo 2010-<br />
2015, en el cual se aprecia que el cultivo <strong>de</strong> chile no es sensible a este aumento y continua siendo<br />
rentable, al presentar una relación beneficio costo <strong>de</strong> 1.28, a<strong>de</strong>más el análisis <strong>de</strong> sensibilidad proyecta<br />
que el cultivo soporta incluso que el Precio Medio Rural se mantenga estable durante el periodo<br />
mencionado.<br />
ESCENARIO PESIMISTA INCREMENTO DEL 25% EN INSUMOS<br />
2010 2011 2012 2013 2014 2015<br />
INGRESO<br />
(PMR)<br />
CTOS DE<br />
PDN TON<br />
UTILIDAD<br />
REL<br />
B/C<br />
3,856.24 3,856.24 3,856.24 3,856.24 3,856.24 3,856.24<br />
2,387.55 2,758.06 2,822.52 2,886.98 2,951.44 3,015.90<br />
1,468.69 1,098.18 1,033.72 969.26 904.79 840.33<br />
1.62 1.40 1.37 1.34 1.31 1.28<br />
FUENTE: Sistema <strong>de</strong> Información Agroalimentaria y Pesquera
PRECIO MEDIO RURAL 2000 - 2009<br />
Chile Ver<strong>de</strong> Precio Medio Rural $/Ton.<br />
2000 2001 2002 2003 2004 2005 2006 2007 2008 2009<br />
Nacional 4,213 3,640 3,426 4,163 5,921 4,715 3,880 5,320 5,499 5,571<br />
Chihuahua 2,451 2,423 2,171 2,385 3,545 3,395 2,354 3,154 3,586 3,782<br />
Diferencia 1,762 1,217 1,255 1,778 2,376 1,320 1,526 2,166 1,913 1,789<br />
Fuente: Elaborado Datos SIAP 2009<br />
El Precio Medio Rural para el cultivo <strong>de</strong> Chile a<br />
nivel Nacional durante el periodo 2000 a 2009<br />
presenta variaciones <strong>de</strong> 7 % hasta 42 % como es<br />
en el año 2004 se observa en su precio mas alto<br />
<strong>de</strong> $ 5,921 por tonelada.<br />
En el estado <strong>de</strong> Chihuahua el Precio Medio Rural<br />
<strong>de</strong>ntro <strong><strong>de</strong>l</strong> periodo 2000-2009 presenta un periodo<br />
<strong>de</strong> crecimiento notable <strong>de</strong> 48 % <strong><strong>de</strong>l</strong> periodo<br />
2003 a 2005 con su mayor precio alcanzado en el<br />
2004 con $ 3,545 por tonelada <strong>de</strong> producción.<br />
$/TON<br />
7,000<br />
6,000<br />
5,000<br />
4,000<br />
3,000<br />
2,000<br />
1,000<br />
0<br />
PRECIO MEDIO RURAL HISTÓRICO 2000-2009<br />
NACIONAL<br />
CHIHUAHUA
PRECIO MEDIO RURAL ESTIMADO<br />
Chile Ver<strong>de</strong> Precio Medio Rural Estimado $/Ton.<br />
2010 2011 2012 2013 2014 2015<br />
Nacional 5,723 5,921 6,119 6,317 6,515 6,712<br />
Chihuahua 3,751 3,901 4,052 4,202 4,352 4,503<br />
Diferencia 1,972 2,019 2,067 2,115 2,162 2,210<br />
PRECIO MEDIO RURAL ESTIMADO<br />
$/TON<br />
8,000<br />
7,000<br />
6,000<br />
5,000<br />
4,000<br />
3,000<br />
2,000<br />
1,000<br />
0<br />
El Precio Medio Rural Estimado a nivel<br />
Nacional en cultivo <strong>de</strong> Chile Ver<strong>de</strong> para el<br />
periodo 2010 a 2015 se prevé un crecimientos<br />
<strong>de</strong> 3.5 % anual para llegar a 2015 con un<br />
precio <strong>de</strong> $ 6,712 tonelada producida.<br />
El estado <strong>de</strong> Chihuahua observa un Precio<br />
Medio Rural Estimado <strong>de</strong> $ 3,751 en el año<br />
2010 esperando un incremento 2.7 %<br />
anual, alcanzando los $ 4,503 por tonelada<br />
<strong>de</strong> producción al final <strong>de</strong> 2015.<br />
NACIONAL<br />
CHIHUAHUA
PRECIO CHILE VERDE EN CHIHUAHUA<br />
Precios al mayoreo <strong>de</strong> Chile ver<strong>de</strong> en general Central <strong>de</strong> Abasto <strong>de</strong> Chihuahua<br />
Pesos /Presentación<br />
Origen Destino Presentación Precio Promedio<br />
Jalisco Chihuahua: Central <strong>de</strong> Abasto <strong>de</strong> Chihuahua Arpilla <strong>de</strong> 10 kg. 200<br />
Jalisco Chihuahua: Central <strong>de</strong> Abasto <strong>de</strong> Chihuahua Arpilla <strong>de</strong> 25 kg. 212<br />
Michoacán Chihuahua: Central <strong>de</strong> Abasto <strong>de</strong> Chihuahua Caja <strong>de</strong> 20 kg. 400<br />
Fuente: SNIIM 26/Noviembre/2010<br />
Precios al mayoreo <strong>de</strong> Chile ver<strong>de</strong> en general Principales Centrales <strong>de</strong> Abasto <strong>de</strong><br />
México<br />
Pesos /Presentación<br />
Origen Destino Presentación Precio Promedio<br />
Michoacán D F: Central <strong>de</strong> Abasto <strong>de</strong> Iztapalapa D F Arpilla <strong>de</strong> 20 kg. 220<br />
Michoacán D F: Central <strong>de</strong> Abasto <strong>de</strong> Iztapalapa D F Caja <strong>de</strong> 12 kg. 83<br />
Tamaulipas D F: Central <strong>de</strong> Abasto <strong>de</strong> Iztapalapa D F Arpilla <strong>de</strong> 30 kg. 350<br />
Veracruz D F: Central <strong>de</strong> Abasto <strong>de</strong> Iztapalapa D F Arpilla <strong>de</strong> 30 kg. 1130<br />
Jalisco Jalisco: Mercado <strong>de</strong> Abasto <strong>de</strong> Guadalajara Arpilla <strong>de</strong> 30 kg. 685<br />
Jalisco Jalisco: Mercado <strong>de</strong> Abasto <strong>de</strong> Guadalajara Caja <strong>de</strong> 12 kg. 182<br />
Sinaloa Jalisco: Mercado <strong>de</strong> Abasto <strong>de</strong> Guadalajara Arpilla <strong>de</strong> 30 kg. 343<br />
Chihuahua Nuevo León: Mercado <strong>de</strong> Abasto "Estrella" Kilogramo 20<br />
Jalisco Nuevo León: Mercado <strong>de</strong> Abasto "Estrella" Kilogramo 15<br />
México Nuevo León: Mercado <strong>de</strong> Abasto "Estrella" Kilogramo 48<br />
Michoacán Nuevo León: Mercado <strong>de</strong> Abasto "Estrella" Kilogramo 7<br />
Nuevo León Nuevo León: Mercado <strong>de</strong> Abasto "Estrella" Kilogramo 13<br />
Sinaloa Nuevo León: Mercado <strong>de</strong> Abasto "Estrella" Caja <strong>de</strong> 10 kg. 113<br />
Fuente: SNIIM 26/Noviembre/2010