Caudal Ecológico? - cazalac
Caudal Ecológico? - cazalac
Caudal Ecológico? - cazalac

Create successful ePaper yourself
Turn your PDF publications into a flip-book with our unique Google optimized e-Paper software.
873.5<br />
873.0<br />
872.5<br />
872.0<br />
871.5<br />
871.0<br />
870.5<br />
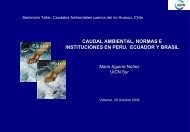
RIO MAIPO Plan: Plan 01 17/03/2009<br />
PT4<br />
.033<br />
20 40 60 80 100<br />
Station (m)<br />
Legend<br />
EG PF 20<br />
WS PF 20<br />
Crit PF 20<br />
0.0 m/s<br />
0.5 m/s<br />
1.0 m/s<br />
1.5 m/s<br />
2.0 m/s<br />
2.5 m/s<br />
3.0 m/s<br />
3.5 m/s<br />
4.0 m/s<br />
Ground<br />
Bank Sta<br />
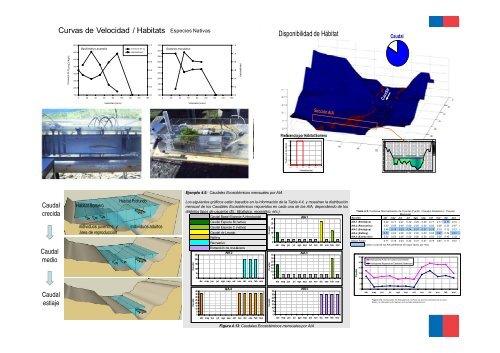
Curvas de Velocidad / Habitats Especies Nativas<br />
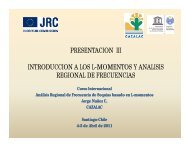
Disponibilidad de Hábitat<br />
<strong>Caudal</strong><br />
Consumo de O 2 (mgO 2 /Kg/h)<br />
500<br />
450<br />
400<br />
350<br />
300<br />
250<br />
200<br />
Basilichthys australis<br />
Consumo de O 2<br />
Habitabilidad<br />
1,2<br />
1,0<br />
0,8<br />
0,6<br />
0,4<br />
0,2<br />
320<br />
300<br />
280<br />
260<br />
240<br />
220<br />
200<br />
180<br />
160<br />
Galaxias maculatus<br />
1,2<br />
1,0<br />
0,8<br />
0,6<br />
0,4<br />
0,2<br />
Habitabilidad<br />
150<br />
0,0<br />
0 20 40 60 80 100 120 140 160<br />
Velocidad (cm/s)<br />
140<br />
0,0<br />
0 20 40 60 80 100 120 140 160<br />
Velocidad (cm/s)<br />
240<br />
220<br />
Diplomystes nahuelbutaensis<br />
1,2<br />
1,0<br />
Consumo de O 2 (mgO 2 /Kg/h)<br />
200<br />
0,8<br />
180<br />
0,6<br />
160<br />
0,4<br />
140<br />
0,2<br />
120<br />
0,0<br />
0 20 40 60 80 100 120 140 160<br />
Habitabilidad<br />
Preferencia por Hábitat Somero<br />
Preferencia de Hábitat<br />
1.0<br />
0.8<br />
0.6<br />
0.4<br />
0.2<br />
0.0<br />
0.0 0.2 0.4 0.6 0.8 1.0<br />
Elevation (m)<br />
Velocidad (cm/s)<br />
Profundidad (m)<br />
<strong>Caudal</strong><br />
crecida<br />
<strong>Caudal</strong><br />
medio<br />
<strong>Caudal</strong><br />
estiaje<br />
Hábitat Somero<br />
individuos juveniles, y<br />
área de reproducción<br />
Hábitat Profundo<br />
Individuos adultos<br />
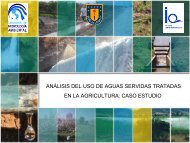
Ejemplo 4.5: <strong>Caudal</strong>es Ecosistémicos mensuales por AIA<br />
Los siguientes gráficos están basados en la información de la Tabla 4.4, y muestran la distribución<br />
mensual de los <strong>Caudal</strong>es Ecosistémicos requeridos en cada una de las AIA, dependiendo de los<br />
distintos tipos de usuarios (Ej.: Biológico, recreativo, etc.).<br />
<strong>Caudal</strong><br />
<strong>Caudal</strong><br />
25<br />
20<br />
15<br />
10<br />
5<br />
0<br />
40<br />
35<br />
30<br />
25<br />
20<br />
15<br />
10<br />
5<br />
0<br />
<strong>Caudal</strong> Basal (Especie A introducida)<br />
<strong>Caudal</strong> Especie B (nativa)<br />
<strong>Caudal</strong> Especie C (nativa)<br />
<strong>Caudal</strong> de Lavado<br />
Rafting<br />
abr may jun jul ago s ep oct nov dic ene feb mar<br />
Ca udal<br />
25<br />
20<br />
15<br />
10<br />
5<br />
Recreativo<br />
0<br />
abr may jun jul ago se p oct nov dic ene feb mar<br />
Extracción de crustáceos<br />
AIA 2 AIA 3<br />
35<br />
abr may jun jul ago sep oct nov dic ene feb mar<br />
Ca udal<br />
30<br />
25<br />
20<br />
15<br />
10<br />
5<br />
0<br />
30<br />
25<br />
20<br />
15<br />
10<br />
5<br />
0<br />
abr may jun jul ago se p oct nov dic ene feb mar<br />
AIA 4 AIA 5<br />
35<br />
Ca udal<br />
AIA 1<br />
abr may jun jul ago sep oct nov dic ene feb mar<br />
Figura 4.13: <strong>Caudal</strong>es Ecosistémicos mensuales por AIA<br />
Tabla 4.5: Factores Normalizados de <strong>Caudal</strong> (Factor =<strong>Caudal</strong> Sistémico / <strong>Caudal</strong><br />
Mensual)<br />
Sección abr may jun jul ago sep oct nov dic ene f<br />
AIA 1 (B iológi ca) 0.40 0.17 0.21 0.20 0.29 0.20 0.17 0.11 0.71 0.10 0<br />
AIA 2 (Recreativo) 0.00 0.00 0.00 0.00 0.00 0.00 0.00 0.00 0.53 0.47 0<br />
AIA 3 (B iológi ca) 0.49 0.19 0.23 0.24 0.31 0.27 0.19 0.15 0.12 0.12 0<br />
AIA 4 (R afting) 0.71 0.00 0.00 0.00 0.00 0.00 0.00 0.67 0.54 0.51 0<br />
AIA 5 (Extracción) 0.00 0.00 0.00 0.00 0.00 0.00 0.00 0.00 0.43 0.33 0<br />
Mayor Factor 0.71 0.19 0.23 0.24 0.31 0.27 0.19 0.67 0.71 0.51 0<br />
<strong>Caudal</strong><br />
30<br />
25<br />
20<br />
15<br />
10<br />
5<br />
0<br />
Indica a cual de las AIA pertenece el mayor factor por mes<br />
Hidrograma Punto de Control (Línea Base)<br />
Hidrograma Régimen de <strong>Caudal</strong>es Sistémicos<br />
abr may jun jul ago sep oct nov dic ene feb mar<br />
Figura 4.14: Comparación del Hidrograma en el Punto de Control (considerando la Línea<br />
Base) y el Hidrograma del régimen de <strong>Caudal</strong>es Ecosistémicos.