Newsletter sobre la situación laboral y social de la Argentina
Newsletter sobre la situación laboral y social de la Argentina
Newsletter sobre la situación laboral y social de la Argentina

Create successful ePaper yourself
Turn your PDF publications into a flip-book with our unique Google optimized e-Paper software.
indice<br />
:: El núcleo duro <strong>de</strong> <strong>la</strong> pobreza<br />
se resiste a replegarse<br />
:: Los jóvenes que no estudian ni<br />
trabajan, un problema creciente<br />
auspician<br />
2011<br />
www.manpower.com.ar<br />
www.kimberly-c<strong>la</strong>rk.com.ar<br />
www.e-galeno.com.ar<br />
SEL Consultores<br />
Viamonte 524, 3º Piso<br />
(C1053ABL) Bue Ar<br />
(54-11) 4315-6781<br />
www.selconsultores.com.ar<br />
<strong>Newsletter</strong> <strong>sobre</strong> <strong>la</strong> <strong>situación</strong><br />
<strong>la</strong>boral y <strong>social</strong> <strong>de</strong> <strong>la</strong> <strong>Argentina</strong><br />
EL NUCLEO DURO DE LA POBREZA SE RESISTE A REPLEGARSE<br />
Julio 2011<br />
La controversia <strong>sobre</strong> los indicadores <strong>social</strong>es dificulta conocer el estado <strong>de</strong><br />
<strong>situación</strong> <strong>de</strong> los hogares a partir <strong>de</strong> 2007. Esta limitación surge <strong>de</strong> (o más<br />
precisamente, está asociada con) <strong>la</strong> utilización, a menudo excluyente, <strong>de</strong> <strong>la</strong><br />
pobreza <strong>de</strong>finida por ingresos, que tiene como sustento <strong>la</strong> comparación entre<br />
éstos y el costo <strong>de</strong> una canasta (línea) <strong>de</strong> bienes y servicios básicos. El<br />
<strong>de</strong>sacuerdo <strong>sobre</strong> los precios -asumiendo que no los haya <strong>sobre</strong> los ingresos<br />
<strong>de</strong> los hogares- lleva a conclusiones muy diferentes, hasta opuestas, <strong>sobre</strong> <strong>la</strong><br />
evolución <strong>de</strong> <strong>la</strong> <strong>situación</strong> <strong>social</strong> en los años recientes.<br />
Una manera tal vez posible <strong>de</strong> zanjar este <strong>de</strong>sacuerdo es recurrir a indicadores<br />
reales, <strong>de</strong>svincu<strong>la</strong>dos en su construcción <strong>de</strong> los precios. Entre otros, <strong>la</strong><br />
calidad <strong>de</strong> <strong>la</strong> inserción <strong>la</strong>boral, el acceso a <strong>la</strong> educación y <strong>la</strong> salud, y <strong>la</strong>s condiciones<br />
<strong>de</strong> vivienda. Una ventaja interesante <strong>de</strong>l enfoque es que conserva <strong>la</strong><br />
unidad <strong>de</strong> <strong>la</strong> fuente; <strong>la</strong> información para e<strong>la</strong>borar estos indicadores está en <strong>la</strong><br />
misma Encuesta Permanente <strong>de</strong> Hogares <strong>de</strong>l INDEC.<br />
La manera probablemente más apropiada <strong>de</strong> abordar el tema es <strong>de</strong>sagregar<br />
los datos según <strong>la</strong> posición <strong>de</strong> los hogares en <strong>la</strong> pirámi<strong>de</strong> <strong>social</strong> 1 .<br />
Un or<strong>de</strong>namiento <strong>de</strong> <strong>la</strong> Encuesta Permanente <strong>de</strong> Hogares según el ingreso<br />
per capita familiar, muestra dos aspectos importantes:<br />
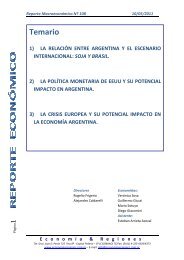
El primero, es que en <strong>la</strong> pob<strong>la</strong>ción económicamente activa <strong>de</strong>l cuartil <strong>de</strong><br />
menor ingreso per capita (es <strong>de</strong>cir, el 25%<br />
inferior) el <strong>de</strong>sempleo supera el 17%, el<br />
doble que el promedio, a lo que hay que<br />
agregar otro 15% que tiene trabajo <strong>de</strong><br />
manera intermitente, esto es rota entre<br />
ocupaciones informales <strong>de</strong> corta duración<br />
(menos <strong>de</strong> tres meses) con episodios<br />
recurrentes <strong>de</strong> <strong>de</strong>socupación. En otros<br />
términos, en <strong>la</strong> base <strong>de</strong> <strong>la</strong> sociedad todavía está muy extendida una<br />
precariedad <strong>la</strong>boral extrema.<br />
El segundo aspecto es que esta <strong>situación</strong> ha cambiado muy poco a<br />
partir <strong>de</strong> 2007. Des<strong>de</strong> <strong>la</strong> segunda mitad <strong>de</strong> ese año, el <strong>de</strong>sempleo en el<br />
cuartil inferior disminuyó menos <strong>de</strong> 2 puntos (en 4 <strong>de</strong> los 6 semestres<br />
fue incluso más alto) y <strong>la</strong> PEA en extrema precariedad 4 puntos (con un<br />
promedio cercano al inicial). Esta disminución es sensiblemente menor<br />
1. Véase <strong>la</strong> <strong>Newsletter</strong> <strong>de</strong> enero <strong>de</strong> 2011.<br />
En <strong>la</strong> pob<strong>la</strong>ción económicamente<br />
activa <strong>de</strong>l cuartil <strong>de</strong> menor<br />
ingreso per capita (es <strong>de</strong>cir, el<br />
25% inferior) el <strong>de</strong>sempleo<br />
supera el 17%, a lo que hay que<br />
agregar otro 15% que tiene<br />
trabajo <strong>de</strong> manera intermitente
pag [ 2 ]<br />
Sel Consultores :: <strong>Newsletter</strong><br />
JULIO 2011<br />
Esta <strong>situación</strong> ha cambiado muy<br />
poco a partir <strong>de</strong> 2007. Parecería<br />
que <strong>la</strong> condición <strong>la</strong>boral <strong>de</strong>l<br />
cuartil inferior está, si no<br />
totalmente estancada, mejorando<br />
<strong>de</strong> manera muy mo<strong>de</strong>sta<br />
vis à vis <strong>la</strong> baja <strong>de</strong> 19 puntos registrada en 2003-2007. Visto en su conjunto,<br />
parecería que <strong>la</strong> condición <strong>la</strong>boral <strong>de</strong>l cuartil inferior está, si no totalmente<br />
estancada, mejorando <strong>de</strong> manera muy mo<strong>de</strong>sta.<br />
DESOCUPACION EN EL CUARTIL INFERIOR DE LA POBLACION<br />
ECONOMICAMENTE ACTIVA 2003-2010<br />
40%<br />
35%<br />
30%<br />
25%<br />
20%<br />
15%<br />
10%<br />
5%<br />
0%<br />
36,3%<br />
Tasa <strong>de</strong> <strong>de</strong>sempleo<br />
18,9%<br />
2S 1S 2S 1S 2S 1S 2S 1S 2S 1S 2S 1S 2S 1S 2S<br />
2003 2004 2005 2006 2007 2008 2009 2010<br />
36,3% 35,7% 31,2% 30,7% 30,7% 27,1% 22,7% 21,6% 18,9% 20,2% 18,8% 19,6% 20,4% 18,4% 17,2%<br />
Fuente: SEL Consultores a partir <strong>de</strong> microdatos <strong>de</strong> <strong>la</strong> Encuesta Permanente <strong>de</strong> Hogares, INDEC<br />
SEL Consultores | Viamonte 524, 3º Piso | (C1053ABL) Bue Ar | (54-11) 4315-6781 | www.selconsultores.com.ar<br />
17,2%<br />
POBLACION ECONOMICAMENTE ACTIVA EN EXTREMA PRECARIEDAD<br />
EN EL CUARTIL INFERIOR DE INGRESO FAMILIAR PER CAPITA 2003-2010<br />
60%<br />
50%<br />
40%<br />
30%<br />
20%<br />
10%<br />
0%<br />
56%<br />
36,5%<br />
32,5%<br />
2S 1S 2S 1S 2S 1S 2S 1S 2S 1S 2S 1S 2S 1S 2S<br />
2003 2004 2005 2006 2007 2008 2009 2010<br />
Desempleados Ocupados informales con empleos intermitentes<br />
Fuente: SEL Consultores a partir <strong>de</strong> microdatos <strong>de</strong> <strong>la</strong> Encuesta Permanente <strong>de</strong> Hogares, INDEC
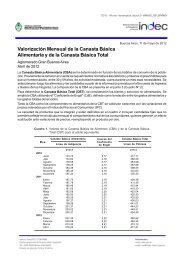
Esta observación se refuerza cuando se examina <strong>la</strong> calidad <strong>de</strong> <strong>la</strong> ocupación<br />
<strong>de</strong> los que tienen un empleo. La mitad <strong>de</strong> los ocupados <strong>de</strong>l cuartil inferior<br />
son informales (incluyendo los que tienen trabajos intermitentes). Esto<br />
significa que carecen <strong>de</strong> protección legal, seguridad <strong>social</strong> o beneficios como<br />
vacaciones, aguinaldo, o licencia paga por enfermedad 2 . 4 <strong>de</strong> cada 10<br />
adolecen <strong>de</strong> episodios recurrentes <strong>de</strong> <strong>de</strong>sempleo. Es <strong>de</strong>l todo probable,<br />
también, que sus sa<strong>la</strong>rios estén por <strong>de</strong>bajo <strong>de</strong> los <strong>de</strong> convenio.<br />
INFORMALIDAD LABORAL SEGÚN CUARTILES DE INGRESO<br />
FAMILIAR PER CAPITA 2º semestre 2010<br />
47,4%<br />
Cuartil 1<br />
(25% más pobre)<br />
30,3%<br />
21,8%<br />
Cuartil 2 Cuartil 3<br />
12,2%<br />
Cuartil 4<br />
(25% más rico)<br />
Fuente: SEL Consultores a partir <strong>de</strong> microdatos <strong>de</strong> <strong>la</strong> Encuesta Permanente <strong>de</strong> Hogares, INDEC<br />
Este fuerte peso <strong>de</strong> <strong>la</strong> informalidad, sumado a <strong>la</strong> persistencia <strong>de</strong> un<br />
<strong>de</strong>sempleo alto, hace que todavía cerca <strong>de</strong>l 60% <strong>de</strong> los miembros<br />
económicamente activos <strong>de</strong>l cuartil inferior <strong>de</strong> ingreso per capita tengan<br />
una ma<strong>la</strong> calidad <strong>la</strong>boral. Esto ha cambiado poco <strong>de</strong>s<strong>de</strong> 2007; <strong>la</strong> mejora<br />
<strong>de</strong>s<strong>de</strong> el segundo semestre <strong>de</strong> ese año es <strong>de</strong> menos <strong>de</strong> 4 puntos, vs. más <strong>de</strong><br />
13 puntos en el período 2003-2007.<br />
2. De acuerdo a <strong>la</strong> Encuesta Permanente <strong>de</strong> Hogares, el 85% <strong>de</strong> los asa<strong>la</strong>riados sin <strong>de</strong>scuentos<br />
jubi<strong>la</strong>torios (el modo en que ésta <strong>de</strong>fine a los informales) no tiene ningún beneficio.<br />
SEL Consultores | Viamonte 524, 3º Piso | (C1053ABL) Bue Ar | (54-11) 4315-6781 | www.selconsultores.com.ar<br />
Sel Consultores :: <strong>Newsletter</strong><br />
JULIO 2011<br />
Cerca <strong>de</strong>l 60% <strong>de</strong> los miembros<br />
económicamente activos <strong>de</strong>l<br />
cuartil inferior <strong>de</strong> ingreso per<br />
capita todavía tienen una ma<strong>la</strong><br />
calidad <strong>la</strong>boral<br />
pag [ 3 ]
pag [ 4 ]<br />
Sel Consultores :: <strong>Newsletter</strong><br />
JULIO 2011<br />
En el cuartil inferior el 60% <strong>de</strong> <strong>la</strong><br />
pob<strong>la</strong>ción carece <strong>de</strong> obra <strong>social</strong><br />
o medicina prepaga<br />
POBLACION ECONOMICAMENTE ACTIVA SIN EMPLEO O CON EMPLEOS<br />
DE BAJA CALIDAD EN EL CUARTIL INFERIOR DE INGRESO FAMILIAR<br />
PER CAPITA 2003-2010<br />
80%<br />
70%<br />
60%<br />
50%<br />
40%<br />
30%<br />
20%<br />
10%<br />
0%<br />
73,6%<br />
60,2%<br />
2S 1S 2S 1S 2S 1S 2S 1S 2S 1S 2S 1S 2S 1S 2S<br />
2003 2004 2005 2006 2007 2008 2009 2010<br />
Desempleados Ocupados informales<br />
Fuente: SEL Consultores a partir <strong>de</strong> microdatos <strong>de</strong> <strong>la</strong> Encuesta Permanente <strong>de</strong> Hogares, INDEC<br />
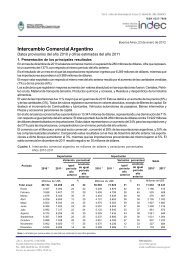
Otro indicador <strong>de</strong> bienestar -o <strong>de</strong> privación- es <strong>la</strong> proporción <strong>de</strong> <strong>la</strong> pob<strong>la</strong>ción<br />
que tiene una cobertura <strong>de</strong> salud. En el cuartil inferior <strong>de</strong> ingreso familiar per<br />
capita, el 60% carece <strong>de</strong> obra <strong>social</strong> o medicina prepaga, es <strong>de</strong>cir no está<br />
incluido en el sistema <strong>de</strong> seguridad <strong>social</strong> o en una opción <strong>de</strong> mercado. Esta<br />
pob<strong>la</strong>ción <strong>de</strong>pendiente <strong>de</strong>l sistema <strong>de</strong> salud pública es más <strong>de</strong>l doble que en<br />
el segundo cuartil, y diez veces más que en el cuartil superior.<br />
Esto tiene mucho que ver con <strong>la</strong> baja calidad <strong>de</strong> <strong>la</strong> inserción <strong>la</strong>boral en el cuartil<br />
inferior. La corre<strong>la</strong>ción con <strong>la</strong> informalidad, en efecto, es muy alta: el coeficiente<br />
R cuadrado entre estas variables es 0,96.<br />
Probablemente por esa asociación (o si se quiere, por <strong>la</strong> persistencia <strong>de</strong> una<br />
baja calidad <strong>la</strong>boral), no resulta sorpren<strong>de</strong>nte que el índice <strong>de</strong> privación <strong>de</strong><br />
cobertura <strong>de</strong> salud casi no haya cambiado <strong>de</strong>s<strong>de</strong> 2007. La reducción es <strong>de</strong> 2<br />
puntos, lo que contrasta con <strong>la</strong> baja <strong>de</strong> 13 puntos <strong>de</strong>l período 2003-2007.<br />
SEL Consultores | Viamonte 524, 3º Piso | (C1053ABL) Bue Ar | (54-11) 4315-6781 | www.selconsultores.com.ar<br />
56,5%
POBLACION SIN COBERTURA DE SALUD SEGÚN CUARTILES DE INGRESO<br />
FAMILIAR PER CAPITA 2º semestre 2010<br />
59,8%<br />
Cuartil 1<br />
(25% más pobre)<br />
28,8%<br />
POBLACION SIN COBERTURA DE SALUD EN EL CUARTIL INFERIOR<br />
DE INGRESO FAMILIAR PER CAPITA 2003-2010<br />
Pob<strong>la</strong>ción sin cobertura <strong>de</strong> salud<br />
15,6%<br />
Cuartil 2 Cuartil 3<br />
5,8%<br />
Cuartil 4<br />
(25% más rico)<br />
Fuente: SEL Consultores a partir <strong>de</strong> microdatos <strong>de</strong> <strong>la</strong> Encuesta Permanente <strong>de</strong> Hogares, INDEC<br />
80%<br />
75%<br />
70%<br />
65%<br />
60%<br />
55%<br />
50%<br />
45%<br />
40%<br />
74,8%<br />
61,9%<br />
59,8%<br />
2S 1S 2S 1S 2S 1S 2S 1S 2S 1S 2S 1S 2S 1S 2S<br />
2003 2004 2005 2006 2007 2008 2009 2010<br />
Fuente: SEL Consultores a partir <strong>de</strong> microdatos <strong>de</strong> <strong>la</strong> Encuesta Permanente <strong>de</strong> Hogares, INDEC<br />
SEL Consultores | Viamonte 524, 3º Piso | (C1053ABL) Bue Ar | (54-11) 4315-6781 | www.selconsultores.com.ar<br />
Sel Consultores :: <strong>Newsletter</strong><br />
JULIO 2011<br />
pag [ 5 ]
pag [ 6 ]<br />
Sel Consultores :: <strong>Newsletter</strong><br />
JULIO 2011<br />
En 2007-2010 se observa alguna<br />
mejoría en <strong>la</strong>s condiciones<br />
habitacionales, aunque para<br />
unas 2,5 millones <strong>de</strong> personas<br />
son <strong>de</strong> extrema precariedad<br />
Las condiciones habitacionales <strong>de</strong>l cuartil inferior también son <strong>de</strong>ficitarias,<br />
aunque, a diferencia <strong>de</strong> los indicadores anteriores, en este caso no hay un<br />
contraste significativo con <strong>la</strong> evolución <strong>de</strong>l período 2003-2007. Es más, comparado<br />
con éste se observa alguna mejoría en 2007-2010. De todos modos,<br />
persisten índices altos <strong>de</strong> hacinamiento 3 (26%); viviendas localizadas en<br />
basurales (14%); zonas inundables (19%); formas precarias <strong>de</strong> acceso al agua<br />
(15%); o carencia <strong>de</strong> cloacas (56%). En este último caso, y a diferencia <strong>de</strong> <strong>la</strong>s<br />
otras variables, es l<strong>la</strong>mativo que, no obstante el fuerte crecimiento <strong>de</strong> <strong>la</strong> inversión<br />
pública en infraestructura, <strong>la</strong> mejora para el cuartil inferior <strong>de</strong>s<strong>de</strong> el<br />
segundo semestre <strong>de</strong> 2007 haya sido muy escasa: 3,5 puntos (en el primer<br />
semestre <strong>de</strong> ese año <strong>la</strong> carencia <strong>de</strong> cloacas afectaba al 58%). Consi<strong>de</strong>rando el<br />
conjunto <strong>de</strong> estos indicadores, alre<strong>de</strong>dor <strong>de</strong> unas 2,5 millones <strong>de</strong> personas<br />
están en una <strong>situación</strong> <strong>de</strong> extrema precariedad habitacional.<br />
POBLACION POR UBICACION DE LA VIVIENDA EN EL CUARTIL INFERIOR<br />
DE INGRESO FAMILIAR PER CAPITA<br />
2003-2010<br />
2003 2004 2005 2006 2007 2008 2009 2010<br />
2S<br />
1S<br />
2S<br />
1S<br />
2S<br />
1S<br />
2S<br />
1S<br />
2S<br />
1S<br />
2S<br />
1S<br />
2S<br />
1S<br />
2S<br />
0% 5% 10% 15% 20% 25%<br />
Vivienda ubicada en zona que se inundó en los últimos 12 meses<br />
Vivienda ubicada a 3 cuadras o menos <strong>de</strong> basurales<br />
Fuente: SEL Consultores a partir <strong>de</strong> microdatos <strong>de</strong> <strong>la</strong> Encuesta Permanente <strong>de</strong> Hogares, INDEC<br />
3. Definido por 3 ó más personas por cuarto<br />
SEL Consultores | Viamonte 524, 3º Piso | (C1053ABL) Bue Ar | (54-11) 4315-6781 | www.selconsultores.com.ar
CONDICIONES HABITACIONALES DE LA POBLACION<br />
DEL CUARTIL INFERIOR DE INGRESO FAMILIAR PER CAPITA<br />
2003-2010<br />
2003 2004 2005 2006 2007 2008 2009 2010<br />
2S<br />
1S<br />
2S<br />
1S<br />
2S<br />
1S<br />
2S<br />
1S<br />
2S<br />
1S<br />
2S<br />
1S<br />
2S<br />
1S<br />
2S<br />
0% 10% 20% 30% 40% 50% 60% 70%<br />
Hacinados Sin cloacas Formas precarias <strong>de</strong> acceso al agua<br />
Fuente: SEL Consultores a partir <strong>de</strong> microdatos <strong>de</strong> <strong>la</strong> Encuesta Permanente <strong>de</strong> Hogares, INDEC<br />
La resistencia <strong>de</strong>l núcleo duro <strong>de</strong> <strong>la</strong> pobreza a replegarse en un escenario <strong>de</strong><br />
alto crecimiento económico, tiene que ver, en una medida no menor, con una<br />
<strong>situación</strong> estructural <strong>de</strong> bajo capital humano. No obstante los esfuerzos<br />
realizados, y <strong>la</strong> mejora observada (algo más <strong>de</strong> 4 puntos <strong>de</strong>s<strong>de</strong> 2003 y 2<br />
<strong>de</strong>s<strong>de</strong> 2007) todavía más <strong>de</strong>l 80% <strong>de</strong> <strong>la</strong> pob<strong>la</strong>ción <strong>de</strong>l cuartil inferior tiene un<br />
nivel educativo no mayor a secundaria incompleta, y más <strong>de</strong> 55% <strong>de</strong> apenas<br />
hasta primaria completa. En promedio, esta pob<strong>la</strong>ción ha aprobado menos<br />
<strong>de</strong> 8 años <strong>de</strong> educación.<br />
Este bajo perfil educativo general se replica en el <strong>de</strong> <strong>la</strong> pob<strong>la</strong>ción económicamente<br />
activa. Los miembros <strong>de</strong> estos hogares que están en el mercado <strong>de</strong><br />
trabajo tienen, en promedio, poco más <strong>de</strong> 9 años <strong>de</strong> educación. No es sorpren<strong>de</strong>nte,<br />
entonces, <strong>la</strong> dificultad que afrontan para competir por los empleos <strong>de</strong><br />
buena calidad. Sin una mejora sustantiva <strong>de</strong>l capital humano, es dudoso que<br />
puedan salir <strong>de</strong> esta <strong>situación</strong> <strong>de</strong> una manera sostenible.<br />
SEL Consultores | Viamonte 524, 3º Piso | (C1053ABL) Bue Ar | (54-11) 4315-6781 | www.selconsultores.com.ar<br />
Sel Consultores :: <strong>Newsletter</strong><br />
JULIO 2011<br />
Todavía más <strong>de</strong>l 80% <strong>de</strong> <strong>la</strong><br />
pob<strong>la</strong>ción <strong>de</strong>l cuartil inferior<br />
tiene un nivel educativo no<br />
mayor a secundaria incompleta,<br />
y más <strong>de</strong> 55% <strong>de</strong> apenas hasta<br />
primaria completa<br />
pag [ 7 ]
pag [ 8 ]<br />
Sel Consultores :: <strong>Newsletter</strong><br />
JULIO 2011<br />
NIVEL EDUCATIVO DE LA POBLACION SEGUN CUARTILES DE INGRESO<br />
FAMILIAR PER CAPITA<br />
2º semestre 2010<br />
Cuartil 4<br />
(25% más rico)<br />
Cuartil 3<br />
Cuartil 2<br />
Cuartil 1<br />
(25% más pobre)<br />
19,5% 10,1%<br />
36,0%<br />
46,1%<br />
17,2%<br />
55,8%<br />
36,4%<br />
21,0%<br />
Hasta primario completo (incluye sin instrucción)<br />
Secundario incompleto<br />
Secundario completo y universitario o terciario incompleto<br />
Universitario y terciario completo<br />
Fuente: SEL Consultores a partir <strong>de</strong> microdatos <strong>de</strong> <strong>la</strong> Encuesta Permanente <strong>de</strong> Hogares, INDEC<br />
AÑOS PROMEDIO DE EDUCACION SEGUN CUARTILES<br />
DE INGRESO FAMILIAR PER CAPITA<br />
2º semestre 2010<br />
7,8<br />
Cuartil 1<br />
(25% más pobre)<br />
SEL Consultores | Viamonte 524, 3º Piso | (C1053ABL) Bue Ar | (54-11) 4315-6781 | www.selconsultores.com.ar<br />
8,9<br />
10,3<br />
Cuartil 2 Cuartil 3<br />
25,2%<br />
33,8%<br />
27,2%<br />
33,9%<br />
13,0%<br />
« 5,6%<br />
16,8% « 2,1%<br />
13,2<br />
Cuartil 4<br />
(25% más rico)<br />
Fuente: SEL Consultores a partir <strong>de</strong> microdatos <strong>de</strong> <strong>la</strong> Encuesta Permanente <strong>de</strong> Hogares, INDEC
AÑOS DE EDUCACION PROMEDIO DE LA POBLACION ECONOMICAMENTE<br />
ACTIVA SEGUN CUARTILES DE INGRESO FAMILIAR PER CAPITA<br />
2º semestre 2010<br />
9,3<br />
Cuartil 1<br />
(25% más pobre)<br />
10,0<br />
Fuente: SEL Consultores a partir <strong>de</strong> microdatos <strong>de</strong> <strong>la</strong> Encuesta Permanente <strong>de</strong> Hogares, INDEC<br />
LOS JOVENES QUE NO ESTUDIAN NI TRABAJAN,<br />
UN PROBLEMA CRECIENTE<br />
Un tema que ha adquirido importancia <strong>de</strong>s<strong>de</strong> mediados <strong>de</strong> los años noventa,<br />
y que va en contra <strong>de</strong> los objetivos <strong>de</strong> inclusión <strong>social</strong>, es el <strong>de</strong> los jóvenes que<br />
no estudian ni trabajan. Éstos constituyen un caso extremo <strong>de</strong> exclusión, y<br />
probablemente como consecuencia <strong>de</strong> ello, una base principal <strong>de</strong> <strong>la</strong> violencia<br />
urbana. Lo l<strong>la</strong>mativo y preocupante, es que, no obstante el crecimiento <strong>de</strong> <strong>la</strong><br />
economía, <strong>la</strong> mejora en el mercado <strong>de</strong> trabajo y el significativo esfuerzo en el<br />
presupuesto educativo, <strong>la</strong> proporción <strong>de</strong> jóvenes <strong>de</strong> 15-24 años en esta <strong>situación</strong><br />
no ha cesado <strong>de</strong> crecer. En 2003, en efecto, era <strong>de</strong> algo menos <strong>de</strong> 8% y<br />
ahora es <strong>de</strong> casi 10% 4 . Esto es unos 700 mil jóvenes, 150 mil más que a <strong>la</strong><br />
salida <strong>de</strong> <strong>la</strong> crisis. Prácticamente <strong>la</strong> totalidad <strong>de</strong> este aumento se produjo a<br />
partir <strong>de</strong>l segundo semestre <strong>de</strong> 2007.<br />
El problema es especialmente serio en los sectores <strong>de</strong> menores ingresos. En el<br />
cuartil inferior, <strong>la</strong> proporción <strong>de</strong> jóvenes <strong>de</strong> 15-24 años que no estudian ni<br />
trabajan es <strong>de</strong> 15%, lo que representa un incremento <strong>de</strong> casi 4 puntos respecto<br />
<strong>de</strong> 2003. También aquí el salto ocurrió en el segundo semestre <strong>de</strong> 2007.<br />
Es difícil explicar el crecimiento <strong>de</strong> los jóvenes en <strong>situación</strong> <strong>de</strong> exclusión<br />
extrema, pero posiblemente tiene que ver con su bajo capital humano (<strong>la</strong><br />
mayoría son <strong>de</strong>sertores tempranos <strong>de</strong>l sistema educativo) que les dificulta<br />
competir en el mercado <strong>la</strong>boral, y –en un escenario <strong>de</strong> más corto p<strong>la</strong>zo- con el<br />
aumento <strong>de</strong> <strong>la</strong>s disparida<strong>de</strong>s sa<strong>la</strong>riales, ya no sólo entre los empleos <strong>de</strong><br />
buena calidad y los empleos informales a los que con ese déficit competitivo<br />
quedan casi siempre restringidos, sino con <strong>la</strong>s alternativas <strong>de</strong> ingresos fuera<br />
<strong>de</strong>l mercado, incluyendo a veces <strong>la</strong>s no legales.<br />
11,2<br />
Cuartil 2 Cuartil 3<br />
SEL Consultores | Viamonte 524, 3º Piso | (C1053ABL) Bue Ar | (54-11) 4315-6781 | www.selconsultores.com.ar<br />
13,4<br />
Cuartil 4<br />
(25% más rico)<br />
4. El cálculo se ha efectuado excluyendo <strong>de</strong> los inactivos que no estudian, <strong>la</strong>s mujeres que se<br />
<strong>de</strong>dican a los quehaceres domésticos.<br />
Sel Consultores :: <strong>Newsletter</strong><br />
JULIO 2011<br />
Unos 700 mil jóvenes <strong>de</strong> 15-24<br />
años no estudian ni trabajan.<br />
Esto es 150 mil más que a <strong>la</strong><br />
salida <strong>de</strong> <strong>la</strong> crisis en 2003.<br />
pag [ 9 ]
pag [ 10 ]<br />
Sel Consultores :: <strong>Newsletter</strong><br />
JULIO 2011<br />
JOVENES DE 15-24 AÑOS DE EDAD QUE NO ESTUDIAN NI TRABAJAN<br />
2003-2010<br />
11%<br />
10%<br />
9%<br />
8%<br />
7%<br />
6%<br />
7,9%<br />
2S 1S 2S 1S 2S 1S 2S 1S 2S 1S 2S 1S 2S 1S 2S<br />
2003 2004 2005 2006 2007 2008 2009 2010<br />
7,9% 7,2% 8,2% 7,8% 8,0% 8,0% 8,1% 8,0% 10,7 9,4% 10,0 9,2% 10,6 9,4% 9,9%<br />
No estudian ni trabajan<br />
Fuente: SEL Consultores a partir <strong>de</strong> microdatos <strong>de</strong> <strong>la</strong> Encuesta Permanente <strong>de</strong> Hogares, INDEC<br />
SEL Consultores | Viamonte 524, 3º Piso | (C1053ABL) Bue Ar | (54-11) 4315-6781 | www.selconsultores.com.ar<br />
9,9%<br />
JOVENES DE 15-19 AÑOS Y 20-24 AÑOS QUE NO ESTUDIAN NI TRABAJAN<br />
2003-2010<br />
13%<br />
12%<br />
11%<br />
10%<br />
9%<br />
8%<br />
7%<br />
6%<br />
5%<br />
2S 1S 2S 1S 2S 1S 2S 1S 2S 1S 2S 1S 2S 1S 2S<br />
2003 2004 2005 2006 2007 2008 2009 2010<br />
9,3% 8,0% 10,0% 8,8% 9,1% 9,0% 9,0% 8,5% 12,0%10,1% 10,5% 10,1%11,4% 9,9% 10,4%<br />
6,5% 6,3% 6,5% 6,7% 6,8% 6,9% 7,2% 7,5% 9,2% 8,7% 9,4% 8,3% 9,6% 8,8% 9,5%<br />
15-19 años 20-24 años<br />
Fuente: SEL Consultores a partir <strong>de</strong> microdatos <strong>de</strong> <strong>la</strong> Encuesta Permanente <strong>de</strong> Hogares, INDEC
JOVENES DE 15-24 AÑOS DE EDAD QUE NO ESTUDIAN NI TRABAJAN<br />
SEGUN CUARTILES DE INGRESO FAMILIAR PER CAPITA<br />
2º semestre 2010<br />
15,2%<br />
Cuartil 1<br />
(25% más pobre)<br />
8,8%<br />
5,1%<br />
Cuartil 2 Cuartil 3<br />
3,3%<br />
Cuartil 4<br />
(25% más rico)<br />
Fuente: SEL Consultores a partir <strong>de</strong> microdatos <strong>de</strong> <strong>la</strong> Encuesta Permanente <strong>de</strong> Hogares, INDEC<br />
JOVENES DE 15-24 AÑOS DE EDAD QUE NO ESTUDIAN NI TRABAJAN<br />
EN EL CUARTIL INFERIOR DE INGRESO FAMILIAR PER CAPITA<br />
2003-2010<br />
17%<br />
16%<br />
15%<br />
14%<br />
13%<br />
12%<br />
11%<br />
10%<br />
11,5%<br />
2S 1S 2S 1S 2S 1S 2S 1S 2S 1S 2S 1S 2S 1S 2S<br />
2003 2004 2005 2006 2007 2008 2009 2010<br />
11,5% 11,5% 12,9% 11,4% 12,5% 12,5% 13,4% 12,6% 15,5% 14,2% 15,4% 14,4% 15,8% 14,3% 15,2%<br />
25% más pobre<br />
Fuente: SEL Consultores a partir <strong>de</strong> microdatos <strong>de</strong> <strong>la</strong> Encuesta Permanente <strong>de</strong> Hogares, INDEC<br />
15,2%<br />
SEL Consultores | Viamonte 524, 3º Piso | (C1053ABL) Bue Ar | (54-11) 4315-6781 | www.selconsultores.com.ar<br />
Sel Consultores :: <strong>Newsletter</strong><br />
JULIO 2011<br />
pag [ 11 ]