pagares alimentos maravilla i - Bolsa de Valores Nacional
pagares alimentos maravilla i - Bolsa de Valores Nacional
pagares alimentos maravilla i - Bolsa de Valores Nacional

You also want an ePaper? Increase the reach of your titles
YUMPU automatically turns print PDFs into web optimized ePapers that Google loves.
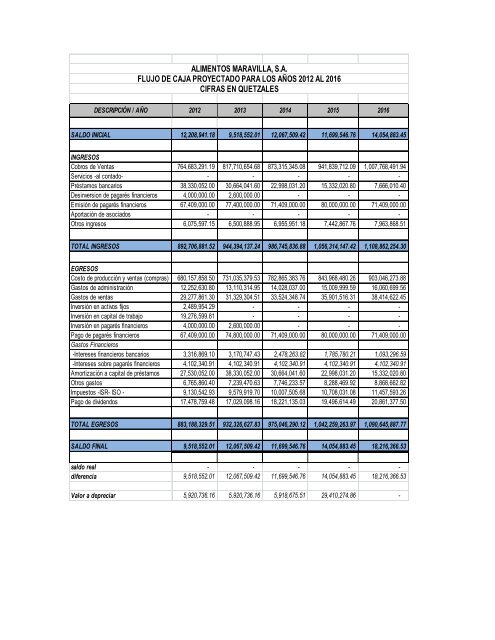
ALIMENTOS MARAVILLA, S.A.FLUJO DE CAJA PROYECTADO PARA LOS AÑOS 2012 AL 2016CIFRAS EN QUETZALESDESCRIPCIÓN / AÑO 2012 2013 2014 2015 2016SALDO INICIAL 12,208,941.18 9,518,552.01 12,067,509.42 11,699,546.76 14,054,883.45INGRESOSCobros <strong>de</strong> Ventas 764,683,291.19 817,710,654.68 873,315,345.08 941,839,712.09 1,007,768,491.94Servicios -al contado- - - - - -Préstamos bancarios 38,330,052.00 30,664,041.60 22,998,031.20 15,332,020.80 7,666,010.40Desinversion <strong>de</strong> pagarés financieros 4,000,000.00 2,600,000.00 - - -Emisión <strong>de</strong> pagarés financieros 67,409,000.00 77,400,000.00 71,409,000.00 80,000,000.00 71,409,000.00Aportación <strong>de</strong> asociados - - - - -Otros ingresos 6,075,597.15 6,500,888.95 6,955,951.18 7,442,867.76 7,963,868.51TOTAL INGRESOS 892,706,881.52 944,394,137.24 986,745,836.88 1,056,314,147.42 1,108,862,254.30EGRESOSCosto <strong>de</strong> producción y ventas (compras) 680,157,858.50 731,035,379.53 782,865,383.76 843,968,480.26 903,046,273.88Gastos <strong>de</strong> administración 12,252,630.80 13,110,314.95 14,028,037.00 15,009,999.59 16,060,699.56Gastos <strong>de</strong> ventas 29,277,861.30 31,329,304.51 33,524,348.74 35,901,516.31 38,414,622.45Inversión en activos fijos 2,489,954.29 - - - -Inversión en capital <strong>de</strong> trabajo 19,276,599.81 - - - -Inversión en pagarés financieros 4,000,000.00 2,600,000.00 - - -Pago <strong>de</strong> pagarés financieros 67,409,000.00 74,800,000.00 71,409,000.00 80,000,000.00 71,409,000.00Gastos Financieros-Intereses financieros bancarios 3,316,869.10 3,170,747.43 2,478,263.82 1,785,780.21 1,093,296.59-Intereses sobre pagarés financieros 4,102,340.91 4,102,340.91 4,102,340.91 4,102,340.91 4,102,340.91Amortización a capital <strong>de</strong> préstamos 27,530,052.00 38,330,052.00 30,664,041.60 22,998,031.20 15,332,020.80Otros gastos 6,765,860.40 7,239,470.63 7,746,233.57 8,288,469.92 8,868,662.82Impuestos -ISR- ISO - 9,130,542.93 9,579,919.70 10,007,505.68 10,708,031.08 11,457,593.26Pago <strong>de</strong> divi<strong>de</strong>ndos 17,478,759.48 17,029,098.16 18,221,135.03 19,496,614.49 20,861,377.50TOTAL EGRESOS 883,188,329.51 932,326,627.83 975,046,290.12 1,042,259,263.97 1,090,645,887.77SALDO FINAL 9,518,552.01 12,067,509.42 11,699,546.76 14,054,883.45 18,216,366.53saldo real - - - - -diferencia 9,518,552.01 12,067,509.42 11,699,546.76 14,054,883.45 18,216,366.53Valor a <strong>de</strong>preciar 5,920,736.16 5,920,736.16 5,918,675.51 29,410,274.86 -