pagares alimentos maravilla i - Bolsa de Valores Nacional
pagares alimentos maravilla i - Bolsa de Valores Nacional
pagares alimentos maravilla i - Bolsa de Valores Nacional

Create successful ePaper yourself
Turn your PDF publications into a flip-book with our unique Google optimized e-Paper software.
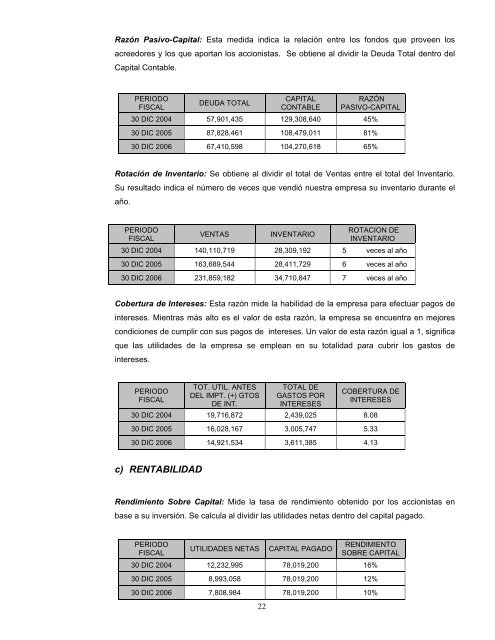
Razón Pasivo-Capital: Esta medida indica la relación entre los fondos que proveen losacreedores y los que aportan los accionistas. Se obtiene al dividir la Deuda Total <strong>de</strong>ntro <strong>de</strong>lCapital Contable.PERIODOFISCALDEUDA TOTALCAPITALCONTABLERAZÓNPASIVO-CAPITAL30 DIC 2004 57,901,435 129,308,640 45%30 DIC 2005 87,828,461 108,479,011 81%30 DIC 2006 67,410,598 104,270,618 65%Rotación <strong>de</strong> Inventario: Se obtiene al dividir el total <strong>de</strong> Ventas entre el total <strong>de</strong>l Inventario.Su resultado indica el número <strong>de</strong> veces que vendió nuestra empresa su inventario durante elaño.PERIODOFISCALVENTASINVENTARIOROTACION DEINVENTARIO30 DIC 2004 140,110,719 28,309,192 5 veces al año30 DIC 2005 163,689,544 28,411,729 6 veces al año30 DIC 2006 231,859,182 34,710,847 7 veces al añoCobertura <strong>de</strong> Intereses: Esta razón mi<strong>de</strong> la habilidad <strong>de</strong> la empresa para efectuar pagos <strong>de</strong>intereses. Mientras más alto es el valor <strong>de</strong> esta razón, la empresa se encuentra en mejorescondiciones <strong>de</strong> cumplir con sus pagos <strong>de</strong> intereses. Un valor <strong>de</strong> esta razón igual a 1, significaque las utilida<strong>de</strong>s <strong>de</strong> la empresa se emplean en su totalidad para cubrir los gastos <strong>de</strong>intereses.PERIODOFISCALTOT. UTIL. ANTESDEL IMPT. (+) GTOSDE INT.TOTAL DEGASTOS PORINTERESESCOBERTURA DEINTERESES30 DIC 2004 19,716,872 2,439,025 8.0830 DIC 2005 16,028,167 3,005,747 5.3330 DIC 2006 14,921,534 3,611,385 4.13c) RENTABILIDADRendimiento Sobre Capital: Mi<strong>de</strong> la tasa <strong>de</strong> rendimiento obtenido por los accionistas enbase a su inversión. Se calcula al dividir las utilida<strong>de</strong>s netas <strong>de</strong>ntro <strong>de</strong>l capital pagado.PERIODOFISCALUTILIDADES NETAS22CAPITAL PAGADORENDIMIENTOSOBRE CAPITAL30 DIC 2004 12,232,995 78,019,200 16%30 DIC 2005 8,993,058 78,019,200 12%30 DIC 2006 7,808,984 78,019,200 10%