- Page 2 and 3:
Serie MonografíasCalendario Meteor
- Page 4:
PRESENTACIÓNLa presente edición d
- Page 7:
mino medio a lo largo del último s
- Page 12:
DATOS ASTRONÓMICOS PARA 2011Los da
- Page 18 and 19:
Nota: 15º de arco en la longitud e
- Page 22 and 23:
DATOS LUNARESLas horas de orto y oc
- Page 26:
CALENDARIO
- Page 53 and 54:
CALENDARIO MUSULMÁNEl año 2011 de
- Page 56 and 57:
EL TIEMPO EN ESPAÑA DURANTE EL AÑ
- Page 58 and 59:
Canarias el mes fue relativamente h
- Page 60 and 61:
en Galicia, área pirenaica, litora
- Page 62 and 63:
De los observatorios principales, l
- Page 64 and 65:
tando por cuencas el volumen de agu
- Page 66 and 67:
nes muy abundantes en las regiones
- Page 68 and 69:
dental peninsular, con totales acum
- Page 70 and 71:
El mes de Marzo resultó menos sole
- Page 72 and 73:
La precipitación máxima diaria ac
- Page 74 and 75:
La precipitación máxima diaria ac
- Page 76 and 77:
En la primera decena del mes se reg
- Page 78 and 79:
Temperatura máxima 41.8 ºCBadajoz
- Page 80 and 81:
Distribución de la frecuencia de l
- Page 82 and 83:
PRIMAVERA 2010La primavera de 2010
- Page 84 and 85:
Carácter anual de la precipitació
- Page 86 and 87:
TEMPERATURA MÁXIMA ABSOLUTA (ºC)A
- Page 88 and 89:
TEMPERATURA MÍNIMA ABSOLUTA (ºC)A
- Page 90 and 91:
TEMPERATURA MEDIA DE LAS MÁXIMAS (
- Page 92 and 93:
TEMPERATURA MEDIA DE LAS MÍNIMAS (
- Page 94 and 95:
TEMPERATURA MEDIA MENSUAL (ºC)Año
- Page 96 and 97:
CARÁCTER DE LA TEMPERATURA MEDIA M
- Page 98 and 99:
PRECIPITACIÓN TOTAL MENSUALAño Ag
- Page 100 and 101:
CARÁCTER DE LA PRECIPITACIÓN TOTA
- Page 102 and 103:
N.º DE DÍAS DE PRECIPITACIÓN MAY
- Page 104 and 105:
HORAS DE SOLAño Agrícola 2009-201
- Page 106 and 107:
105DIRECCIÓN Y VELOCIDAD (KM/H) DE
- Page 108 and 109:
DÍAS DE HELADAAño Agrícola 2009-
- Page 110 and 111:
Temperatura máxima absoluta: Año
- Page 112:
Número de días de helada: Año ag
- Page 116 and 117:
AGROMETEOROLOGIA 2009-2010El límit
- Page 118 and 119:
oletín consta de 52 semanas, fijá
- Page 120 and 121:
119
- Page 122 and 123:
121
- Page 124 and 125:
123
- Page 126 and 127:
125
- Page 128 and 129: 127
- Page 130 and 131: 129
- Page 132 and 133: 131
- Page 134 and 135: FENOLOGIAEn los campos y montes con
- Page 136 and 137: en la mayor parte de Andalucía y e
- Page 138 and 139: La fauna soportó unas duras condic
- Page 140 and 141: observamos aviones comunes en Prín
- Page 142 and 143: Notas para la observación fenológ
- Page 144 and 145: estados tipo fenológicos perteneci
- Page 146: 145
- Page 150 and 151: AGUA PRECIPITADA EN ESPAÑA PENINSU
- Page 152 and 153: NORTE 219 95 91 100 72 83 64 30 45
- Page 154 and 155: luar el balance hídrico propiament
- Page 156 and 157: peninsulares. Ello contrastaba fuer
- Page 158 and 159: Andalucía y algunas áreas del oes
- Page 160 and 161: es y aisladas, de la Meseta Inferio
- Page 162 and 163: VALORES EN PORCENTAJE SOBRE LA CAPA
- Page 164 and 165: SITUACIÓN DE LOS EMBALSES EN LAS C
- Page 166 and 167: 165
- Page 168 and 169: 1859-60. . . . . . . . . . . . . 14
- Page 170: MEDIO AMBIENTE
- Page 173 and 174: Este programa ordinario se amplía
- Page 175 and 176: Dióxido de azufreEl valor medio an
- Page 177 and 178: 176
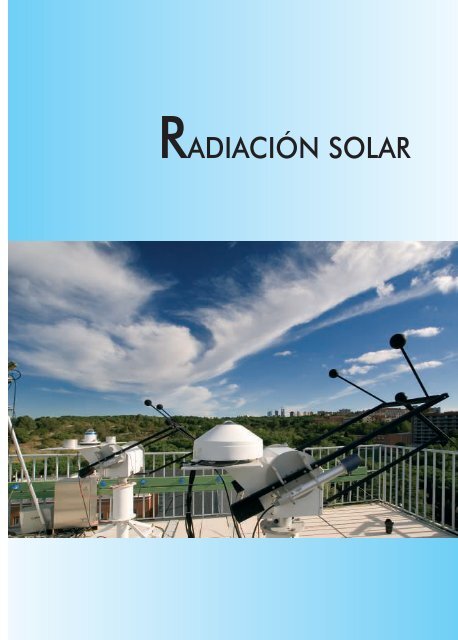
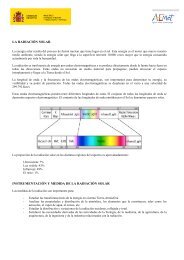
- Page 182 and 183: RADIACIÓN SOLAR EN ESPAÑALa Red R
- Page 184 and 185: 183
- Page 186 and 187: 185
- Page 188 and 189: RADIACIÓN GLOBAL MEDIA DIARIAUnida
- Page 190 and 191: RADIACIÓN GLOBAL MEDIA DIARIAUnida
- Page 192 and 193: 191
- Page 194 and 195: 193
- Page 196 and 197: 195
- Page 198 and 199: 197
- Page 200: TORMENTASELÉCTRICAS
- Page 203 and 204: Por último, sólo queda destacar q
- Page 205 and 206: 204
- Page 207 and 208: 206
- Page 209 and 210: 208
- Page 211 and 212: 210
- Page 213 and 214: 212
- Page 216 and 217: EL CLIMA Y TÚComo todos los años,
- Page 218 and 219: amplia de servicios climáticos cuy
- Page 220: FRANCISCO YÁÑEZ GÁLVEZ (Alhendí
- Page 224 and 225: ¿QUÉ ES EL GRUPO INTERGUBERNAMENT
- Page 226 and 227: 2. El Grupo de Trabajo II (WG2) eva
- Page 228 and 229: de la sensibilidad climática y ofr
- Page 230 and 231:
narios climáticos destinados a la
- Page 232 and 233:
Figura 4. Gráfica izquierda: Las l
- Page 234 and 235:
PREDICCIÓN DE EVENTOS DE POLEN ALE
- Page 236 and 237:
Figura 1. Gramíneas como causa de
- Page 238 and 239:
El periodo de máxima incidencia at
- Page 240 and 241:
marzo fue relativamente cálida per
- Page 242 and 243:
valor, más personas se ven afectad
- Page 244 and 245:
Con estos datos en la mano, podemos
- Page 246 and 247:
GARCÍA-MOZO, H., C. GALÁN, M.J. A
- Page 248 and 249:
2. PRESENTACIÓN DE RESULTADOSLos r
- Page 250 and 251:
entre el veintisiete de diciembre y
- Page 252 and 253:
251
- Page 254 and 255:
253
- Page 256 and 257:
255
- Page 258 and 259:
DISTRIBUCIÓN ESPACIAL DE TEMPERATU
- Page 260 and 261:
2. Una segunda aproximación fue el
- Page 262 and 263:
4.2. Ajuste de la predicción de la
- Page 264 and 265:
Acción 5: distribución de product
- Page 266 and 267:
LAS NUEVAS REDES DE DATOS METEOROL
- Page 268 and 269:
César Rodriguez Ballesteros, en su
- Page 270 and 271:
La realidad es que tanto en Grupos
- Page 272 and 273:
ESTUDIO FENOLÓGICO DEL CICLO BIOL
- Page 274 and 275:
hábitat ocupado por los sisones. L
- Page 276 and 277:
el 23 de febrero de 2003, sobre un
- Page 278 and 279:
La partida de los últimos invernan
- Page 280 and 281:
DISCUSIÓNDurante el invierno los s
- Page 282:
GARCÍA DE LA MORENA, E. L., MORALE
- Page 286 and 287:
Págs...Presentación .............
- Page 288:
Págs...Gráficas umbrales UVI ....