tabla 3 - producto nacional bruto a precios constantes de 1954
tabla 3 - producto nacional bruto a precios constantes de 1954
tabla 3 - producto nacional bruto a precios constantes de 1954

You also want an ePaper? Increase the reach of your titles
YUMPU automatically turns print PDFs into web optimized ePapers that Google loves.
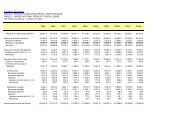
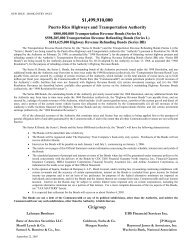
Ir al índice - Go to in<strong>de</strong>xTABLA 3 - PRODUCTO NACIONAL BRUTO A PRECIOS CONSTANTES DE <strong>1954</strong>: AÑOS FISCALESTABLE 3 - GROSS NATIONAL PRODUCT IN CONSTANT <strong>1954</strong> DOLLARS: FISCAL YEARS(En millones <strong>de</strong> dólares - In millions of dollars)1999 2000 2001 2002 2003 2004 2005 2006r 2007r 2008pPRODUCTO NACIONAL BRUTO 6,300.1 6,487.1 6,585.1 6,562.6 6,702.7 6,886.2 7,019.6 7,055.5 6,918.8 6,742.4Gastos <strong>de</strong> consumo personal 7,662.9 7,896.4 7,974.8 8,179.0 8,483.3 8,846.7 9,161.4 9,333.0 9,507.5 9,461.4Artículos dura<strong>de</strong>ros 1, 489 . 01,407 . 5 1,435 . 91, 437 . 71, 415.9 1,431 . 1 1,658 . 8 1, 709 . 2 1, 740 . 5 1, 634 . 8Artículos no dura<strong>de</strong>ros 3,043.2 3,130.6 3,169.2 3,194.0 3,234.3 3,361.0 3,461.9 3,578.4 3,716.3 3,693.9Servicios 3,130.6 3,358.4 3,369.8 3,547.3 3,833.1 4,054.5 4,040.8 4,045.4 4,050.8 4,132.7Gastos <strong>de</strong> consumo <strong>de</strong>l gobierno 1,742.3 1,644.9 1,708.9 1,803.1 1,847.9 1,858.4 1,934.5 1,935.6 1,909.7 1,786.6Gobierno central <strong>de</strong>l E.L.A. (1) 1,402.7 1,288.6 1,349.5 1,421.0 1,433.6 1,455.9 1,522.1 1,492.9 1,437.4 1,309.7Municipios 339.6 356.3 359.4 382.1 414.3 402.5 412.4 442.8 472.4 476.8Inversión interna bruta, total 2,001.3 1,990.3 2,013.8 1,872.5 1,871.9 2,015.3 1,936.0 1,928.8 1,850.3 1,719.7Cambio en inventarios 108.9 68.4 109.3 45.2 47.5 74.5 77.2 84.2 53.8 73.6Inversión interna bruta <strong>de</strong>capital fijo 1,892.4 1,922.0 1,904.6 1,827.2 1,824.5 1,940.8 1,858.8 1,844.6 1,796.5 1,646.0Construcción 971.7 1,000.5 989.7 943.8 906.6 915.8 853.1 760.1 702.3 640.3Empresas privadas 554.1 621.4 622.4 594.3 545.2 537.7 476.9 419.1 400.4 319.2Empresas públicas 223.0 194.7 222.5 187.1 197.1 230.3 231.9 213.2 203.7 198.3Gobierno 194.6 184.4 144.8 162.5 164.3 147.8 144.3 127.7 98.1 122.9Gobierno central <strong>de</strong>l E.L.A. (1) 146.8 132.1 93.0 118.1 120.8 99.9 89.0 75.0 48.0 59.3Municipios 47.8 52.3 51.8 44.4 43.5 47.9 55.3 52.8 50.1 63.6Maquinaria y equipo 920.7 921.5 914.8 883.4 917.8 1,025.0 1,005.7 1,084.6 1,094.2 1,005.7Empresas privadas 875.5 878.8 879.5 848.4 869.0 970.4 960.8 1,054.4 1,055.2 971.8Empresas públicas 15.2 17.4 9.6 11.2 10.5 12.9 16.9 11.0 15.8 14.3Gobierno 30.0 25.3 25.7 23.8 38.3 41.7 28.1 19.2 23.3 19.6Gobierno central <strong>de</strong>l E.L.A. (1) 24.8 20.0 20.8 18.3 32.4 35.4 21.3 11.8 15.4 11.3Municipios 5.1 5.3 4.9 5.5 5.9 6.3 6.7 7.4 7.8 8.3Ventas netas al resto <strong>de</strong>l mundo (5,106.4) (5,044.5) (5,112.4) (5,292.0) (5,500.4) (5,834.2) (6,012.3) (6,142.0) (6,348.7) (6,225.3)
Ventas al resto <strong>de</strong>l mundo 5,257.0 5,620.4 6,617.6 6,450.1 7,112.0 7,388.4 7,646.0 7,846.7 7,419.6 7,476.3Gobierno fe<strong>de</strong>ral 242.3 258.6 263.1 273.4 274.7 264.0 289.1 282.8 241.0 263.4Otros no resi<strong>de</strong>ntes 5,014.7 5,361.8 6,354.5 6,176.6 6,837.3 7,124.4 7,356.8 7,563.9 7,178.6 7,212.9Compras al resto <strong>de</strong>l mundo 10,363.4 10,664.9 11,730.0 11,742.1 12,612.5 13,222.6 13,658.2 13,988.7 13,768.3 13,701.6Gobierno fe<strong>de</strong>ral 63.6 61.3 60.7 58.8 57.9 68.4 60.1 73.5 62.8 61.4Otros no resi<strong>de</strong>ntes 10,299.8 10,603.7 11,669.3 11,683.3 12,554.6 13,154.2 13,598.1 13,915.2 13,705.5 13,640.1r- Cifras revisadas. r- Revised figures.p- Cifras preliminares. p- Preliminary figures.( ) Cifras negativas. ( ) Negative figures.(1) Incluye las agencias, la Universidad <strong>de</strong> Puerto Rico, (1) Inclu<strong>de</strong>s agencies, the University of Puerto Rico,la Corporación <strong>de</strong>l Fondo <strong>de</strong>l Seguro <strong>de</strong>l Estadothe State Insurance Fund Corporation,y la Autoridad <strong>de</strong> Carreteras y Transportación. and the Highway and Transportation Authority.Fuente: Junta <strong>de</strong> Planificación, Programa <strong>de</strong> Planificación Económica y Social,Source: Puerto Rico Planning Board, Program of EconoSubprograma <strong>de</strong> Análisis Económico. Subprogram of Economic Analysis.
GROSS NATIONAL PRODUCTPersonal consumption expendituresDurable goodsNondurable goodsServicesGovernment consumption expenditureCommonwealth central government (1)MunicipiosGross domestic investment, totalChange in inventoriesGross fixed domesticinvestmentConstructionPrivate enterprisesPublic enterprisesGovernmentCommonwealth central government (1)MunicipiosMachinery and equipmentPrivate enterprisesPublic enterprisesGovernmentCommonwealth central government (1)MunicipiosNet sales to the rest of the world
Sales to the rest of the worldFe<strong>de</strong>ral governmentOther nonresi<strong>de</strong>ntsPurchases from the rest of the worldFe<strong>de</strong>ral governmentOther nonresi<strong>de</strong>ntsomic and Social Planning,