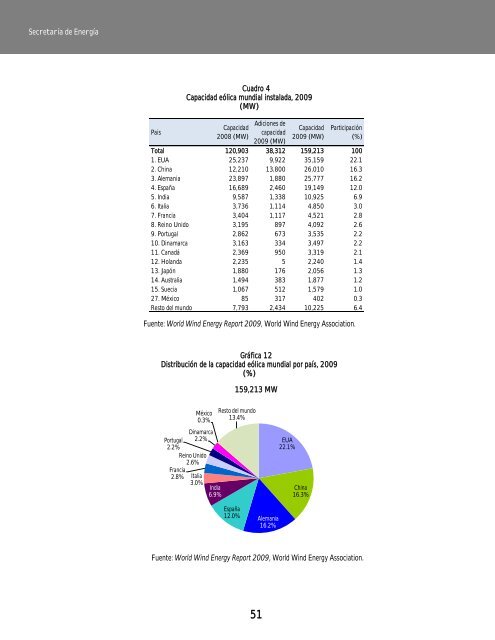
<strong>Prospectiva</strong> <strong><strong>de</strong>l</strong> <strong>sector</strong> eléctrico <strong>2010</strong>-<strong>2025</strong>Gráfica 11Evolución histórica <strong>de</strong> la capacidad eólica mundial, 1996-2009Tasa media <strong>de</strong>crecimiento anual1999-200927.9%120,903159,21347,62039,4316,100 7,600 10,20013,60017,40023,90031,10059,09174,22393,9271996 1997 1998 1999 2000 2001 2002 2003 2004 2005 2006 2007 2008 2009Fuente: Global Wind 2009 Report, Global Wind Energy Council (GWEC) y World Wind Energy Report 2009, World Wind EnergyAssociation.Al cierre <strong>de</strong> 2009 se tenían instalados 159,213 MW <strong>de</strong> capacidad eólica alre<strong>de</strong>dor <strong><strong>de</strong>l</strong> mundo, <strong>de</strong> los cuales <strong>de</strong>stacaen primer lugar EUA con 35,159 MW (22.1%), China con 26,010 MW (16.3%), Alemania con 25,777 MW(16.2%), luego España con 19,149 MW (12.0%), India 10,925 MW (6.9%), Italia con 4,850 MW (3.0%),entre otros. México ocupa la posición 27 con 402 MW (0.3%) (véase cuadro 4 y gráfica 12).50
Secretaría <strong>de</strong> EnergíaPaisCuadro 4Capacidad eólica mundial instalada, 2009(MW)Capacidad2008 (MW)Adiciones <strong>de</strong>capacidad2009 (MW)Capacidad2009 (MW)Participación(%)Total 120,903 38,312 159,213 1001. EUA 25,237 9,922 35,159 22.12. China 12,210 13,800 26,010 16.33. Alemania 23,897 1,880 25,777 16.24. España 16,689 2,460 19,149 12.05. India 9,587 1,338 10,925 6.96. Italia 3,736 1,114 4,850 3.07. Francia 3,404 1,117 4,521 2.88. Reino Unido 3,195 897 4,092 2.69. Portugal 2,862 673 3,535 2.210. Dinamarca 3,163 334 3,497 2.211. Canadá 2,369 950 3,319 2.112. Holanda 2,235 5 2,240 1.413. Japón 1,880 176 2,056 1.314. Australia 1,494 383 1,877 1.215. Suecia 1,067 512 1,579 1.027. México 85 317 402 0.3Resto <strong><strong>de</strong>l</strong> mundo 7,793 2,434 10,225 6.4Fuente: World Wind Energy Report 2009, World Wind Energy Association.Gráfica 12Distribución <strong>de</strong> la capacidad eólica mundial por país, 2009(%)159,213 MWFrancia2.8%México0.3%DinamarcaPortugal 2.2%2.2%Reino Unido2.6%Italia3.0%India6.9%Resto <strong><strong>de</strong>l</strong> mundo13.4%España12.0%Alemania16.2%EUA22.1%China16.3%Fuente: World Wind Energy Report 2009, World Wind Energy Association.51
- Page 2 and 3: 2Prospectiva del sector eléctrico
- Page 4 and 5: Prospectiva del sector eléctrico 2
- Page 6 and 7: Prospectiva del sector eléctrico 2
- Page 8 and 9: 8Prospectiva del sector eléctrico
- Page 10: Prospectiva del sector eléctrico 2
- Page 14 and 15: Prospectiva del sector eléctrico 2
- Page 16 and 17: Prospectiva del sector eléctrico 2
- Page 18 and 19: 18Prospectiva del sector eléctrico
- Page 20 and 21: Prospectiva del sector eléctrico 2
- Page 22 and 23: Prospectiva del sector eléctrico 2
- Page 24 and 25: %Prospectiva del sector eléctrico
- Page 26 and 27: TWhProspectiva del sector eléctric
- Page 28 and 29: Prospectiva del sector eléctrico 2
- Page 30 and 31: Estados UnidosMéxicoCanadáAlemani
- Page 32 and 33: Prospectiva del sector eléctrico 2
- Page 34 and 35: Prospectiva del sector eléctrico 2
- Page 36 and 37: Prospectiva del sector eléctrico 2
- Page 38 and 39: Prospectiva del sector eléctrico 2
- Page 40 and 41: TerawattshoraProspectiva del sector
- Page 42 and 43: Prospectiva del sector eléctrico 2
- Page 45 and 46: Secretaría de EnergíaEn la actual
- Page 47 and 48: Secretaría de Energía3Desde media
- Page 49: Secretaría de Energía1.6.5 Energ
- Page 53 and 54: ChinaEUAEspaña1,8801,3381,117 1,11
- Page 55 and 56: Secretaría de EnergíaCuadro 5Capa
- Page 57 and 58: Secretaría de Energíapuso en oper
- Page 59 and 60: Secretaría de EnergíaCAPÍTULO DO
- Page 61 and 62: Secretaría de Energía2.2 Ejes Rec
- Page 63 and 64: Secretaría de EnergíaFigura 1Moda
- Page 65 and 66: Secretaría de EnergíaOtorgar y re
- Page 67 and 68: Secretaría de EnergíaConvenio de
- Page 69 and 70: Secretaría de Energíasuministrado
- Page 71 and 72: Secretaría de Energíaeconómica d
- Page 73 and 74: Secretaría de EnergíaGráfica 19S
- Page 75 and 76: Secretaría de EnergíaPermisosModa
- Page 77 and 78: Secretaría de Energíaimportancia
- Page 79 and 80: Secretaría de EnergíaCuadro 7Perm
- Page 81 and 82: Secretaría de Energíala situació
- Page 83 and 84: Secretaría de EnergíaCAPÍTULO TR
- Page 85 and 86: Secretaría de Energíaintensivo de
- Page 87 and 88: Secretaría de EnergíaEl comportam
- Page 89 and 90: Secretaría de EnergíaMapa 4Estruc
- Page 91 and 92: Secretaría de Energía3.1.2.3 Cent
- Page 93 and 94: Secretaría de Energía3.2 Comporta
- Page 95 and 96: Secretaría de EnergíaCuadro 15SEN
- Page 97 and 98: Secretaría de EnergíaAgrícola: 9
- Page 99 and 100: Secretaría de Energía3.4 Intercon
- Page 101 and 102:
Secretaría de EnergíaCuadro 16Com
- Page 103 and 104:
Secretaría de EnergíaCentral. En
- Page 105 and 106:
Secretaría de EnergíaGráfica 34D
- Page 107 and 108:
Secretaría de EnergíaCuadro 19Evo
- Page 109 and 110:
Secretaría de Energía3.5.3.1 Gene
- Page 111 and 112:
Secretaría de EnergíaGráfica 37P
- Page 113 and 114:
1,3351,7356,4013,4404,6051,4354,815
- Page 115 and 116:
Secretaría de EnergíaLa energía
- Page 117 and 118:
Secretaría de Energía3.8 Balance
- Page 119 and 120:
Secretaría de Energía3.9.1.2 Áre
- Page 121 and 122:
Secretaría de Energía200943800442
- Page 123 and 124:
Secretaría de EnergíaCAPÍTULO CU
- Page 125 and 126:
TWhSecretaría de EnergíaGráfica
- Page 127 and 128:
Variación anual (%)Secretaría de
- Page 129 and 130:
Secretaría de EnergíaCuadro 24Aho
- Page 131 and 132:
TWhSecretaría de EnergíaGráfica
- Page 133 and 134:
TWhSecretaría de EnergíaGráfica
- Page 135 and 136:
Secretaría de Energíaperiodo. En
- Page 137 and 138:
Secretaría de EnergíaCuadro 29Cre
- Page 139 and 140:
MWSecretaría de EnergíaGráfica 5
- Page 141 and 142:
Secretaría de EnergíaEl programa
- Page 143 and 144:
Secretaría de EnergíaEn los estud
- Page 145 and 146:
Secretaría de EnergíaGeneración
- Page 147 and 148:
Secretaría de EnergíaCuadro 35Pro
- Page 149 and 150:
Secretaría de EnergíaLa distribuc
- Page 151 and 152:
Secretaría de EnergíaHasta finale
- Page 153 and 154:
Secretaría de EnergíaCuadro 37Req
- Page 155 and 156:
Secretaría de EnergíaMapa 10Reque
- Page 157 and 158:
Secretaría de Energía(960 MW) y;
- Page 159 and 160:
Secretaría de Energía4.7.3.4 Evol
- Page 161 and 162:
Secretaría de EnergíaNoroesteSe e
- Page 163 and 164:
Secretaría de EnergíaGráfica 55G
- Page 165 and 166:
Secretaría de EnergíaLos resultad
- Page 167 and 168:
Secretaría de EnergíaSe estima qu
- Page 169 and 170:
Secretaría de EnergíaFigura 2Esqu
- Page 171 and 172:
Secretaría de EnergíaCuadro 45Evo
- Page 173 and 174:
Secretaría de EnergíaCalidad.- Po
- Page 175 and 176:
Secretaría de EnergíaCuadro 46SEN
- Page 177 and 178:
Secretaría de EnergíaCuadro 48SEN
- Page 179 and 180:
Secretaría de EnergíaCuadro 49SEN
- Page 181 and 182:
Secretaría de Energíaprincipal ob
- Page 183 and 184:
Secretaría de Energíainversión a
- Page 185 and 186:
Secretaría de EnergíaLas principa
- Page 187 and 188:
Secretaría de EnergíaPor otra par
- Page 189 and 190:
Secretaría de EnergíaANEXO UNOEsc
- Page 191 and 192:
Secretaría de EnergíaEstadística
- Page 193 and 194:
Secretaría de EnergíaANEXO DOSMod
- Page 195 and 196:
Secretaría de EnergíaFBKF = Forma
- Page 197 and 198:
Secretaría de EnergíaANEXO TRESTa
- Page 199 and 200:
Secretaría de EnergíaTabla 2SEN:
- Page 201 and 202:
IndustrialAgrícola 5Servicios púb
- Page 203 and 204:
Secretaría de EnergíaTabla 5Infor
- Page 205 and 206:
Secretaría de EnergíaTabla 6Evolu
- Page 207 and 208:
Secretaría de EnergíaANEXO CUATRO
- Page 209 and 210:
Secretaría de EnergíaANEXO CINCOG
- Page 211 and 212:
Secretaría de EnergíaConsumoCurva
- Page 213 and 214:
Secretaría de EnergíaFactor de di
- Page 215 and 216:
Secretaría de EnergíaMargen de re
- Page 217 and 218:
Secretaría de EnergíaANEXO SEIS1A
- Page 219 and 220:
Secretaría de Energíakm-ckVkWkWhL
- Page 221 and 222:
Secretaría de EnergíaConsulta bas
- Page 223 and 224:
Secretaría de EnergíaDirecciones
- Page 225 and 226:
Secretaría de EnergíaNotas aclara
- Page 227:
Secretaría de EnergíaReferencias