Informe anual (pdf) - Cajastur
Informe anual (pdf) - Cajastur
Informe anual (pdf) - Cajastur

Create successful ePaper yourself
Turn your PDF publications into a flip-book with our unique Google optimized e-Paper software.
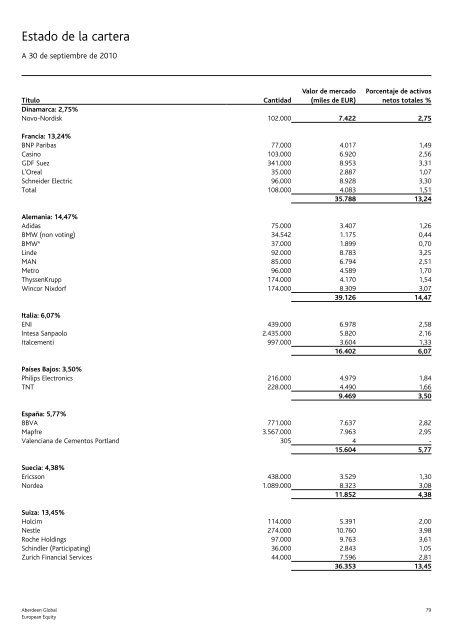
Estado de la carteraA 30 de septiembre de 2010Valor de mercado(miles de EUR)Porcentaje de activosnetos totales %TítuloCantidadDinamarca: 2,75%Novo-Nordisk 102.000 7.422 2,75Francia: 13,24%BNP Paribas 77.000 4.017 1,49Casino 103.000 6.920 2,56GDF Suez 341.000 8.953 3,31L'Oreal 35.000 2.887 1,07Schneider Electric 96.000 8.928 3,30Total 108.000 4.083 1,5135.788 13,24Alemania: 14,47%Adidas 75.000 3.407 1,26BMW (non voting) 34.542 1.175 0,44BMW A 37.000 1.899 0,70Linde 92.000 8.783 3,25MAN 85.000 6.794 2,51Metro 96.000 4.589 1,70ThyssenKrupp 174.000 4.170 1,54Wincor Nixdorf 174.000 8.309 3,0739.126 14,47Italia: 6,07%ENI 439.000 6.978 2,58Intesa Sanpaolo 2.435.000 5.820 2,16Italcementi 997.000 3.604 1,3316.402 6,07Países Bajos: 3,50%Philips Electronics 216.000 4.979 1,84TNT 228.000 4.490 1,669.469 3,50España: 5,77%BBVA 771.000 7.637 2,82Mapfre 3.567.000 7.963 2,95Valenciana de Cementos Portland 305 4 -15.604 5,77Suecia: 4,38%Ericsson 438.000 3.529 1,30Nordea 1.089.000 8.323 3,0811.852 4,38Suiza: 13,45%Holcim 114.000 5.391 2,00Nestle 274.000 10.760 3,98Roche Holdings 97.000 9.763 3,61Schindler (Participating) 36.000 2.843 1,05Zurich Financial Services 44.000 7.596 2,8136.353 13,45Aberdeen Global 79European Equity