DWS Deutschland - Cajastur
DWS Deutschland - Cajastur
DWS Deutschland - Cajastur

Create successful ePaper yourself
Turn your PDF publications into a flip-book with our unique Google optimized e-Paper software.
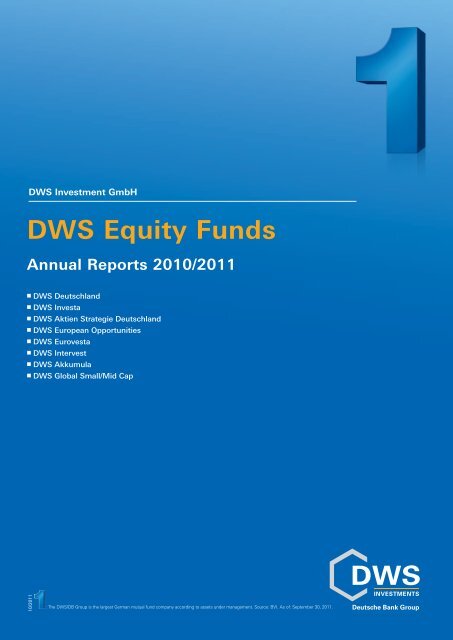
<strong>DWS</strong> Investment GmbH<strong>DWS</strong> Equity FundsAnnual Reports 2010/2011n <strong>DWS</strong> <strong>Deutschland</strong>n <strong>DWS</strong> Investan <strong>DWS</strong> Aktien Strategie <strong>Deutschland</strong>n <strong>DWS</strong> European Opportunitiesn <strong>DWS</strong> Eurovestan <strong>DWS</strong> Intervestn <strong>DWS</strong> Akkumulan <strong>DWS</strong> Global Small/Mid Cap10/2011: The <strong>DWS</strong>/DB Group is the largest German mutual fund company according to assets under management. Source: BVI. As of: September 30, 2011.
<strong>DWS</strong> <strong>Deutschland</strong><strong>DWS</strong> Investa<strong>DWS</strong> Aktien Strategie <strong>Deutschland</strong><strong>DWS</strong> European Opportunities<strong>DWS</strong> Eurovesta<strong>DWS</strong> Intervest<strong>DWS</strong> Akkumula<strong>DWS</strong> Global Small/Mid Cap
ContentsAnnual reports 2010/2011for the period from October 1, 2010, through September 30, 2011(in accordance with article 44 (1) of the German Investment Act (InvG))TOP 50 Europa 00Equity markets4General information620102011Annual reports<strong>DWS</strong> <strong>Deutschland</strong> 8<strong>DWS</strong> Investa 18<strong>DWS</strong> Aktien Strategie <strong>Deutschland</strong> 28<strong>DWS</strong> European Opportunities 38<strong>DWS</strong> Eurovesta 48<strong>DWS</strong> Intervest 58<strong>DWS</strong> Akkumula 70<strong>DWS</strong> Global Small/Mid Cap 821
Equity markets
Equity markets in the fiscal yearthrough September 30, 2011Equity markets affected bythe debt crisisIn the period from the beginning ofOc tober 1, 2010, to July 31, 2011, pricesin the international equity markets initiallyrose significantly because of the surprisinglygood performance of the globaleconomy. However, in August/September2011, the euro area debt crisis grewmore acute and prices on the exchangesplummeted. The expectation of solidgrowth gave way to fears of recession.This, in turn, was viewed as necessary inorder to reduce the high levels of debt.The corporate reporting season for thesecond quarter of 2011 was unable toform a counterweight to the negativeinfluences. In addition, the ability of thecentral banks to stimulate the economywas sharply limited. In many cases, forexample, key interest rates were nearzero, leaving little room for further lowering.Hopes for an improved climate werebased primarily on the austerity efforts ofthe heavily-indebted nations. Theseefforts were decisive for the transferpayments from the rescue package puttogether by the European Union and theInternational Monetary Fund. The sustainedstrong economic growth of countrieslike China provided support. Againstthis backdrop, the MSCI World Indexrecorded a loss of 3.8% in U.S. dollarterms over the 12-month period(-3.2% in euro).The U.S. equity market initially recordeda significant gain the first half of the fiscalyear. The reason for this was the positivedevelopment of corporate and economicdata. As the period went on, however,this data weakened noticeably, leading torenewed fears of recession. The ongoingdiscussions about sovereign debt in theWestern industrial countries also contributedto the darkening of the marketenvironment. Although in the U.S. anagreement was reached on raising thedebt ceiling, the increasing uncertaintyprompted one of the leading rating agenciesto downgrade the country’s creditrating. The deterioration of the debt crisisin Europe also led to fears of a downturnin the global economy. In addition, thecontinued tense situation on the U.S. realestate and labor market had a dampeninginfluence on prices of U.S. shares. TheU.S. equity market – as measured by theS&P 500 index – recorded a gain of 1.1%in U.S. dollar terms (+1.8% in euro) forthe full reporting year.Europe presented a divided picture. InGermany and in the Northern Europeancountries with relatively sound managementof their public budgets, the positiveeconomic environment initially dominatedthe atmosphere on the exchanges.The strong growth in the emerging industrialcountries and the revival of domesticdemand provided the impetus. Manycompanies were buoyed here by theirstrong international competitiveness.However, even these markets were unableto avoid the effects of the threat ofthe escalation of the debt crisis at theend of the reporting period. The DAX, forexample, was down by 11.7% overallin euro terms. In contrast, the exchangesin the highly-indebted countries ofSouthern Europe, with their concernsabout growth, recorded only a modest,comparatively short upturn – if any atall – until prices collapsed at the endStrong market movementsover a five-year period140Germany12010080U.S.6040International equity marketsin the 2010/2011 fiscal yearPerformance in %DAXSTOXX Europe 50S&P 500TOPIXEquity indices:STOXXEurope 50S&P 500TOPIXDAXMSCI WorldMSCI EmergingMarketsIn local currencyin euroJapanEurope9/06* 9/07 9/08 9/09 9/10 9/11Data on euro basis* September 29, 2006 = 100“STOXX” is a registeredtrademark of STOXX Limited;“DAX” is a registeredtrademark ofDeutsche Börse AG-11.7-10.01.11.8-6.12.7-3.8(in U.S. dollars)-3.2-15.9(in U.S. dollars)-15.4-20 -15 -10 -5 0 5 10Equity indicesGermany: DAX – Europe: STOXX Europe 50 –U.S.: S&P 500 – Japan: TOPIX – worldwide: MSCI World –Emerging markets: MSCI Emerging Marketsof July/beginning of August 2011. As aresult, price declines – even by historicalcomparison – were extreme for thereporting period as a whole. For example,Italian equities, as measured by theMIB 30, fell by 24.2%. This also explainedthe considerably higher 17.9%decline on the EURO STOXX 50 indexin comparison to the broader STOXXEurope 50 index, which fell 10.0%(both percentages in euro terms).4
Prices on most Eastern Europeanexchanges were also affected by theeuro area debt crisis in the year throughthe end of September 2011. The aboveaverageeconomic growth in thesecountries and their comparatively lowlevel of government debt was of littlehelp in this regard. Shares in Poland– as measured by the WIG – fell by24.0% and in the Czech Republic by17.8% (Prague PX 50, both percentagesin euro terms).The natural disaster of March 2011 inFukushima was the main influence onthe Japanese equity market. Fears of amajor nuclear crisis as a result of theaccident at the Fukushima nuclear powerplant and the noticeable cooling of theJapanese economy from the loss of productioncapacity led to a major pricecorrection. The situation stabilized laterin the period, leading to a temporary re -covery on the exchanges. However, concernsabout the weakening of the globaleconomy against the backdrop of debtproblems in the euro peripheral countriesthen dampened the performance. Leadingindicators in the U.S. and Europewere also gloomier. As measured by theTOPIX index, Japanese equities recordeda loss of 6.1% in local currency duringthe reporting period (+2.7% in euroterms). In view of rising risk aversionresulting from the debt problems, investorspreferred the yen, which gavethe currency a strong boost.The economies in the EmergingMarkets remained relatively robust,although they could not avoid the impactof the global trends. The equity marketsof some emerging-market countriesinitially turned in impressive performancesthanks to the low debt androbust economic outlooks of these countries.However, as the period went on,they suffered from the rising risk aversionof international investors. Althoughthese markets had no direct connectionwith the structural problems in the industrialcountries, economies where capitalflows play a major role were hit particularlyhard. Against this backdrop, theMSCI Emerging Markets recorded a lossof 15.4% in euro terms. The Hang SengChina Enterprises index fell 28.1% inlocal currency (-27.9% in euro). Increasinginflation rates and real estate pricesgave rise to doubts about the sustaina -bility of China’s economic growth. Thecentral bank reacted by increasing keyinterest rates to curb inflation and tostabilize the economic outlook in themedium to long term. Prices alsodropped sharply in Brazil and India. TheBrazil Bovespa fell 24.6% in Brazilian real(-30.0% in euro). The Bombay SE 30Share Sensitive fell 18.0% in Indianrupee terms or 25.1% in euro terms. Incontrast, the Russian RTS fell just 6.4%in Russian rouble terms and 10.5% ineuro terms, and was thus less influencedby the negative trend on the globalexchanges. The Russian commoditiessector presented good numbers and themarket as a whole remained one of thecheapest in the world.Change in oil pricesince the end of 2008USD/Barrel1301109070503012/08 9/09 3/10 9/10 3/11 9/11Oil price (WTI)Source: ThomsonFinancial DatastreamStrong fluctuationsin gold and crude oilWith the financial crisis in the euro areadeteriorating, the price for a fine ounce ofgold rose very sharply, from aroundUSD 1 300 at the beginning of the reportingperiod to more than USD 1 900 at itspeak. However, the price had fallen toabout USD 1 620 on the reporting date.This was due in part to the fact that theCOMEX commodity exchange increasedthe cash collateral required for futurestransactions several times because ofthe high volatility. This made gold futurescontracts less attractive. Nevertheless,gold ended the twelve month periodthrough the end of September 2011 withan overall gain of 24.6%. The price ofcrude oil was virtually unchanged overallfor the reporting period at around USD 80per barrel (WTI), but it was subject tohigh volatility between the reportingdates. After initially rising significantly toaround USD 115 on the strength of theupturn in the global economy, the pricethen dropped noticeably here, too. Thiswas also the result of debt problems inthe euro area, which led to fears of recession.5
General informationPerformanceThe investment return, or performance,of a mutual fund investment is meas -ured by the change in value of thefund’s units. The net asset values perunit (= redemption prices) with the additionof intervening distributions, whichare, for example, reinvested free ofcharge within the scope of investmentaccounts at <strong>DWS</strong>, are used as the basisfor calculating the value; in the case ofdomestic reinvesting funds, the domesticinvestment income tax – followingany deduction of foreign withholdingtax – plus solidarity surcharge chargedby the fund are added. Performance iscalculated in accordance with the “BVImethod”. Past performance is not aguide to future results. The correspond-ing benchmarks – if available – arealso presented in the reports. Allfinancial data in this publication isas of September 30, 2011 (unlessotherwise specified).Sales prospectusesThe sole binding basis for a purchaseare the current version of the salesprospectus including Terms of Contractand the “Key Investor Information”document, which are available from<strong>DWS</strong>, any branch of Deutsche Bank AG,as well as from other paying agents.All-in feeThe all-in fee does not include the followingexpenses:a) any costs that may arise in connectionwith the acquisition and disposalof assets;b) any taxes that may arise in connectionwith administrative and custodialcosts;c) the costs of asserting and enforcingthe legal claims of the investmentfund.The details of the fee structure are setforth in the current sales prospectus.Issue and redemption pricesEach exchange trading day on theInternet: www.dws.de6
2010The formatused for complete datesin securities descriptions in the investmentportfolio is “day/month/year”.Annual report<strong>DWS</strong> <strong>Deutschland</strong>2011
<strong>DWS</strong> <strong>Deutschland</strong>Investment objective andperformance in the reporting period<strong>DWS</strong> <strong>Deutschland</strong> focuses on Germanblue chip stocks, supplemented byselected equities of small and mediumsizedenterprises. It invests primarily incyclical, economically-sensitive stocks,which dominate the German equitymarket. In the first ten months of thefiscal year – through July 2011 – thesestocks performed very well thanks tothe positive global economic climate<strong>DWS</strong> DEUTSCHLANDFive-year performance17516014513011510085709/06* 9/07 9/08 9/09 9/109/11<strong>DWS</strong> <strong>Deutschland</strong>* 9/2006 = 100Data on euro basis“BVI method” performance, i.e., excluding the initial sales charge. Past performance is no guide to future results.As of: September 30, 2011and the pronounced export strengths ofGerman companies. Only toward theend of the reporting period did thesestocks suffer heavy price declines.This was the result of global fears ofslowing economic growth as euro areadebt problems intensified. As a result,in the fiscal year through the end ofSeptember 2011, the fund recordeda depreciation of 12.6% per unit(BVI method). Its benchmark, theCDAX, declined by 10.7% in thesame period.Investment policy<strong>DWS</strong> DEUTSCHLAND vs. benchmarkPerformance at a glancein %181260-6-12-18-10.7-12.61 year+10.5-5.13 years+11.5-9.95 years<strong>DWS</strong> <strong>Deutschland</strong>Benchmark CDAXData on euro basis“BVI method” performance, i.e., excluding theinitial sales charge. Past performance is no guideto future results.As of: September 30, 2011in the reporting periodIn the opinion of the fund management,there was a substantial investment riskin the solar stocks in the portfolio. Thereduction in feed-in compensation forsolar energy and intensifying competitionwith Asian providers put pressureon many companies’ business models.For this reason, positions in SolarWorldand SMA Solar Technology wereclosed. The management also saw amajor investment risk in TUI. Difficultiesin the shipping business and the touroperator’s high debt prompted it to sellall holdings of the stock.Even in the phase of pronounced weakness,the fund maintained its strategyof preferring cyclical companies andcompanies with strong exports,because only a slight, temporary slowdownin the economy was expected.The chemical, automotive, engineeringand plant construction sectors continuedto be the heavyweights in the portfolio.BASF was among the largest singlepositions; the company achieved highmargins in its chemicals division. VW8
was also overweighted; in spite of thepremium brand Audi, the equities werevalued like that of a mass pro ducer.Over the entire reporting year, saleswere very good in emerging-marketcountries and remained satisfactory inNorth America and Europe. <strong>DWS</strong><strong>Deutschland</strong> significantly increased itsposition in SAP. The positive growth inlicensing by the provider of enterprisesoftware supported this decision.Under the new management, expectationshave increased that the companywill return to its previous growth path.Price gains were realized in DeutscheTelekom towards the end of the reportingperiod.In the area of small and mid caps – aswith blue chips – investors also avoidedcyclical stocks during the correction inthe equity markets. Nevertheless,because of the assumption of a temporaryeconomic downturn, few saleswere made here, although this segmentalso contributed to the underperformance.<strong>DWS</strong> DEUTSCHLAND: Summary statement of assetsInvestment focus by sectorEquities 97.4% (September 30, 2011) / Equities 89.2% (September 30, 2010)Materials13.222.7Consumer Discretionary14.720.6Industrials18.421.0Information Technology12.110.3Financials11.210.1Health Care8.48.9Utilities3.66.0Telecommunication Services0.44.4Consumer Staples0.00.4Not classified by MSCI system0.00.2Cash and other assets2.610.80 5 10 15 20 25In % of the fund’s net assets in bondsas of September 30, 2011In % of the fund’s net assets in bondsas of September 30, 2010Security code: 849 096ISIN: DE0008490962As of: September 30, 2011Main sources of capital gains/lossesThe main sources of capital gains/losses were losses realized on the saleof equities.9
Annual report<strong>DWS</strong> <strong>Deutschland</strong>Investment portfolio – September 30, 2011Count/ Quantity/ Purchases/ Sales/ Market price Total market % ofDescription currency principal additions disposals value in net assets(– / ’000) amount in the reporting period EURSecurities traded on an exchange 2 167 803 246.36 97.02Equitiesadidas Reg. (DE000A1EWWW0) . . . . . . . . . . . . . . . . . . . Count 1 000 000 1 000 000 EUR 44.9500 44 950 000.00 2.01Aixtron Reg. (DE000A0WMPJ6) 3) . . . . . . . . . . . . . . . . . . Count 750 000 1 300 000 1 250 000 EUR 11.0950 8 321 250.00 0.37Allianz SE (DE0008404005) 3) . . . . . . . . . . . . . . . . . . . . . . Count 1 500 000 1 160 000 500 000 EUR 69.7100 104 565 000.00 4.68Amadeus Fire (DE0005093108) . . . . . . . . . . . . . . . . . . . . Count 245 950 245 950 EUR 25.6900 6 318 455.50 0.28Aurubis AG (DE0006766504) . . . . . . . . . . . . . . . . . . . . . . Count 520 000 520 281 281 EUR 38.6050 20 074 600.00 0.90Axel Springer Vink. Reg. (DE0005501357) . . . . . . . . . . . . Count 300 000 200 552 EUR 25.7850 7 735 500.00 0.35BASF Reg. (DE000BASF111) . . . . . . . . . . . . . . . . . . . . . . Count 4 500 000 2 500 000 EUR 45.9950 206 977 500.00 9.26Bauer (DE0005168108) . . . . . . . . . . . . . . . . . . . . . . . . . . . Count 500 000 261 500 EUR 17.3950 8 697 500.00 0.39Bayer (DE000BAY0017) . . . . . . . . . . . . . . . . . . . . . . . . . . Count 2 980 000 1 500 000 20 000 EUR 41.5050 123 684 900.00 5.54BB Biotech Reg. (CH0038389992) 3) . . . . . . . . . . . . . . . . Count 190 000 3 409 EUR 43.8550 8 332 450.00 0.37Bechtle (DE0005158703) . . . . . . . . . . . . . . . . . . . . . . . . . Count 790 000 490 000 EUR 25.1800 19 892 200.00 0.89Bilfinger Berger (DE0005909006) 3) . . . . . . . . . . . . . . . . . Count 450 000 300 000 EUR 55.4900 24 970 500.00 1.12BMW Ord. (DE0005190003) 3) . . . . . . . . . . . . . . . . . . . . . Count 750 000 500 000 EUR 49.0000 36 750 000.00 1.64BMW Pref. (DE0005190037) . . . . . . . . . . . . . . . . . . . . . . Count 750 000 750 000 EUR 34.3100 25 732 500.00 1.15Brenntag (DE000A1DAHH0) . . . . . . . . . . . . . . . . . . . . . . . Count 230 000 148 219 5 840 EUR 65.0000 14 950 000.00 0.67Centrosolar (DE0005148506) . . . . . . . . . . . . . . . . . . . . . . Count 1 450 000 EUR 1.8410 2 669 450.00 0.12CENTROTEC Sustainable (DE0005407506) . . . . . . . . . . . Count 918 800 447 600 EUR 13.6250 12 518 650.00 0.56Commerzbank (DE0008032004) . . . . . . . . . . . . . . . . . . . . Count 5 000 000 15 000 000 10 000 000 EUR 1.9420 9 710 000.00 0.43CompuGROUP Holding Ord. (DE0005437305) 3) . . . . . . . Count 2 700 000 615 000 18 191 EUR 8.3250 22 477 500.00 1.01Continental (DE0005439004) . . . . . . . . . . . . . . . . . . . . . . Count 1 000 000 691 031 1 205 EUR 43.7800 43 780 000.00 1.96Daimler Reg. (DE0007100000) 3) . . . . . . . . . . . . . . . . . . . Count 3 250 000 2 056 446 51 446 EUR 33.3450 108 371 250.00 4.85Deutsche Bank Reg. (DE0005140008) . . . . . . . . . . . . . . . Count 3 250 000 3 299 550 750 000 EUR 26.2200 85 215 000.00 3.81Deutsche Boerse New (applied for tender)(DE000A1KRND6) . . . . . . . . . . . . . . . . . . . . . . . . . . . . . . . Count 800 000 800 000 EUR 37.3900 29 912 000.00 1.34Deutsche Lufthansa Vink. Reg. (DE0008232125) . . . . . . . Count 2 000 000 1 784 400 EUR 9.7410 19 482 000.00 0.87Deutsche Post Reg. (DE0005552004) 3) . . . . . . . . . . . . . Count 3 029 700 3 829 700 800 000 EUR 9.6000 29 085 120.00 1.30Drägerwerk (DE0005550602) . . . . . . . . . . . . . . . . . . . . . . Count 400 000 168 200 EUR 57.9000 23 160 000.00 1.04E.ON Reg. (DE000ENAG999) 3) . . . . . . . . . . . . . . . . . . . . Count 4 000 000 1 900 000 600 000 EUR 16.4250 65 700 000.00 2.94ElringKlinger Reg. (DE0007856023) 3) . . . . . . . . . . . . . . . Count 1 075 000 165 135 9 450 EUR 17.5600 18 877 000.00 0.84EUROKAI Pref. (DE0005706535) . . . . . . . . . . . . . . . . . . . Count 400 000 732 EUR 19.0000 7 600 000.00 0.34Evotec (DE0005664809) . . . . . . . . . . . . . . . . . . . . . . . . . . Count 1 000 000 EUR 2.2600 2 260 000.00 0.10Fraport AG Frankfurt Airport Services Worldwide(DE0005773303) 3) . . . . . . . . . . . . . . . . . . . . . . . . . . . . . . Count 200 000 40 000 EUR 44.3600 8 872 000.00 0.40Freenet (DE000A0Z2ZZ5) . . . . . . . . . . . . . . . . . . . . . . . . . Count 1 070 000 333 000 EUR 8.7660 9 379 620.00 0.42GEA Group (DE0006602006) 3) . . . . . . . . . . . . . . . . . . . . Count 1 800 000 1 800 000 EUR 17.3700 31 266 000.00 1.40Gerry Weber International (DE0003304101) 3) . . . . . . . . . Count 1 000 000 500 000 EUR 21.5050 21 505 000.00 0.96Grammer (DE0005895403) . . . . . . . . . . . . . . . . . . . . . . . . Count 500 000 500 000 EUR 12.7000 6 350 000.00 0.28H&R WASAG (DE0007757007) . . . . . . . . . . . . . . . . . . . . . Count 646 219 446 219 EUR 15.0770 9 743 043.86 0.44HeidelbergCement (DE0006047004) . . . . . . . . . . . . . . . . Count 160 000 380 EUR 27.7100 4 433 600.00 0.20Hochtief (DE0006070006) . . . . . . . . . . . . . . . . . . . . . . . . . Count 100 000 EUR 46.2150 4 621 500.00 0.21HWA (DE000A0LR4P1) . . . . . . . . . . . . . . . . . . . . . . . . . . . Count 210 000 80 000 3 000 EUR 14.5100 3 047 100.00 0.14K+S Reg. (DE000KSAG888) . . . . . . . . . . . . . . . . . . . . . . . Count 1 500 000 1 500 000 EUR 40.1950 60 292 500.00 2.70KSB Pref. (DE0006292030) . . . . . . . . . . . . . . . . . . . . . . . . Count 86 000 EUR 384.0500 33 028 300.00 1.48Lanxess (DE0005470405) . . . . . . . . . . . . . . . . . . . . . . . . . Count 1 000 000 550 000 EUR 35.9450 35 945 000.00 1.61Linde (DE0006483001) 3) . . . . . . . . . . . . . . . . . . . . . . . . . Count 700 000 400 000 EUR 101.6000 71 120 000.00 3.18MAN Ord. (DE0005937007) . . . . . . . . . . . . . . . . . . . . . . . Count 1 350 000 1 228 000 EUR 59.2000 79 920 000.00 3.58Merck (DE0006599905) 3) . . . . . . . . . . . . . . . . . . . . . . . . Count 200 000 370 000 270 000 EUR 60.9500 12 190 000.00 0.55MTU Aero Engines Holding Reg. (DE000A0D9PT0) 3) . . . Count 1 200 000 1 200 000 EUR 47.0000 56 400 000.00 2.52Muehlbauer Holding (DE0006627201) 3) . . . . . . . . . . . . . Count 125 000 31 792 EUR 25.4500 3 181 250.00 0.14Münchener Rückversicherungs-Gesellschaft Vink. Reg.(DE0008430026) 3) . . . . . . . . . . . . . . . . . . . . . . . . . . . . . . Count 230 000 EUR 92.1700 21 199 100.00 0.95NORMA Group (DE000A1H8BV3) . . . . . . . . . . . . . . . . . . Count 470 000 470 277 277 EUR 12.2000 5 734 000.00 0.26Porsche Automobil Holding Pref. (DE000PAH0038) . . . . . Count 525 000 525 000 EUR 35.7850 18 787 125.00 0.84PUMA (DE0006969603) 3) . . . . . . . . . . . . . . . . . . . . . . . . Count 100 000 EUR 219.3000 21 930 000.00 0.98Qiagen (NL0000240000) . . . . . . . . . . . . . . . . . . . . . . . . . . Count 925 000 700 000 1 905 EUR 10.5300 9 740 250.00 0.44Rheinmetall Ord. (DE0007030009) 3) . . . . . . . . . . . . . . . . Count 500 000 EUR 35.2700 17 635 000.00 0.79RWE Ord. (DE0007037129) 3) . . . . . . . . . . . . . . . . . . . . . Count 540 000 EUR 27.6850 14 949 900.00 0.67SAP (DE0007164600) 3) . . . . . . . . . . . . . . . . . . . . . . . . . . Count 4 000 000 2 801 700 EUR 37.9650 151 860 000.00 6.80Sixt Pref. (DE0007231334) . . . . . . . . . . . . . . . . . . . . . . . . Count 1 597 402 1 040 362 EUR 12.2500 19 568 174.50 0.88Software (DE0003304002) . . . . . . . . . . . . . . . . . . . . . . . . Count 450 000 300 000 EUR 23.5850 10 613 250.00 0.47STADA Arzneimittel Vink. Reg. (DE0007251803) . . . . . . . Count 500 000 144 200 EUR 15.8750 7 937 500.00 0.36STEICO (DE000A0LR936) . . . . . . . . . . . . . . . . . . . . . . . . . Count 300 000 4 222 EUR 7.5760 2 272 800.00 0.10STO Pref. (DE0007274136) . . . . . . . . . . . . . . . . . . . . . . . . Count 123 650 81 650 3 374 EUR 108.5500 13 422 207.50 0.60Süss MicroTec Reg. (DE000A1K0235) 3) . . . . . . . . . . . . . Count 1 300 000 1 300 000 EUR 6.4140 8 338 200.00 0.37Symrise (DE000SYM9999) 3) . . . . . . . . . . . . . . . . . . . . . . Count 750 000 750 000 EUR 17.4700 13 102 500.00 0.59ThyssenKrupp AG (DE0007500001) 3) . . . . . . . . . . . . . . . Count 2 600 000 2 600 000 EUR 18.5950 48 347 000.00 2.16United Internet Reg. (DE0005089031) . . . . . . . . . . . . . . . Count 3 000 000 1 427 103 EUR 12.6800 38 040 000.00 1.70voestalpine (AT0000937503) . . . . . . . . . . . . . . . . . . . . . . . Count 1 000 000 700 000 EUR 21.7800 21 780 000.00 0.97Volkswagen Pref. (DE0007664039) . . . . . . . . . . . . . . . . . . Count 1 000 000 700 000 EUR 102.0000 102 000 000.00 4.56Vossloh (DE0007667107) . . . . . . . . . . . . . . . . . . . . . . . . . Count 300 000 171 669 EUR 73.1500 21 945 000.00 0.98Wacker Neuson SE (DE000WACK012) . . . . . . . . . . . . . . . Count 540 000 1 057 EUR 8.4000 4 536 000.00 0.2010
<strong>DWS</strong> <strong>Deutschland</strong>Count/ Quantity/ Purchases/ Sales/ Market price Total market % ofDescription currency principal additions disposals value in net assets(– / ’000) amount in the reporting period EURSecurities that are admitted or included in organized markets 8 911 000.00 0.40EquitiesDialog Semiconductor (GB0059822006) 3) . . . . . . . . . . . . Count 700 000 105 000 5 000 EUR 12.7300 8 911 000.00 0.40Total securities portfolio 2 176 714 246.36 97.42DerivativesMinus signs denote short positionsDerivatives on individual securities -37 163 070.10 -1.66Securities options(Receivables/payables)Equity optionsPut Deutsche Post 12/2011 Strike 12.50 (EURX) . . . . . . . Count -3 720 300 EUR 2.9150 -10 844 674.50 -0.49Put Deutsche Telekom 12/2011 Strike 10 (EURX) . . . . . . Count -5 000 000 EUR 1.3700 -6 850 000.00 -0.31Put SAP Stammakt. 12/2011 Strike 40 (EURX) . . . . . . . . . Count -2 000 000 EUR 3.2350 -6 470 000.00 -0.29Put Software (FLEX STR) 12/2011 Strike 33 (EURX) . . . . Count -450 000 EUR 9.1836 -4 132 605.60 -0.18Securities futuresEquity futuresSiemens Future 12/2011 (EURX) EUR . . . . . . . . . . . . . . . Count 3 300 000 -8 865 790.00 -0.40Equity index derivatives 2 545 226.25 0.11(Receivables/payables)Equity index futuresDAX Index Future 12/2011 (EURX) EUR . . . . . . . . . . . . . . Count 12 500 2 545 226.25 0.11Cash and non-securitized money market instruments 85 458 563.64 3.82Cash at bank 85 458 563.64 3.82Demand deposits at CustodianEUR deposits . . . . . . . . . . . . . . . . . . . . . . . . . . . . . . . . . . EUR 83 973 215.85 % 100 83 973 215.85 3.76Deposits in other EU/EEA currencies . . . . . . . . . . . . . . . . EUR 737 430.22 % 100 737 430.22 0.03Deposits in non-EU/EEA currenciesSwiss franc . . . . . . . . . . . . . . . . . . . . . . . . . . . . . . . . . . . . CHF 912 347.99 % 100 747 917.57 0.03Other assets 320 827.53 0.01Interest receivable . . . . . . . . . . . . . . . . . . . . . . . . . . . . . . EUR 59 680.43 % 100 59 680.43 0.00Withholding tax claims . . . . . . . . . . . . . . . . . . . . . . . . . . . EUR 138 070.89 % 100 138 070.89 0.01Other receivables . . . . . . . . . . . . . . . . . . . . . . . . . . . . . . . EUR 123 076.21 % 100 123 076.21 0.01Receivables from share certificate transactions EUR 11 413 383.19 % 100 11 413 383.19 0.51Other liabilities -2 684 865.06 -0.12Liabilities from cost item . . . . . . . . . . . . . . . . . . . . . . . . . . EUR -2 623 327.26 % 100 -2 623 327.26 -0.12Additional other liabilities . . . . . . . . . . . . . . . . . . . . . . . . . EUR -61 537.80 % 100 -61 537.80 0.00Liabilities from share certificate transactions EUR -2 118 288.29 % 100 -2 118 288.29 -0.09Net assets 2 234 486 023.52 100.00Net asset value per unit 83.90Number of units outstanding 26 631 938.651Negligible rounding errors may have arisen due to the rounding of calculated percentages.11
<strong>DWS</strong> <strong>Deutschland</strong>Composition of the reference portfolio (risk benchmark) (according to article 28 (3), of the Derivatives Regulation (DerivateV))DAX (RI)Market risk exposure (value-at-risk) (according to article 28 (2), sentences 1 and 2, of the Derivatives Regulation (DerivateV))Lowest market risk exposure . . . . . . . . . . . . . . . . . . % 7.472Highest market risk exposure . . . . . . . . . . . . . . . . . . % 20.290Average market risk exposure . . . . . . . . . . . . . . . . . % 11.785The values-at-risk were calculated for the period from October 1, 2010, through September 30, 2011, using historical simulation with a 99% confidence level, a 10-day holding period andan effective historical observation period of one year. The risk in a reference portfolio that does not contain derivatives is used as the measurement benchmark. Market risk is the risk tothe fund from an unfavorable change in market prices. The investment company determines the potential market risk by means of the qualified approach as defined by the DerivativesRegulation.In the reporting period, the average leverage effect from the use of derivatives was 0.3, whereby the total of the nominal amounts of the derivates in relation to the fund’s assets wasused for the calculation (nominal value method).Market abbreviationsFutures exchangesEURX = Eurex (Eurex Frankfurt/Main / Eurex Zürich)Exchange rates (indirect quotes)As of September 30, 2011Swiss franc . . . . . . . . . . . . . . . . . . . . . CHF 1.219851 = EUR 1Notes on the valuationThe Custodian shall determine the value with the participation of the investment company. The Custodian generally bases its valuation on external sources.If no trading prices are available, prices are determined with the aid of valuation models (derived market values) which are agreed between the Custodian and the investment companyand which are based as far as possible on market parameters. This procedure is subject to an ongoing monitoring process. The plausibility of price information from third parties is checkedthrough other pricing sources, model calculations or other suitable procedure.Investments reported in this report are not valued at derived market values.Footnotes3) These securities were completely or partly transferred under securities loans. The equivalent value of the lent securities is EUR 470 332 604.61.12
<strong>DWS</strong> <strong>Deutschland</strong>Transactions completed during the reporting period that no longer appear in the investment portfolioPurchases and sales of securities, investment fund units and promissory noteloans (Schuldscheindarlehen); market classifications are as of the reporting dateCount/Purchases/ Sales/Descriptioncurrencyadditions disposals(– / ’000)Securities traded on an exchangeEquitiesAareal Bank (DE0005408116) . . . . . . . . . . . . . . . . . . Count 354 310 354 310adidas (DE0005003404) . . . . . . . . . . . . . . . . . . . . . . Count 250 000Beiersdorf (DE0005200000) . . . . . . . . . . . . . . . . . . . Count 234 800 350 000Bijou Brigitte modische Accessoires(DE0005229504) . . . . . . . . . . . . . . . . . . . . . . . . . . . . Count 19 340CENTROTEC Sustainable (new) (DE000A1KRJ76) . . Count 98 800 98 800Deutsche Bank Right (DE000A1E8H87) . . . . . . . . . . Count 700 450Deutsche Beteiligungs AG (DE0005508105) . . . . . . Count 100 000Deutsche Börse Reg. (DE0005810055) . . . . . . . . . . Count 400 000 800 000Deutsche Telekom Reg. (DE0005557508) . . . . . . . . Count 5 000 000elexis (applied for sale) (DE000A1KRC81) . . . . . . . . Count 830 000 830 000elexis (DE0005085005) . . . . . . . . . . . . . . . . . . . . . . . Count 830 842Fresenius Medical Care (DE0005785802) . . . . . . . . Count 106 250Fresenius SE (DE0005785604) . . . . . . . . . . . . . . . . . Count 850 45 000Grontmij (NL0000853034) . . . . . . . . . . . . . . . . . . . . Count 480 000Hansen Sicherheitstechnik (DE000HAST002) . . . . . Count 216 000Highlight Communications (CH0006539198) . . . . . . Count 500 000Intercell (AT0000612601) . . . . . . . . . . . . . . . . . . . . . Count 150 000K+S (DE0007162000) . . . . . . . . . . . . . . . . . . . . . . . . Count 1 101 625 1 501 625Porsche Automobil Holding Right on Pref.(DE000A1KRRB1) . . . . . . . . . . . . . . . . . . . . . . . . . . . Count 300 000 300 000Siemens Reg. (DE0007236101) . . . . . . . . . . . . . . . . Count 2 000 000 3 500 000SMA Solar Technology (DE000A0DJ6J9) . . . . . . . . . Count 75 000SolarWorld (DE0005108401) . . . . . . . . . . . . . . . . . . Count 413 550Süss MicroTec (DE0007226706) . . . . . . . . . . . . . . . Count 1 300 000 1 300 000Tognum (applied for sale) (DE000A1KRPA7) . . . . . . Count 715 000 715 000Tognum (DE000A0N4P43) . . . . . . . . . . . . . . . . . . . . Count 715 000 715 000TUI Reg. (DE000TUAG000) . . . . . . . . . . . . . . . . . . . Count 350 000 1 100 000VBH Holding (DE0007600702) . . . . . . . . . . . . . . . . . Count 900 000Wacker Chemie (DE000WCH8881) . . . . . . . . . . . . . Count 50 000Unlisted securitiesEquitiesAareal Bank (new) (DE000A1KRLA6) . . . . . . . . . . . . Count 354 310 354 310Derivatives (option premiums realized in opening transactions, or total optionstransactions; in the case of warrants, purchases and sales are shown)Futures contractsValue (’000)Equity index futuresContracts purchased: EUR 4 119 976(Underlyings: DAX (performance index))Option contractsSecurities optionsEquity optionsPut options sold: EUR 23 000(Underlyings: Deutsche Börse Reg.)Securities loans (total transactions, at the value agreed at the closing of the loancontract)Value (’000)Perpetual EUR 3 772 011(Security description: adidas Reg., Aixtron Reg., Allianz SE, Aurubis AG, AxelSpringer Vink. Reg., BASF Reg., Bauer, Bayer, BB Biotech Reg.,Beiersdorf, Bijou Brigitte modische Accessoires, Bilfinger Berger,BMW Ord., Commerzbank, CompuGROUP Holding Ord.,Continental, Daimler Reg., Deutsche Bank Reg., Deutsche BoerseNew (applied for tender), Deutsche Börse Reg., DeutscheLufthansa Vink. Reg., Deutsche Post Reg., Deutsche TelekomReg., Dialog Semiconductor, E.ON Reg., elexis, ElringKlinger Reg.,EUROKAI Pref., Evotec, Fraport AG Frankfurt Airport ServicesWorldwide, Freenet, Fresenius Medical Care, Fresenius SE, GEAGroup, Gerry Weber International, Grontmij, HeidelbergCement,Hochtief, Intercell, K+S, Lanxess, Linde, MAN Ord., Merck, MTUAero Engines Holding Reg., Muehlbauer Holding, MünchenerRückversicherungs-Gesellschaft Vink. Reg., NORMA Group,Porsche Automobil Holding Pref., Porsche Automobil Holding Righton Pref., PUMA, Qiagen, Rheinmetall Ord., RWE Ord., SAP,Siemens Reg., SMA Solar Technology, Software, SolarWorld,STADA Arzneimittel Vink. Reg., STEICO, STO Pref., SüssicroTec, Symrise, ThyssenKrupp AG, Tognum, TUI Reg., UnitedInternet Reg., voestalpine, Volkswagen Pref., Vossloh, WackerChemie, Wacker Neuson SE)13
<strong>DWS</strong> <strong>Deutschland</strong>Statement of income and expenses (incl. income adjustment)Performance of the investment fund 2010/2011for the period from October 1, 2010, through September 30, 2011I. Income1. Dividends from domestic issuers . . . . . . . . . . . . . . . . . . EUR 62 177 012.452. Dividends from foreign issuers(before withholding tax) . . . . . . . . . . . . . . . . . . . . . . . . . EUR 4 299 388.243. Interest from investments of liquid assets in Germany . EUR 1 943 404.604. Income from securities lendingand repurchase agreements . . . . . . . . . . . . . . . . . . . . . . EUR 4 036 804.03including:from securities lending . . . . . . . . .EUR 4 036 804.035. Deduction for foreign withholding tax . . . . . . . . . . . . . . EUR -99 161.426. Other income . . . . . . . . . . . . . . . . . . . . . . . . . . . . . . . . . EUR 378 383.01Total income . . . . . . . . . . . . . . . . . . . . . . . . . . . . . . . . . . . . EUR 72 735 830.91II. Expenses1. Interest on borrowings . . . . . . . . . . . . . . . . . . . . . . . . . . EUR -3 346.822. Management fee . . . . . . . . . . . . . . . . . . . . . . . . . . . . . . EUR -40 420 643.88including:All-in fee . . . . . . . . . . . . . . . . . . . .EUR -40 420 643.883. Other expenses . . . . . . . . . . . . . . . . . . . . . . . . . . . . . . . EUR -2 018 401.98including:Performance-based fee fromsecurities lending income . . . . . . .EUR -2 018 401.98Total expenses . . . . . . . . . . . . . . . . . . . . . . . . . . . . . . . . . . EUR -42 442 392.68III. Net investment income . . . . . . . . . . . . . . . . . . . . . . . . EUR 30 293 438.23IV. Sale transactionsRealized gains . . . . . . . . . . . . . . . . . . . . . . . . . . . . . . . . . . . . EUR 168 107 522.67Realized losses . . . . . . . . . . . . . . . . . . . . . . . . . . . . . . . . . . . EUR -238 948 894.16Capital gains/losses . . . . . . . . . . . . . . . . . . . . . . . . . . . . . . EUR -70 841 371.49V. Net gain/loss for the fiscal year . . . . . . . . . . . . . . . . . . EUR -40 547 933.26I. Value of the investment fund at the beginningof the fiscal year . . . . . . . . . . . . . . . . . . . . . . . . . . . . . . EUR 1 415 461 017.701. Previous year's distribution or tax abatement . . . . . . . . . EUR -5 118 328.612. Net inflows . . . . . . . . . . . . . . . . . . . . . . . . . . . . . . . . . . . EUR 1 438 410 933.34a) Inflows from subscriptions . . . . . . . . . . . . . . . . . . . . EUR 3 683 915 411.16b) Outflows from redemptions . . . . . . . . . . . . . . . . . . . EUR -2 245 504 477.823. Income adjustment and reimbursed expenses . . . . . . . . EUR -14 075 904.144. Net investment income . . . . . . . . . . . . . . . . . . . . . . . . . . EUR 30 293 438.235. Realized gains . . . . . . . . . . . . . . . . . . . . . . . . . . . . . . . . . EUR 168 107 522.676. Realized losses . . . . . . . . . . . . . . . . . . . . . . . . . . . . . . . . EUR -238 948 894.167. Net change in unrealized appreciation/depreciation . . . . EUR -559 643 761.51II. Value of the investment fund atthe end of the fiscal year . . . . . . . . . . . . . . . . . . . . . . . EUR 2 234 486 023.52Distribution policy of the investment fundTotalPer unitI. Calculation of distribution1. Net gain/loss for the fiscal year . . . . . . . . EUR -40 547 933.26 -1.522. Transfer from the investment fund *) . . . EUR 49 278 924.64 1.85II. Available for distribution . . . . . . . . . . . . EUR 8 730 991.38 0.33III. Total distribution . . . . . . . . . . . . . . . . . . EUR 8 730 991.38 0.331. Final distributiona) Withholding tax oncapital income withheld . . . . . . . . . . . . EUR 8 275 821.22 0.31b) Solidarity surcharge withheld . . . . . . . EUR 455 170.17 0.02*) Due to the losses realized, a transfer from the investment fund was necessary.Total expense ratio (in accordance with article 41 (2) of the InvGThe total expense ratio was 1.40% p.a. The TER expresses total expenses and fees(excluding transaction costs) as a percentage of the fund’s average net assets for a givenfiscal year.As well, the additional income from securities lending resulted in a performance-basedfee of 0.071% p.a. calculated on the fund’s average net assets.Information provided in accordance with article 41 (4) and (5) of the InvG (Costs and CostTransparency).In the fiscal year from October 1, 2010, through September 30, 2011, the investmentcompany, <strong>DWS</strong> Investment GmbH, was not reimbursed for the fees and expenses paidby <strong>DWS</strong> <strong>Deutschland</strong> to the Custodian and other third parties, except in the form of financialinformation provided by brokers for research purposes.An all-in fee of 1.40% per year is payable to the investment company under the Terms ofContract. Of this annual fee, the investment company in turn pays up to 0.15% to theCustodian and up to 0.05% to other parties (for printing and publication costs, auditing andother items). Of its own portion of the all-in fee, the investment company pays more than10% in commissions to distributors of the fund; the specific percentage paid is based onthe balance of units distributed.Changes in net assets and in the net asset value perunit over the last three yearsNet assetsat the end ofthe fiscal year EURNet assetvalue perunit EUR2011 . . . . . . . . . . . . . . . . . . . . . . . . . . . . . . . . . . . . 2 234 486 023.52 83.902010 . . . . . . . . . . . . . . . . . . . . . . . . . . . . . . . . . . . . 1 415 461 017.70 96.332009 . . . . . . . . . . . . . . . . . . . . . . . . . . . . . . . . . . . . 594 769 998.44 86.832008 . . . . . . . . . . . . . . . . . . . . . . . . . . . . . . . . . . . . 218 971 321.59 79.29Transaction costsThe transaction costs paid in the reporting period amounted to EUR 5 155 663.19.The transaction costs include all costs that were reported or settled separately for theaccount of the fund in the reporting period and are directly connected to the purchase orsale of assets.Transactions processed for the account of the fund’s assets via closely related companies (based on major holdings of the Deutsche Bank Group)The share of transactions conducted for the account of the investment fund’s assets via brokers that are closely related companies and persons (share of five percent and above), amountedto 28.82 percent of all transactions. The total volume was EUR 754 303 214.83.14
Independentauditor’s reportKPMG issued an unqualified auditor's report forthe full annual report in accordance with article 44 (5)of the German Investment Act. The translation of theauditor's report is as follows:To <strong>DWS</strong> Investment GmbH, Frankfurt/Main, GermanyIn accordance with article 44 (5) of the German Investment Act (Investmentgesetz;InvG), <strong>DWS</strong> Investment GmbH commissioned us to perform the audit of the annualreport of the investment fund <strong>DWS</strong> <strong>Deutschland</strong> for the fiscal year from October 1, 2010,through September 30, 2011.Responsibility of the legal representativesThe preparation of the annual report according to the provisions of the InvG is theresponsibility of the legal representatives of the investment company.Responsibility of the auditorsOur responsibility is to express an opinion on the annual report based on our audit.We conducted our audit in accordance with article 44 (5) InvG and generally acceptedGerman standards for the audit of financial statements promulgated by the Institut derWirtschaftsprüfer (Institute of Public Auditors in Germany; IDW). Those standardsrequire that we plan and perform the audit such that misstatements materially affectingthe annual report are detected with reasonable assurance. Knowledge of themanagement of the investment fund and expectations as to possible misstatementsare taken into account in the determination of audit procedures. The effectiveness ofthe accounting-related internal control system and the evidence supporting thedisclosures in the annual report are examined primarily on a test basis within theframework of the audit. The audit includes assessing the accounting principles usedfor the annual report and significant estimates made by the legal representatives ofthe investment company. In our view, our audit provides a reasonably secure basis forour evaluation.Audit opinionOur audit has not led to any reservations.In our opinion, based on the findings of our audit, the annual report complies with thelegal requirements.Frankfurt/Main, December 20, 2011KPMG AGWirtschaftsprüfungsgesellschaftHornschuWirtschaftsprüferNeufWirtschaftsprüfer15
2010The formatused for complete datesin securities descriptions in the investmentportfolio is “day/month/year”.Annual report<strong>DWS</strong> Investa2011
To round out the portfolio, the managementcontinued to hold selected midandsmall-caps. Positions in Continentaland Axel Springer also lost significantground during the market weaknesstowards the end of the reportingperiod. Nevertheless, these stockswere not removed from the portfolio.As with the cyclical blue chips, thefocus was on medium-term performance,even if temporary price declineswere expected.Investments in defensive sectors alsooffered little in the way of an alternativesince in Germany these companieswere faced with substantial structuralproblems. The pharmaceutical sector isan example of one such sector: therewas little momentum in the productpipeline which produced few newmedications. In spite of the collectionof option premiums, derivatives had anegative impact on the fund’s performancebecause the puts on someinstruments had fallen below theirexercise price.<strong>DWS</strong> INVESTA: Summary statement of assetsInvestment focus by sectorEquities 89.5% (September 30, 2011) / Equities 95.4% (September 30, 2010)Consumer Discretionary18.925.7Materials15.922.0Industrials14.013.5Information Technology8.29.3Health Care5.76.0Financials5.415.2Telecommunication Services4.05.5Consumer Staples2.82.1Utilities1.78.0Energy0.00.7Not classified by MSCI system0.00.3Certificates3.88.9Cash and other assets 1.60.80 5 10 15 20 25 30In % of the fund’s net assets in bondsas of September 30, 2011In % of the fund’s net assets in bondsas of September 30, 2010Security code: 847 400ISIN: DE0008474008As of: September 30, 2011Main sources of capital gains/lossesThe main sources of capital gains/losses were losses realized from sellingequities and investing in derivatives.19
<strong>DWS</strong> InvestaCount/ Quantity/ Purchases/ Sales/ Market price Total market % ofDescription currency principal additions disposals value in net assets(– / ’000) amount in the reporting period EURDerivativesMinus signs denote short positionsDerivatives on individual securities -41 740 206.30 -1.89Securities options(Receivables/payables)Equity optionsCall Bayer (FLEX STR) 12/2011 Strike 56.50 (EURX) . . . . Count 1 200 000 EUR 0.1045 125 416.80 0.01Call E.ON 12/2011 Strike 21 (EURX) . . . . . . . . . . . . . . . . . Count 3 600 000 EUR 0.1300 468 000.00 0.02Call Metro (FLEX STR) 12/2011 Strike 41.80 (EURX) . . . . Count 800 000 EUR 0.1488 119 012.00 0.01Put Bayer (FLEX STR) 12/2011 Strike 55 (EURX) . . . . . . . Count -1 200 000 EUR 12.9176 -15 501 097.20 -0.70Put Deutsche Post 12/2011 Strike 12.50 (EURX) . . . . . . . Count -3 720 300 EUR 2.9150 -10 844 674.50 -0.49Put Deutsche Telekom 12/2011 Strike 10 (EURX) . . . . . . Count -2 650 000 EUR 1.3700 -3 630 500.00 -0.16Put E.ON 12/2011 Strike 19 (EURX) . . . . . . . . . . . . . . . . . Count -2 191 800 EUR 2.9700 -6 509 646.00 -0.29Put E.ON 12/2011 Strike 20 (EURX) . . . . . . . . . . . . . . . . . Count -1 227 500 EUR 3.7850 -4 646 087.50 -0.21Put Metro (FLEX STR) 12/2011 Strike 39 (EURX) . . . . . . . Count -800 000 EUR 7.0539 -5 643 113.60 -0.26Put SAP Stammakt. (FLEX) 12/2011 Strike 29.75 (EURX) Count -300 000 EUR 0.4314 -129 426.30 -0.01Put Solarworld 12/2011 Strike 10 (EURX) . . . . . . . . . . . . . Count -1 000 000 EUR 6.9150 -6 915 000.00 -0.31Securities futuresEquity futuresAllianz Future 12/2011 (EURX) EUR . . . . . . . . . . . . . . . . . Count 700 000 6 891 500.00 0.31Bayer Future 12/2011 (EURX) EUR . . . . . . . . . . . . . . . . . . Count 1 200 000 3 732 000.00 0.17Infineon Technologies Future 12/2011 (EURX) EUR . . . . . Count 1 600 000 -565 440.00 -0.03SAP Future 12/2011 (EURX) EUR . . . . . . . . . . . . . . . . . . . Count 500 000 1 308 850.00 0.06Equity index derivatives -2 226 826.25 -0.10(Receivables/payables)Equity index futuresDAX Index Future 12/2011 (EURX) EUR . . . . . . . . . . . . . . Count -37 500 -2226826.25 -0.10Cash and non-securitized money market instruments 80 879 020.19 3.66Cash at bank 80 879 020.19 3.66Demand deposits at CustodianEUR deposits . . . . . . . . . . . . . . . . . . . . . . . . . . . . . . . . . . EUR 79 856 133.65 % 100 79 856 133.65 3.61Deposits in other EU/EEA currencies . . . . . . . . . . . . . . . . EUR 969 956.30 % 100 969 956.30 0.04Deposits in non-EU/EEA currenciesSwiss franc . . . . . . . . . . . . . . . . . . . . . . . . . . . . . . . . . . . . CHF 22 416.12 % 100 18 376.11 0.00U.S. dollar . . . . . . . . . . . . . . . . . . . . . . . . . . . . . . . . . . . . . USD 46 737.57 % 100 34 554.13 0.00Other assets 280 951.65 0.01Interest receivable . . . . . . . . . . . . . . . . . . . . . . . . . . . . . . EUR 26 444.79 % 100 26 444.79 0.00Withholding tax claims . . . . . . . . . . . . . . . . . . . . . . . . . . . EUR 13 286.89 % 100 13 286.89 0.00Other receivables . . . . . . . . . . . . . . . . . . . . . . . . . . . . . . . EUR 241 219.97 % 100 241 219.97 0.01Receivables from share certificate transactions EUR 465 371.85 % 100 465 371.85 0.02Other liabilities -2 684 907.53 -0.12Liabilities from cost item . . . . . . . . . . . . . . . . . . . . . . . . . . EUR -2 564 297.52 % 100 -2 564 297.52 -0.12Additional other liabilities . . . . . . . . . . . . . . . . . . . . . . . . . EUR -120 610.01 % 100 -120 610.01 -0.01Liabilities from share certificate transactions EUR -165 137.44 % 100 -165 137.44 -0.01Net assets 2 211 891 226.27 100.00Net asset value per unit 74.72Number of units outstanding 29 603 314.584Negligible rounding errors may have arisen due to the rounding of calculated percentages.21
<strong>DWS</strong> InvestaComposition of the reference portfolio (risk benchmark) (according to article 28 (3), of the Derivatives Regulation (DerivateV))DAX (RI)Market risk exposure (value-at-risk) (according to article 28 (2), sentences 1 and 2, of the Derivatives Regulation (DerivateV))Lowest market risk exposure . . . . . . . . . . . . . . . . . . % 7.906Highest market risk exposure . . . . . . . . . . . . . . . . . . % 18.863Average market risk exposure . . . . . . . . . . . . . . . . . % 11.841The values-at-risk were calculated for the period from October 1, 2010, through September 30, 2011, using historical simulation with a 99% confidence level, a 10-day holding period andan effective historical observation period of one year. The risk in a reference portfolio that does not contain derivatives is used as the measurement benchmark. Market risk is the risk tothe fund from an unfavorable change in market prices. The investment company determines the potential market risk by means of the qualified approach as defined by the DerivativesRegulation.In the reporting period, the average leverage effect from the use of derivatives was 0.2, whereby the total of the nominal amounts of the derivates in relation to the fund’s assets wasused for the calculation (nominal value method).Market abbreviationsFutures exchangesEURX = Eurex (Eurex Frankfurt/Main / Eurex Zürich)Exchange rates (indirect quotes)As of September 30, 2011Swiss franc . . . . . . . . . . . . . . . . . . . . . CHF 1.219851 = EUR 1British pound . . . . . . . . . . . . . . . . . . . GBP 0.868596 = EUR 1U.S. dollar . . . . . . . . . . . . . . . . . . . . . USD 1.352590 = EUR 1Notes on the valuationThe Custodian shall determine the value with the participation of the investment company. The Custodian generally bases its valuation on external sources.If no trading prices are available, prices are determined with the aid of valuation models (derived market values) which are agreed between the Custodian and the investment companyand which are based as far as possible on market parameters. This procedure is subject to an ongoing monitoring process. The plausibility of price information from third parties is checkedthrough other pricing sources, model calculations or other suitable procedure.Investments reported in this report are not valued at derived market values.Footnotes3) These securities were completely or partly transferred under securities loans. The equivalent value of the lent securities is EUR 489 347 886.70.Transactions completed during the reporting period that no longer appear in the investment portfolioPurchases and sales of securities, investment fund units and promissory note loans (Schuldscheindarlehen); market classifications are as of the reporting dateDescriptionCount/currency(– / ’000)Purchases/additionsSales/disposalsDescriptionCount/currency(– / ’000)Purchases/additionsSales/disposalsSecurities traded on an exchangeEquitiesAareal Bank Right (DE000A1KRLB4) . . . . . . . . . . . . Count 1 000 000 1 000 000adidas (DE0005003404) . . . . . . . . . . . . . . . . . . . . . . Count 1 000 000Bilfinger Berger (DE0005909006) . . . . . . . . . . . . . . . Count 100 000 100 000Commerzbank (DE0008032004) . . . . . . . . . . . . . . . . Count 2 000 000 2 000 000Deutsche Bank Right (DE000A1E8H87) . . . . . . . . . . Count 2 000 000Deutsche Börse Reg. (DE0005810055) . . . . . . . . . . Count 500 000Freenet (DE000A0Z2ZZ5) . . . . . . . . . . . . . . . . . . . . . Count 3 300 000Fresenius SE Pref. (DE0005785638) . . . . . . . . . . . . Count 600 000Hamburger Hafen & Logistik A (DE000A0S8488) . . Count 82 300 200 000HeidelbergCement (DE0006047004) . . . . . . . . . . . . Count 100 000 900 000Hochtief (DE0006070006) . . . . . . . . . . . . . . . . . . . . Count 550 000 550 000K+S (DE0007162000) . . . . . . . . . . . . . . . . . . . . . . . . Count 701 355 1 101 355Koninklijke Philips Electronics (NL0000009538) . . . . Count 850 000 1 350 000Metro Ord. (DE0007257503) . . . . . . . . . . . . . . . . . . Count 100 000 100 000Porsche Automobil Holding Right on Pref.(DE000A1KRRB1) . . . . . . . . . . . . . . . . . . . . . . . . . . . Count 100 000 100 000RWE Ord. (DE0007037129) . . . . . . . . . . . . . . . . . . . Count 95 000 1 095 000Salzgitter (DE0006202005) . . . . . . . . . . . . . . . . . . . . Count 500 000SMA Solar Technology (DE000A0DJ6J9) . . . . . . . . . Count 350 000Symrise (DE000SYM9999) . . . . . . . . . . . . . . . . . . . . Count 1 600 000Total (FR0000120271) . . . . . . . . . . . . . . . . . . . . . . . . Count 500 000TUI Reg. (DE000TUAG000) . . . . . . . . . . . . . . . . . . . Count 771 089 771 08922
<strong>DWS</strong> InvestaDescriptionCount/currency(– / ’000)Purchases/additionsSales/disposalsTUI Travel (GB00B1Z7RQ77) . . . . . . . . . . . . . . . . . . Count 2 000 000 2 000 000CertificatesUBS London/Bayer 23.12.11 Perles Cert.(DE000UB3UZC7) . . . . . . . . . . . . . . . . . . . . . . . . . . . Count 2 000 000Unlisted securitiesEquitiesAareal Bank (new) (DE000A1KRLA6) . . . . . . . . . . . . Count 166 734 166 734Derivatives (option premiums realized in opening transactions, or total optionstransactions; in the case of warrants, purchases and sales are shown)Futures contractsSecurities futuresValue (’000)Equity futuresContracts purchased: EUR 1 177 594(Underlyings: Allianz SE, Bayer, Commerzbank, Daimler Reg.,Deutsche Bank Reg., E.ON Reg., Infineon Technologies Reg.,Linde, SAP, Siemens Reg., ThyssenKrupp AG)Equity index futuresContracts purchased: EUR 2 071 307(Underlyings: DAX (performance index), Dow Jones Euro STOXXBank)Contracts sold: EUR 1 509 160(Underlyings: DAX (performance index))Option contractsSecurities optionsEquity optionsPut options sold: EUR 12 400(Underlyings: Tognum)Options on equity index derivativesOptions on equity indicesPut options purchased: EUR 203 750(Underlyings: DAX (performance index))Securities loans (total transactions, at the value agreed at the closing of the loancontract)Value (’000)Perpetual EUR 5 480 860(Security description: Aareal Bank, adidas, adidas Reg., Aixtron Reg.,Allianz SE, Aurubis AG, Axel Springer Vink. Reg., BASFReg., Bayer, Beiersdorf, BMW Pref., Brenntag, Commerzbank,Continental, Daimler Reg., Deutsche Bank Reg., DeutscheBank Right, Deutsche Börse Reg., Deutsche Lufthansa Vink.Reg., Deutsche Telekom Reg., E.ON Reg., Freenet, FreseniusMedical Care, Fresenius SE, Fresenius SE Pref., HamburgerHafen & Logistik A, Hannover Rückversicherung Reg.,HeidelbergCement, Henkel Pref., Hochtief, Hugo Boss Pref.,Infineon Technologies Reg., K+S, K+S Reg., Lanxess, Lenzing,Linde, LVMH Moët Hennessy Louis Vuitton (C.R.), MAN Ord.,Münchener Rückversicherungs-Gesellschaft Vink.Reg., PorscheAutomobil Holding Pref., Porsche Automobil Holding Right on Pref.,ProSiebenSat.1 Media Pref., Qiagen, Rheinmetall Ord., RWE Ord.,Salzgitter, SAP, Siemens Reg., SMA Solar Technology, SolarWorld,Symrise, ThyssenKrupp AG, TUI Reg., United Internet Reg., VINCI,Volkswagen Pref., Wacker Chemie)23
<strong>DWS</strong> InvestaStatement of income and expenses (incl. income adjustment)Performance of the investment fund 2010/2011for the period from October 1, 2010, through September 30, 2011I. Income1. Dividends from domestic issuers . . . . . . . . . . . . . . . . . . EUR 71 197 894.852. Dividends from foreign issuers(before withholding tax) . . . . . . . . . . . . . . . . . . . . . . . . . EUR 852 492.293. Interest from foreign securities(before withholding tax) . . . . . . . . . . . . . . . . . . . . . . . . . EUR 28 765 815.764. Interest from investments of liquid assets in Germany . EUR 157 679.625. Income from securities lendingand repurchase agreements . . . . . . . . . . . . . . . . . . . . . . EUR 5 057 068.13including:from securities lending . . . . . . . . .EUR 5 057 068.136. Deduction for foreign withholding tax . . . . . . . . . . . . . . EUR -4 453.107. Other income . . . . . . . . . . . . . . . . . . . . . . . . . . . . . . . . . EUR 711 739.73Total income . . . . . . . . . . . . . . . . . . . . . . . . . . . . . . . . . . . . EUR 106 738 237.28II. Expenses1. Interest on borrowings . . . . . . . . . . . . . . . . . . . . . . . . . . EUR -6 869.822. Management fee . . . . . . . . . . . . . . . . . . . . . . . . . . . . . . EUR -40 951 489.92including:All-in fee . . . . . . . . . . . . . . . . . . . .EUR -40 951 489.923. Other expenses . . . . . . . . . . . . . . . . . . . . . . . . . . . . . . . EUR -2 530 280.23including:Performance-based fee fromsecurities lending income . . . . . . .EUR -2 528 534.11Legal expenses . . . . . . . . . . . . . . .EUR -1 716.76Other . . . . . . . . . . . . . . . . . . . . . . .EUR -29.36Total expenses . . . . . . . . . . . . . . . . . . . . . . . . . . . . . . . . . . EUR -43 488 639.97III. Net investment income . . . . . . . . . . . . . . . . . . . . . . . . EUR 63 249 597.31IV. Sale transactionsRealized gains . . . . . . . . . . . . . . . . . . . . . . . . . . . . . . . . . . . . EUR 232 552 232.37Realized losses . . . . . . . . . . . . . . . . . . . . . . . . . . . . . . . . . . . EUR -302 855 798.32Capital gains/losses . . . . . . . . . . . . . . . . . . . . . . . . . . . . . . EUR -70 303 565.95V. Net gain/loss for the fiscal year . . . . . . . . . . . . . . . . . . EUR -7 053 968.64I. Value of the investment fund at the beginningof the fiscal year . . . . . . . . . . . . . . . . . . . . . . . . . . . . . . EUR 2 792 077 042.421. Previous year's distribution or tax abatement . . . . . . . . . EUR -28 406 684.962. Net inflows . . . . . . . . . . . . . . . . . . . . . . . . . . . . . . . . . . . EUR -151 689 270.61a) Inflows from subscriptions . . . . . . . . . . . . . . . . . . . . EUR 172 180 359.04b) Outflows from redemptions . . . . . . . . . . . . . . . . . . . EUR -323 869 629.653. Income adjustment and reimbursed expenses . . . . . . . . EUR 3 168 564.914. Net investment income . . . . . . . . . . . . . . . . . . . . . . . . . . EUR 63 249 597.315. Realized gains . . . . . . . . . . . . . . . . . . . . . . . . . . . . . . . . . EUR 232 552 232.376. Realized losses . . . . . . . . . . . . . . . . . . . . . . . . . . . . . . . . EUR -302 855 798.327. Net change in unrealized appreciation/depreciation . . . . EUR -396 204 456.85II. Value of the investment fund atthe end of the fiscal year . . . . . . . . . . . . . . . . . . . . . . . EUR 2 211 891 226.27Distribution policy of the investment fundTotalPer unitI. Calculation of distribution1. Balance brought forwardfrom previous year . . . . . . . . . . . . . . . . . . EUR 399 500 300.58 13.502. Net gain/loss for the fiscal year . . . . . . . . EUR -7 053 968.64 -0.24II. Available for distribution . . . . . . . . . . . . EUR 392 446 331.94 13.261. Reinvested . . . . . . . . . . . . . . . . . . . . . . . . EUR -31 059 333.42 -1.052. Balance carried forward . . . . . . . . . . . . . . EUR -331 783 683.94 -11.21III. Total distribution . . . . . . . . . . . . . . . . . . EUR 29 603 314.58 1.001. Final distributiona) Cash distribution . . . . . . . . . . . . . . . . . EUR 19 988 851.24 0.67b) Withholding tax oncapital income withheld . . . . . . . . . . . . EUR 9 113 235.39 0.31c) Solidarity surcharge withheld . . . . . . . . EUR 501 227.95 0.02Total expense ratio (in accordance with article 41 (2) of the InvGThe total expense ratio was 1.40% p.a. The TER expresses total expenses and fees(excluding transaction costs) as a percentage of the fund’s average net assets for a givenfiscal year.As well, the additional income from securities lending resulted in a performance-basedfee of 0.086% p.a. calculated on the fund’s average net assets.Information provided in accordance with article 41 (4) and (5) of the InvG (Costs and CostTransparency).In the fiscal year from October 1, 2010, through September 30, 2011, the investmentcompany, <strong>DWS</strong> Investment GmbH, was not reimbursed for the fees and expenses paidby <strong>DWS</strong> Investa to the Custodian and other third parties, except in the form of financialinformation provided by brokers for research purposes.Changes in net assets and in the net asset value perunit over the last three yearsNet assetsat the end ofthe fiscal year EURNet assetvalue perunit EUR2011 . . . . . . . . . . . . . . . . . . . . . . . . . . . . . . . . . . . . 2 211 891 226.27 74.722010 . . . . . . . . . . . . . . . . . . . . . . . . . . . . . . . . . . . . 2 792 077 042.42 89.972009 . . . . . . . . . . . . . . . . . . . . . . . . . . . . . . . . . . . . 2 606 324 539.46 84.292008 . . . . . . . . . . . . . . . . . . . . . . . . . . . . . . . . . . . . 2 305 596 552.81 81.14An all-in fee of 1.40% per year is payable to the investment company under the Terms ofContract. Of this annual fee, the investment company in turn pays up to 0.15% to theCustodian and up to 0.05% to other parties (for printing and publication costs, auditing andother items). Of its own portion of the all-in fee, the investment company pays more than10% in commissions to distributors of the fund; the specific percentage paid is based onthe balance of units distributed.Transaction costsThe transaction costs paid in the reporting period amounted to EUR 6 899 298.73.The transaction costs include all costs that were reported or settled separately for theaccount of the fund in the reporting period and are directly connected to the purchase orsale of assets.Transactions processed for the account of the fund’s assets via closely related companies (based on major holdings of the Deutsche Bank Group)The share of transactions conducted for the account of the investment fund’s assets via brokers that are closely related companies and persons (share of five percent and above), amountedto 33.28 percent of all transactions. The total volume was EUR 874 717 563.20.24
Independentauditor’s reportKPMG issued an unqualified auditor's report forthe full annual report in accordance with article 44 (5)of the German Investment Act. The translation of theauditor's report is as follows:To <strong>DWS</strong> Investment GmbH, Frankfurt/Main, GermanyIn accordance with article 44 (5) of the German Investment Act (Investmentgesetz;InvG), <strong>DWS</strong> Investment GmbH commissioned us to perform the audit of the annualreport of the investment fund <strong>DWS</strong> Investa for the fiscal year from October 1, 2010,through September 30, 2011.Responsibility of the legal representativesThe preparation of the annual report according to the provisions of the InvG is theresponsibility of the legal representatives of the investment company.Responsibility of the auditorsOur responsibility is to express an opinion on the annual report based on our audit.We conducted our audit in accordance with article 44 (5) InvG and generally acceptedGerman standards for the audit of financial statements promulgated by the Institut derWirtschaftsprüfer (Institute of Public Auditors in Germany; IDW). Those standardsrequire that we plan and perform the audit such that misstatements materially affectingthe annual report are detected with reasonable assurance. Knowledge of themanagement of the investment fund and expectations as to possible misstatementsare taken into account in the determination of audit procedures. The effectiveness ofthe accounting-related internal control system and the evidence supporting thedisclosures in the annual report are examined primarily on a test basis within theframework of the audit. The audit includes assessing the accounting principles usedfor the annual report and significant estimates made by the legal representatives ofthe investment company. In our view, our audit provides a reasonably secure basis forour evaluation.Audit opinionOur audit has not led to any reservations.In our opinion, based on the findings of our audit, the annual report complies with thelegal requirements.Frankfurt/Main, December 20, 2011KPMG AGWirtschaftsprüfungsgesellschaftHornschuWirtschaftsprüferNeufWirtschaftsprüfer25
2010The formatused for complete datesin securities descriptions in the investmentportfolio is “day/month/year”.Annual report<strong>DWS</strong> Aktien Strategie <strong>Deutschland</strong>2011
<strong>DWS</strong> Aktien Strategie <strong>Deutschland</strong>Investment objective andperformance in the reporting period<strong>DWS</strong> Aktien Strategie <strong>Deutschland</strong>invests primarily in German blue chipstocks and in equities of fast-growingsmall and medium-sized enterprises.The value of the fund fell 9.3% per unitin the fiscal year through the end ofSeptember 2011 (BVI method). How -ever, it thus performed better than itsbenchmark index, the HDAX (-11.1%).Doubts about the solvency of Greeceand other southern European countriescoupled with signs of a global economicdownturn dominated the performancein the German exchanges, especiallytowards the end of the reporting period.Investment policyin the reporting periodIn the opinion of the fund management,there was a substantial risk in investmentsin bank stocks. There wereconcerns that the debt crisis could resultin a liquidity bottleneck in thebanking sector. This sector was underweightedand further reduced in theportfolio throughout the reporting year,which had a positive effect on the performanceof the fund in comparison tothe benchmark. The management alsosaw a substantial investment risk in thesolar stocks in the portfolio. The reductionin feed-in compensation for solarenergy and intensifying competitionwith Asian providers put pressure onmany companies’ business models. Forthis reason, positions in SolarWorld andSMA Solar Technology were closed.<strong>DWS</strong> AKTIEN STRATEGIE DEUTSCHLANDFive-year performance145130115100857055409/06* 9/07 9/08 9/09 9/109/11<strong>DWS</strong> Aktien Strategie <strong>Deutschland</strong>* 9/2006 = 100Data on euro basis“BVI method” performance, i.e., excluding the initial sales charge. Past performance is no guide to future results.As of: September 30, 2011<strong>DWS</strong> AKTIEN STRATEGIEDEUTSCHLAND vs. benchmarkPerformance at a glancein %1050-5-10-15-201 year+6.4-4.53 years-5.4-9.3 -9.3-11.15 years<strong>DWS</strong> Aktien Strategie <strong>Deutschland</strong>Benchmark HDAXData on euro basis“BVI method” performance, i.e., excluding theinitial sales charge. Past performance is no guideto future results.As of: September 30, 2011The reason for the outperformance layin the underweightings mentionedabove in addition to the focus on midandsmall-caps with defensive profiles,such as the health and consumer goodssectors. This included positions inSartorius, Eurofins Scientific andHawesko. The overall proportion ofso-called “secondary stocks” in thereporting year was around 40% to 50%of the fund’s assets. Even during the28
ecent crisis period, these stocks didnot fall as far as blue chips. This wasalso true for the entire reporting period.However, the strategic positioning ofthe portfolio in cyclical, economicallysensitivecompanies and companieswith strong exports – including in theblue chip segment – was retained; themanagement expected only a slight,temporary cooling of global economicgrowth. The chemical (BASF), automotive(BMW, VW), engineering and plantconstruction (Siemens) sectors continuedto be the heavyweights in the portfolio.In the first ten months of the fiscal year– through July 2011 – these stocks didvery well thanks to the positive globaleconomic climate and the pronouncedexport strengths of German companies.Only toward the end of the reportingperiod were heavy price declinessuffered here. This was the result ofglobal fears of slowing economicgrowth as euro area debt problemsintensified. During the sharp downwardtrend, the fund profited by selling DAXfutures.<strong>DWS</strong> AKTIEN STRATEGIE DEUTSCHLAND: Summary statement of assetsInvestment focus by sectorEquities 89.8% (September 30, 2011) / Equities 94.9% (September 30, 2010)Consumer DiscretionaryMaterialsIndustrialsInformation TechnologyHealth CareFinancialsConsumer StaplesTelecommunication ServicesUtilitiesEnergyCertificatesCash and other assets0.70.40.00.10.1In % of the fund’s net assets in bondsas of September 30, 2011In % of the fund’s net assets in bondsas of September 30, 20103.23.83.10.41.73.410.85.410.14.97.69.821.719.314.616.717.618.725.90 5 10 15 20 25 30Security code: 976 986ISIN: DE0009769869As of: September 30, 2011Main sources of capital gains/lossesThe main sources of capital gains wereprofits realized from selling equities andinvesting in derivatives.29
Annual report<strong>DWS</strong> Aktien Strategie <strong>Deutschland</strong>Investment portfolio – September 30, 2011Count/ Quantity/ Purchases/ Sales/ Market price Total market % ofDescription currency principal additions disposals value in net assets(– / ’000) amount in the reporting period EURSecurities traded on an exchange 765 843 463.97 99.62EquitiesAareal Bank (DE0005408116) . . . . . . . . . . . . . . . . . . . . . . Count 400 000 508 377 571 777 EUR 11.9000 4 760 000.00 0.62Activa resources (DE0007471377) . . . . . . . . . . . . . . . . . . Count 358 028 EUR 2.2480 804 846.94 0.10adidas Reg. (DE000A1EWWW0) 3) . . . . . . . . . . . . . . . . . Count 500 000 600 000 100 000 EUR 44.9500 22 475 000.00 2.92Adler Modemärkte (DE000A1H8MU2) 3) . . . . . . . . . . . . . Count 1 100 000 1 100 000 EUR 8.1430 8 957 300.00 1.17ADVA Optical Networking (DE0005103006) 3) . . . . . . . . . Count 3 060 000 70 000 EUR 3.3590 10 278 540.00 1.34Allianz SE (DE0008404005) 3) . . . . . . . . . . . . . . . . . . . . . . Count 50 000 350 000 EUR 69.7100 3 485 500.00 0.45Aurubis AG (DE0006766504) . . . . . . . . . . . . . . . . . . . . . . Count 200 000 70 000 70 000 EUR 38.6050 7 721 000.00 1.00Axel Springer Vink. Reg. (DE0005501357) . . . . . . . . . . . . Count 500 000 390 945 3 894 EUR 25.7850 12 892 500.00 1.68BASF Reg. (DE000BASF111) 3) . . . . . . . . . . . . . . . . . . . . Count 1 650 000 660 000 10 000 EUR 45.9950 75 891 750.00 9.87Bayer (DE000BAY0017) . . . . . . . . . . . . . . . . . . . . . . . . . . Count 100 000 90 000 240 000 EUR 41.5050 4 150 500.00 0.54Bechtle (DE0005158703) . . . . . . . . . . . . . . . . . . . . . . . . . Count 360 000 400 000 40 000 EUR 25.1800 9 064 800.00 1.18Beiersdorf (DE0005200000) . . . . . . . . . . . . . . . . . . . . . . . Count 100 000 220 000 270 000 EUR 39.5600 3 956 000.00 0.51Bilfinger Berger (DE0005909006) . . . . . . . . . . . . . . . . . . . Count 150 000 340 000 190 000 EUR 55.4900 8 323 500.00 1.08BMW Ord. (DE0005190003) . . . . . . . . . . . . . . . . . . . . . . . Count 540 000 90 000 150 000 EUR 49.0000 26 460 000.00 3.44CENTROTEC Sustainable (DE0005407506) . . . . . . . . . . . Count 580 000 80 000 225 300 EUR 13.6250 7 902 500.00 1.03Centrotherm Photovoltaics (DE000A0JMMN2) . . . . . . . . Count 302 513 330 000 27 487 EUR 15.5000 4 688 951.50 0.61Continental (DE0005439004) . . . . . . . . . . . . . . . . . . . . . . Count 500 000 300 000 150 000 EUR 43.7800 21 890 000.00 2.85CTS EVENTIM (DE0005470306) . . . . . . . . . . . . . . . . . . . . Count 670 000 584 171 10 000 EUR 22.3000 14 941 000.00 1.94Delticom Reg. (DE0005146807) . . . . . . . . . . . . . . . . . . . . Count 10 000 10 000 EUR 64.7000 647 000.00 0.08Deutsche EuroShop Reg. (DE0007480204) . . . . . . . . . . . Count 300 000 68 300 EUR 25.2000 7 560 000.00 0.98Deutsche Telekom Reg. (DE0005557508) 3) . . . . . . . . . . Count 2 750 000 6 740 700 4 000 000 EUR 8.7700 24 117 500.00 3.14E.ON Reg. (DE000ENAG999) . . . . . . . . . . . . . . . . . . . . . . Count 200 000 2 124 600 1 924 600 EUR 16.4250 3 285 000.00 0.43ElringKlinger Reg. (DE0007856023) . . . . . . . . . . . . . . . . . Count 450 000 220 000 EUR 17.5600 7 902 000.00 1.03Eurofins Scientific (FR0000038259) 3) . . . . . . . . . . . . . . . Count 130 000 1 047 159 293 EUR 56.4000 7 332 000.00 0.95Fielmann (DE0005772206) . . . . . . . . . . . . . . . . . . . . . . . . Count 115 000 115 000 35 000 EUR 74.5600 8 574 400.00 1.12Fraport AG Frankfurt Airport Services Worldwide(DE0005773303) . . . . . . . . . . . . . . . . . . . . . . . . . . . . . . . . Count 120 000 120 000 EUR 44.3600 5 323 200.00 0.69Fresenius SE (DE0005785604) . . . . . . . . . . . . . . . . . . . . . Count 220 000 220 000 EUR 66.2000 14 564 000.00 1.89GEA Group (DE0006602006) . . . . . . . . . . . . . . . . . . . . . . Count 400 000 EUR 17.3700 6 948 000.00 0.90GfK (DE0005875306) . . . . . . . . . . . . . . . . . . . . . . . . . . . . Count 300 000 300 000 EUR 28.3150 8 494 500.00 1.10Hannover Rückversicherung Reg. (DE0008402215) . . . . . Count 50 000 50 000 EUR 33.8850 1 694 250.00 0.22HAWESKO Holding (DE0006042708) . . . . . . . . . . . . . . . . Count 330 000 28 800 EUR 34.0000 11 220 000.00 1.46Henkel Pref. (DE0006048432) 3) . . . . . . . . . . . . . . . . . . . Count 250 000 170 000 123 900 EUR 39.2300 9 807 500.00 1.28Highlight Communications (CH0006539198) . . . . . . . . . . Count 2 240 000 500 000 19 799 EUR 3.3060 7 405 440.00 0.96Hymer (DE0006096704) . . . . . . . . . . . . . . . . . . . . . . . . . . Count 129 000 1 000 EUR 45.5000 5 869 500.00 0.76Infineon Technologies Reg. (DE0006231004) 3) . . . . . . . . Count 1 700 000 100 000 EUR 5.5430 9 423 100.00 1.23Jenoptik (DE0006229107) . . . . . . . . . . . . . . . . . . . . . . . . . Count 100 000 100 000 EUR 4.7700 477 000.00 0.06K+S Reg. (DE000KSAG888) . . . . . . . . . . . . . . . . . . . . . . . Count 250 000 431 085 181 085 EUR 40.1950 10 048 750.00 1.31Krones (DE0006335003) 3) . . . . . . . . . . . . . . . . . . . . . . . . Count 180 000 90 000 30 000 EUR 38.7600 6 976 800.00 0.91KSB Pref. (DE0006292030) . . . . . . . . . . . . . . . . . . . . . . . . Count 20 000 2 849 EUR 384.0500 7 681 000.00 1.00Lanxess (DE0005470405) . . . . . . . . . . . . . . . . . . . . . . . . . Count 200 000 90 000 240 000 EUR 35.9450 7 189 000.00 0.94Lenzing (AT0000644505) . . . . . . . . . . . . . . . . . . . . . . . . . . Count 50 000 50 000 EUR 72.6600 3 633 000.00 0.47Linde (DE0006483001) 3) . . . . . . . . . . . . . . . . . . . . . . . . . Count 250 000 50 000 EUR 101.6000 25 400 000.00 3.30M.A.X. Automation (DE0006580905) . . . . . . . . . . . . . . . . Count 1 845 828 75 000 EUR 3.9710 7 329 782.99 0.95MAN Ord. (DE0005937007) . . . . . . . . . . . . . . . . . . . . . . . Count 500 000 440 000 EUR 59.2000 29 600 000.00 3.85NORMA Group (DE000A1H8BV3) . . . . . . . . . . . . . . . . . . Count 600 000 600 000 EUR 12.2000 7 320 000.00 0.95Phoenix Solar (DE000A0BVU93) 3) . . . . . . . . . . . . . . . . . . Count 338 188 450 000 111 812 EUR 8.6800 2 935 471.84 0.38Prime Office (DE000PRME012) . . . . . . . . . . . . . . . . . . . . Count 1 587 700 1 587 700 EUR 4.4060 6 995 406.20 0.91ProSiebenSat.1 Media Pref. (DE0007771172) . . . . . . . . . Count 700 000 250 000 110 000 EUR 13.2650 9 285 500.00 1.21PSI AG für Produkte und Systeme der Info. Tech.(DE000A0Z1JH9) 3) . . . . . . . . . . . . . . . . . . . . . . . . . . . . . . Count 250 000 403 619 EUR 17.5000 4 375 000.00 0.57PVA TePla (DE0007461006) . . . . . . . . . . . . . . . . . . . . . . . Count 1 858 983 331 083 EUR 3.5000 6 506 440.50 0.85Rheinmetall Ord. (DE0007030009) . . . . . . . . . . . . . . . . . . Count 75 000 3 650 78 650 EUR 35.2700 2 645 250.00 0.34SAP (DE0007164600) 3) . . . . . . . . . . . . . . . . . . . . . . . . . . Count 250 000 250 000 1 000 EUR 37.9650 9 491 250.00 1.23Sartorius Pref. (DE0007165631) 3) . . . . . . . . . . . . . . . . . . Count 520 000 5 197 130 000 EUR 30.0000 15 600 000.00 2.03SFC Smart Fuel Cell (DE0007568578) . . . . . . . . . . . . . . . Count 544 900 EUR 3.9100 2 130 559.00 0.28Siemens Reg. (DE0007236101) 3) . . . . . . . . . . . . . . . . . . Count 300 000 200 000 EUR 67.4200 20 226 000.00 2.63Sixt Pref. (DE0007231334) . . . . . . . . . . . . . . . . . . . . . . . . Count 680 000 495 300 334 877 EUR 12.2500 8 330 000.00 1.08Software (DE0003304002) . . . . . . . . . . . . . . . . . . . . . . . . Count 250 000 330 000 80 000 EUR 23.5850 5 896 250.00 0.77TAG Tegernsee Immobilien- und Beteiligungs-AG(DE0008303504) 3) . . . . . . . . . . . . . . . . . . . . . . . . . . . . . . Count 2 200 000 2 200 000 EUR 5.9500 13 090 000.00 1.70ThyssenKrupp AG (DE0007500001) . . . . . . . . . . . . . . . . . Count 1 000 000 1 600 000 600 000 EUR 18.5950 18 595 000.00 2.42Tom Tailor Holding (DE000A0STST2) . . . . . . . . . . . . . . . . Count 1 000 000 18 007 EUR 11.6500 11 650 000.00 1.52Tomorrow Focus (DE0005495329) 3) . . . . . . . . . . . . . . . . Count 3 620 000 EUR 3.4400 12 452 800.00 1.62United Internet Reg. (DE0005089031) . . . . . . . . . . . . . . . Count 600 000 697 300 EUR 12.6800 7 608 000.00 0.99Volkswagen Pref. (DE0007664039) . . . . . . . . . . . . . . . . . . Count 300 000 200 000 130 000 EUR 102.0000 30 600 000.00 3.98Vossloh (DE0007667107) 3) . . . . . . . . . . . . . . . . . . . . . . . Count 100 000 136 000 36 000 EUR 73.1500 7 315 000.00 0.9530
<strong>DWS</strong> Aktien Strategie <strong>Deutschland</strong>Count/ Quantity/ Purchases/ Sales/ Market price Total market % ofDescription currency principal additions disposals value in net assets(– / ’000) amount in the reporting period EURCertificatesCredit Suisse/SAP 23.12.11 Tracker Cert.(DE000CS0DWM8) . . . . . . . . . . . . . . . . . . . . . . . . . . . . . . Count 450 000 450 000 EUR 38.4400 17 298 000.00 2.25Credit Suisse/Siemens 23.12.11 Tracker Cert.(DE000CS0DWJ4) . . . . . . . . . . . . . . . . . . . . . . . . . . . . . . . Count 200 000 200 000 EUR 69.1100 13 822 000.00 1.80Soc. Generale/Allianz 27.12.11 Tracker Cert.(DE000SG11LK7) . . . . . . . . . . . . . . . . . . . . . . . . . . . . . . . . Count 130 000 150 000 20 000 EUR 72.3250 9 402 250.00 1.22Soc. Generale/BASF 27.12.11 Tracker Cert.(DE000SG1K9P9) . . . . . . . . . . . . . . . . . . . . . . . . . . . . . . . Count 200 000 124 400 EUR 48.7700 9 754 000.00 1.27Soc. Generale/Linde 27.12.11 Tracker Cert.(DE000SG1K9Q7) . . . . . . . . . . . . . . . . . . . . . . . . . . . . . . . Count 75 000 17 700 EUR 104.9700 7 872 750.00 1.02UBS London/Allianz 30.12.13 Perles Cert.(DE000UB44ZL3) . . . . . . . . . . . . . . . . . . . . . . . . . . . . . . . . Count 125 000 125 000 EUR 72.2250 9 028 125.00 1.17UBS London/Bayer 20.12.13 Perles Cert.(DE000UB5UZC2) . . . . . . . . . . . . . . . . . . . . . . . . . . . . . . . Count 200 000 200 000 EUR 42.3600 8 472 000.00 1.10Total securities portfolio 765 843 463.97 99.62DerivativesMinus signs denote short positionsDerivatives on individual securities -10 240 190.20 -1.33Securities options(Receivables/payables)Equity optionsCall Bayer (FLEX STR) 12/2011 Strike 56.50 (EURX) . . . . Count 200 000 EUR 0.1045 20 902.80 0.00Call E.ON 12/2011 Strike 21 (EURX) . . . . . . . . . . . . . . . . . Count 2 550 000 EUR 0.1300 331 500.00 0.04Call SAP (FLEX) 12/2011 Strike 36.50 (EURX) . . . . . . . . . Count 800 000 EUR 3.4368 2 749 441.60 0.36Put Bayer (FLEX STR) 12/2011 Strike 55 (EURX) . . . . . . . Count -200 000 EUR 12.9176 -2 583 516.20 -0.34Put Continental 12/2011 Strike 56 (EURX) . . . . . . . . . . . . Count -115 000 EUR 10.6500 -1 224 750.00 -0.16Put Deutsche Telekom 12/2011 Strike 10 (EURX) . . . . . . Count -1 950 000 EUR 1.3700 -2 671 500.00 -0.35Put E.ON 12/2011 Strike 19 (EURX) . . . . . . . . . . . . . . . . . Count -747 300 EUR 2.9700 -2 219 481.00 -0.29Put E.ON 12/2011 Strike 20 (EURX) . . . . . . . . . . . . . . . . . Count -1 578 100 EUR 3.7850 -5 973 108.50 -0.78Put SAP Stammakt. (FLEX) 12/2011 Strike 29.75 (EURX) Count -900 000 EUR 0.4314 -388 278.90 -0.05Put Solarworld 12/2011 Strike 10 (EURX) . . . . . . . . . . . . . Count -700 000 EUR 6.9150 -4 840 500.00 -0.63Securities futuresEquity futuresAllianz Future 12/2011 (EURX) EUR . . . . . . . . . . . . . . . . . Count 300 000 2 953 500.00 0.38Bayer Future 12/2011 (EURX) EUR . . . . . . . . . . . . . . . . . . Count 1 000 000 3 110 000.00 0.40Linde Future 12/2011 (EURX) EUR . . . . . . . . . . . . . . . . . . Count 150 000 495 600.00 0.06Equity index derivatives -2 959 900.40 -0.39(Receivables/payables)Equity index futuresDAX Index Future 12/2011 (EURX) EUR . . . . . . . . . . . . . . Count -25000 -2959900.40 -0.39Cash and non-securitized money market instruments 17 666 706.66 2.30Cash at bank 17 666 706.66 2.30Demand deposits at CustodianEUR deposits . . . . . . . . . . . . . . . . . . . . . . . . . . . . . . . . . . EUR 17 354 537.39 % 100 17 354 537.39 2.26Deposits in non-EU/EEA currenciesSwiss franc . . . . . . . . . . . . . . . . . . . . . . . . . . . . . . . . . . . . CHF 380 800.00 % 100 312 169.27 0.04Other assets 28 666.78 0.00Interest receivable . . . . . . . . . . . . . . . . . . . . . . . . . . . . . . EUR 6 677.74 % 100 6 677.74 0.00Withholding tax claims . . . . . . . . . . . . . . . . . . . . . . . . . . . EUR 3 950.02 % 100 3 950.02 0.00Other receivables . . . . . . . . . . . . . . . . . . . . . . . . . . . . . . . EUR 18 039.02 % 100 18 039.02 0.00Receivables from share certificate transactions EUR 356 245.08 % 100 356 245.08 0.0531
<strong>DWS</strong> Aktien Strategie <strong>Deutschland</strong>Count/ Quantity/ Purchases/ Sales/ Market price Total market % ofDescription currency principal additions disposals value in net assets(– / ’000) amount in the reporting period EUROther liabilities -942 638.19 -0.12Liabilities from cost items . . . . . . . . . . . . . . . . . . . . . . . . . EUR -933 618.99 % 100 -933 618.99 -0.12Additional other liabilities . . . . . . . . . . . . . . . . . . . . . . . . . EUR -9 019.20 % 100 -9 019.20 0.00Liabilities from share certificate transactions EUR -968 471.45 % 100 -968 471.45 -0.13Net assets 768 783 882.25 100.00Net asset value per unit 133.03Number of units outstanding 5 779 003.134Negligible rounding errors may have arisen due to the rounding of calculated percentages.Composition of the reference portfolio (risk benchmark) (according to article 28 (3), of the Derivatives Regulation (DerivateV))HDAX Performance IndexMarket risk exposure (value-at-risk) (according to article 28 (2), sentences 1 and 2, of the Derivatives Regulation (DerivateV))Lowest market risk exposure . . . . . . . . . . . . . . . . . . % 7.197Highest market risk exposure . . . . . . . . . . . . . . . . . . % 19.539Average market risk exposure . . . . . . . . . . . . . . . . . % 12.260The values-at-risk were calculated for the period from October 1, 2010, through September 30, 2011, using historical simulation with a 99% confidence level, a 10-day holding period andan effective historical observation period of one year. The risk in a reference portfolio that does not contain derivatives is used as the measurement benchmark. Market risk is the risk tothe fund from an unfavorable change in market prices. The investment company determines the potential market risk by means of the qualified approach as defined by the DerivativesRegulation.In the reporting period, the average leverage effect from the use of derivatives was 0.4, whereby the total of the nominal amounts of the derivates in relation to the fund’s assets wasused for the calculation (nominal value method).Market abbreviationsFutures exchangesEURX = Eurex (Eurex Frankfurt/Main / Eurex Zürich)Exchange rates (indirect quotes)As of September 30, 2011Swiss franc . . . . . . . . . . . . . . . . . . . . . CHF 1.219851 = EUR 1Notes on the valuationThe Custodian shall determine the value with the participation of the investment company. The Custodian generally bases its valuation on external sources.If no trading prices are available, prices are determined with the aid of valuation models (derived market values) which are agreed between the Custodian and the investment companyand which are based as far as possible on market parameters. This procedure is subject to an ongoing monitoring process. The plausibility of price information from third parties is checkedthrough other pricing sources, model calculations or other suitable procedure.Investments reported in this report are not valued at derived market values.Footnotes3) These securities were completely or partly transferred under securities loans. The equivalent value of the lent securities is EUR 96 395 182.77.32
<strong>DWS</strong> Aktien Strategie <strong>Deutschland</strong>Transactions completed during the reporting period that no longer appear in the investment portfolioPurchases and sales of securities, investment fund units and promissory noteloans (Schuldscheindarlehen); market classifications are as of the reporting dateCount/Purchases/ Sales/Descriptioncurrencyadditions disposals(– / ’000)Securities traded on an exchangeEquitiesadidas (DE0005003404) . . . . . . . . . . . . . . . . . . . . . . Count 350 000Aixtron Reg. (DE000A0WMPJ6) . . . . . . . . . . . . . . . . Count 170 000 530 000Bauer (DE0005168108) . . . . . . . . . . . . . . . . . . . . . . . Count 12 200 230 000Bijou Brigitte modische Accessoires(DE0005229504) . . . . . . . . . . . . . . . . . . . . . . . . . . . . Count 55 000 100 000Brenntag (DE000A1DAHH0) . . . . . . . . . . . . . . . . . . . Count 44 265 159 265CeWe Color Holding (DE0005403901) . . . . . . . . . . . Count 120 000 120 000Commerzbank (DE0008032004) . . . . . . . . . . . . . . . . Count 400 000 400 000Daimler Reg. (DE0007100000) . . . . . . . . . . . . . . . . . Count 440 000 450 000Demag Cranes (DE000DCAG010) . . . . . . . . . . . . . . Count 370 000 370 000Deutsche Bank Reg. (DE0005140008) . . . . . . . . . . . Count 5 000 15 000Deutsche Bank Right (DE000A1E8H87) . . . . . . . . . . Count 10 000Deutsche Lufthansa Vink. Reg. (DE0008232125) . . Count 1 400 000 2 150 000Deutsche Wohnen (DE000A0HN5C6) . . . . . . . . . . . Count 900 000DEUTZ (DE0006305006) . . . . . . . . . . . . . . . . . . . . . . Count 1 610 735 1 610 735euromicron (DE0005660005) . . . . . . . . . . . . . . . . . . Count 245 000Evotec (DE0005664809) . . . . . . . . . . . . . . . . . . . . . . Count 1 000 000 1 000 000Freenet (DE000A0Z2ZZ5) . . . . . . . . . . . . . . . . . . . . . Count 600 000Fresenius Medical Care (DE0005785802) . . . . . . . . Count 324 400Fresenius SE Pref. (DE0005785638) . . . . . . . . . . . . Count 20 000 220 000Fuchs Petrolub Pref. (DE0005790430) . . . . . . . . . . . Count 15 000HeidelbergCement (DE0006047004) . . . . . . . . . . . . Count 40 000 240 000Hochtief (DE0006070006) . . . . . . . . . . . . . . . . . . . . Count 174 900 300 000K+S (DE0007162000) . . . . . . . . . . . . . . . . . . . . . . . . Count 431 085 431 085KTG Agrar (DE000A0DN1J4) . . . . . . . . . . . . . . . . . . Count 45 900KWS SAAT (DE0007074007) . . . . . . . . . . . . . . . . . . Count 30 000Leoni Reg. (DE0005408884) . . . . . . . . . . . . . . . . . . . Count 340 000Merck (DE0006599905) . . . . . . . . . . . . . . . . . . . . . . Count 150 000 250 000Metro Ord. (DE0007257503) . . . . . . . . . . . . . . . . . . Count 250 000 250 000MTU Aero Engines Holding Reg. (DE000A0D9PT0) Count 150 000Pfeiffer Vacuum Technology (DE0006916604) . . . . . Count 120 000Porsche Automobil Holding Pref. (DE000PAH0038) Count 300 000 300 000Porsche Automobil Holding Right on Pref.(DE000A1KRRB1) . . . . . . . . . . . . . . . . . . . . . . . . . . . Count 155 000 155 000Q-Cells (DE0005558662) . . . . . . . . . . . . . . . . . . . . . Count 2 000 000Qiagen (NL0000240000) . . . . . . . . . . . . . . . . . . . . . . Count 260 800 650 000Rational Ord. (DE0007010803) . . . . . . . . . . . . . . . . . Count 10 000 50 000SMA Solar Technology (DE000A0DJ6J9) . . . . . . . . . Count 100 000SolarWorld (DE0005108401) . . . . . . . . . . . . . . . . . . Count 450 000 1 950 000Südzucker Ord. (DE0007297004) . . . . . . . . . . . . . . . Count 50 000 50 000Symrise (DE000SYM9999) . . . . . . . . . . . . . . . . . . . . Count 140 000 510 700Tognum (DE000A0N4P43) . . . . . . . . . . . . . . . . . . . . Count 350 000 500 000TUI Reg. (DE000TUAG000) . . . . . . . . . . . . . . . . . . . Count 1 000 000 1 000 000VERBIO Vereinigte BioEnergie (DE000A0JL9W6) . . Count 158 756 158 756Wacker Chemie (DE000WCH8881) . . . . . . . . . . . . . Count 120 000 140 000Wincor Nixdorf (DE000A0CAYB2) . . . . . . . . . . . . . . Count 26 000 165 000XING (DE000XNG8888) . . . . . . . . . . . . . . . . . . . . . . Count 270 000Securities that are admitted or included in organized marketsEquitiesDialog Semiconductor (GB0059822006) . . . . . . . . . Count 700 000Unlisted securitiesDerivatives (option premiums realized in opening transactions, or total optionstransactions; in the case of warrants, purchases and sales are shown)Futures contractsSecurities futuresValue (’000)Equity futuresContracts purchased: EUR 1 282 240(Underlyings: Allianz SE, Bayer, Commerzbank, Daimler Reg.,Deutsche Bank Reg., Deutsche Lufthansa Vink. Reg., E.ON Reg.,Infineon Technologies Reg., Linde, MAN Ord., SAP, Siemens Reg.,ThyssenKrupp AG)Equity index futuresContracts purchased: EUR 738 188(Underlyings: DAX (performance index))Contracts sold: EUR 3 203 734(Underlyings: DAX (performance index), MDAX Performance Index)Option contractsOptions on equity index derivativesOptions on equity indicesPut options purchased: EUR 170 000(Underlyings: DAX (performance index))Securities loans (total transactions, at the value agreed at the closing of the loancontract)Value (’000)Perpetual EUR 915 713(Security description: Activa resources, adidas Reg., Adler Modemärkte, ADVAOptical Networking, Aixtron Reg., Allianz SE, Aurubis AG, AxelSpringer Vink. Reg., BASF Reg., Bauer, Bayer, Bijou Brigittemodische Accessoires, BMW Ord., Centrotherm Photovoltaics,CeWe Color Holding, Commerzbank, CTS EVENTIM, Daimler Reg.,Demag Cranes, Deutsche EuroShop Reg., Deutsche Lufthansa Vink.Reg., Deutsche Telekom Reg., Deutsche Wohnen, E.ON Reg.,ElringKlinger Reg., Eurofins Scientific, euromicron, Fielmann,Fraport AG Frankfurt Airport Services Worldwide, Fresenius MedicalCare, GEA Group, HAWESKO Holding, Henkel Pref., HighlightCommunications, Hochtief, Infineon Technologies Reg., K+S,Krones, KWS SAAT, Lanxess, Leoni Reg., Linde, M.A.X.Automation, MAN Ord., Merck, NORMA Group, Pfeiffer VacuumTechnology, Phoenix Solar, Porsche Automobil Holding Pref.,Porsche Automobil Holding Right on Pref., ProSiebenSat.1 MediaPref., PSI AG für Produkte und Systeme der Info. Tech., Q-Cells,Rational Ord., Rheinmetall Ord., Sartorius Pref., SFC Smart FuelCell, Siemens Reg., SMA Solar Technology, SolarWorld, SüdzuckerOrd., ThyssenKrupp AG, Tom Tailor Holding, TUI Reg., UnitedInternet Reg., VERBIO Vereinigte BioEnergie, Volkswagen Pref.,Vossloh, Wacker Chemie, Wincor Nixdorf)EquitiesAareal Bank (new) (DE000A1KRLA6) . . . . . . . . . . . . Count 108 377 108 37733
<strong>DWS</strong> Aktien Strategie <strong>Deutschland</strong>Statement of income and expenses (incl. income adjustment)Performance of the investment fund 2010/2011for the period from October 1, 2010, through September 30, 2011I. Income1. Dividends from domestic issuers . . . . . . . . . . . . . . . . . . EUR 19 555 388.612. Dividends from foreign issuers(before withholding tax) . . . . . . . . . . . . . . . . . . . . . . . . . EUR 18 425.563. Interest from investments of liquid assets in Germany . EUR 105 136.574. Income from securities lendingand repurchase agreements . . . . . . . . . . . . . . . . . . . . . . EUR 1 107 512.52including:from securities lending . . . . . . . . .EUR 1 107 512.525. Deduction for foreign withholding tax . . . . . . . . . . . . . . EUR -2 917.646. Other income . . . . . . . . . . . . . . . . . . . . . . . . . . . . . . . . . EUR 16 472.69Total income . . . . . . . . . . . . . . . . . . . . . . . . . . . . . . . . . . . . EUR 20 800 018.31II. Expenses1. Interest on borrowings . . . . . . . . . . . . . . . . . . . . . . . . . . EUR -4 222.492. Management fee . . . . . . . . . . . . . . . . . . . . . . . . . . . . . . EUR -14 194 561.68including:All-in fee . . . . . . . . . . . . . . . . . . . .EUR -14 194 561.683. Other expenses . . . . . . . . . . . . . . . . . . . . . . . . . . . . . . . EUR -553 756.24including:Performance-based fee fromsecurities lending income . . . . . .EUR -553 756.24Total expenses . . . . . . . . . . . . . . . . . . . . . . . . . . . . . . . . . . EUR -14 752 540.41III. Net investment income . . . . . . . . . . . . . . . . . . . . . . . . EUR 6 047 477.90IV. Sale transactionsRealized gains . . . . . . . . . . . . . . . . . . . . . . . . . . . . . . . . . . . . EUR 208 577 858.93Realized losses . . . . . . . . . . . . . . . . . . . . . . . . . . . . . . . . . . . EUR -179 561 110.30Capital gains/losses . . . . . . . . . . . . . . . . . . . . . . . . . . . . . . EUR 29 016 748.63V. Net gain/loss for the fiscal year . . . . . . . . . . . . . . . . . . EUR 35 064 226.53I. Value of the investment fund at the beginningof the fiscal year . . . . . . . . . . . . . . . . . . . . . . . . . . . . . . EUR 719 710 125.601. Previous year's distribution or tax abatement . . . . . . . . . EUR -837 930.932. Net inflows . . . . . . . . . . . . . . . . . . . . . . . . . . . . . . . . . . . EUR 166 428 758.36a) Inflows from subscriptions . . . . . . . . . . . . . . . . . . . . EUR 666 659 970.79b) Outflows from redemptions . . . . . . . . . . . . . . . . . . . EUR -500 231 212.433. Income adjustment and reimbursed expenses . . . . . . . . EUR -1 726 826.754. Net investment income . . . . . . . . . . . . . . . . . . . . . . . . . . EUR 6 047 477.905. Realized gains . . . . . . . . . . . . . . . . . . . . . . . . . . . . . . . . . EUR 208 577 858.936. Realized losses . . . . . . . . . . . . . . . . . . . . . . . . . . . . . . . . EUR -179 561 110.307. Net change in unrealized appreciation/depreciation . . . . EUR -149 854 470.56II. Value of the investment fund atthe end of the fiscal year . . . . . . . . . . . . . . . . . . . . . . . EUR 768 783 882.25Distribution policy of the investment fundTotalPer unitI. Calculation of distribution1. Net gain/loss for the fiscal year . . . . . . . . EUR 35 064 226.53 6.07II. Available for distribution . . . . . . . . . . . . EUR 35 064 226.53 6.071. Reinvested . . . . . . . . . . . . . . . . . . . . . . . . EUR -32 889 888.40 -5.69III. Total distribution . . . . . . . . . . . . . . . . . . EUR 2 174 338.13 0.381. Final distributiona) Withholding tax oncapital income withheld . . . . . . . . . . . . EUR 2 060 984.01 0.36b) Solidarity surcharge withheld . . . . . . . EUR 113 354.12 0.02Total expense ratio (in accordance with article 41 (2) of the InvGThe total expense ratio was 1.45% p.a. The TER expresses total expenses and fees(excluding transaction costs) as a percentage of the fund’s average net assets for a givenfiscal year.As well, the additional income from securities lending resulted in a performance-basedfee of 0.055% p.a. calculated on the fund’s average net assets.Information provided in accordance with article 41 (4) and (5) of the InvG (Costs and CostTransparency).In the fiscal year from October 1, 2010, through September 30, 2011, the investmentcompany, <strong>DWS</strong> Investment GmbH, was not reimbursed for the fees and expenses paidby <strong>DWS</strong> Aktien Strategie <strong>Deutschland</strong> to the Custodian and other third parties, except inthe form of financial information provided by brokers for research purposes.Changes in net assets and in the net asset value perunit over the last three yearsNet assetsat the end ofthe fiscal year EURNet assetvalue perunit EUR2011 . . . . . . . . . . . . . . . . . . . . . . . . . . . . . . . . . . . . 768 783 882.25 133.032010 . . . . . . . . . . . . . . . . . . . . . . . . . . . . . . . . . . . . 719 710 125.60 146.832009 . . . . . . . . . . . . . . . . . . . . . . . . . . . . . . . . . . . . 663 888 286.76 126.692008 . . . . . . . . . . . . . . . . . . . . . . . . . . . . . . . . . . . . 743 998 820.45 125.75An all-in fee of 1.45% per year is payable to the investment company under the Terms ofContract. Of this annual fee, the investment company in turn pays up to 0.15% to theCustodian and up to 0.05% to other parties (for printing and publication costs, auditing andother items). Of its own portion of the all-in fee, the investment company pays more than10% in commissions to distributors of the fund; the specific percentage paid is based onthe balance of units distributed.Transaction costsThe transaction costs paid in the reporting period amounted to EUR 4 845 606.40.The transaction costs include all costs that were reported or settled separately for theaccount of the fund in the reporting period and are directly connected to the purchase orsale of assets.Transactions processed for the account of the fund’s assets via closely related companies (based on major holdings of the Deutsche Bank Group)The share of transactions conducted for the account of the investment fund’s assets via brokers that are closely related companies and persons (share of five percent and above), amountedto 41.60 percent of all transactions. The total volume was EUR 657 271 627.37.34
Independentauditor’s reportKPMG issued an unqualified auditor's report forthe full annual report in accordance with article 44 (5)of the German Investment Act. The translation of theauditor's report is as follows:To <strong>DWS</strong> Investment GmbH, Frankfurt/Main, GermanyIn accordance with article 44 (5) of the German Investment Act (Investmentgesetz;InvG), <strong>DWS</strong> Investment GmbH commissioned us to perform the audit of the annualreport of the investment fund <strong>DWS</strong> Aktien Strategie <strong>Deutschland</strong> for the fiscal year fromOctober 1, 2010, through September 30, 2011.Responsibility of the legal representativesThe preparation of the annual report according to the provisions of the InvG is theresponsibility of the legal representatives of the investment company.Responsibility of the auditorsOur responsibility is to express an opinion on the annual report based on our audit.We conducted our audit in accordance with article 44 (5) InvG and generally acceptedGerman standards for the audit of financial statements promulgated by the Institut derWirtschaftsprüfer (Institute of Public Auditors in Germany; IDW). Those standardsrequire that we plan and perform the audit such that misstatements materially affectingthe annual report are detected with reasonable assurance. Knowledge of themanagement of the investment fund and expectations as to possible misstatementsare taken into account in the determination of audit procedures. The effectiveness ofthe accounting-related internal control system and the evidence supporting thedisclosures in the annual report are examined primarily on a test basis within theframework of the audit. The audit includes assessing the accounting principles usedfor the annual report and significant estimates made by the legal representatives ofthe investment company. In our view, our audit provides a reasonably secure basis forour evaluation.Audit opinionOur audit has not led to any reservations.In our opinion, based on the findings of our audit, the annual report complies with thelegal requirements.Frankfurt/Main, December 20, 2011KPMG AGWirtschaftsprüfungsgesellschaftHornschuWirtschaftsprüferNeufWirtschaftsprüfer35
2010The formatused for complete datesin securities descriptions in the investmentportfolio is “day/month/year”.Annual report<strong>DWS</strong> European Opportunities2011
<strong>DWS</strong> European OpportunitiesInvestment objective andperformance in the reporting period<strong>DWS</strong> European Opportunities investsin European small- and mid-caps. Thefocus is on companies with aboveaveragegrowth prospects, a sustainablebusiness model and solid balancesheet. The debt situation in the southernEuropean countries made the marketclimate increasingly difficult duringthe fiscal year. As a result, from thebeginning of October 2010, through<strong>DWS</strong> EUROPEAN OPPORTUNITIESFive-year performance145130115100857055409/06* 9/07 9/08 9/09 9/109/11<strong>DWS</strong> European Opportunities* 9/2006 = 100Data on euro basis“BVI method” performance, i.e., excluding the initial sales charge. Past performance is no guide to future results.As of: September 30, 2011the end of September 2011, the fundrecorded a decline of 14.6% per unit(BVI method). The portfolio, whichinvested according to the stock-pickingapproach, lay behind its benchmark(-11.6%), which consisted of 70%from the STOXX Europe Mid 200 indexand 30% from the STOXX EuropeSmall 200 index.<strong>DWS</strong> EUROPEAN OPPORTUNITIESvs. benchmarkPerformance at a glancein %24120-12-24-11.6-14.6-3.0+8.2-18.1Investment policy-36-481 year3 years-37.65 yearsin the reporting periodIn the opinion of the fund management,there was a substantial risk in the positionin Britain’s AZ Electronic Materials.There were concerns for a time that<strong>DWS</strong> European OpportunitiesBenchmark 70% STOXX EuropeMid 200, 30% STOXX Europe Small 200Data on euro basis“BVI method” performance, i.e., excluding theinitial sales charge. Past performance is no guideto future results.As of: September 30, 2011the key Japanese customers of thespecialty chemicals manufacturer andworld market leader of high-qualitychemicals for semi-conductor productionwould be forced to discontinueproduction as a result of the earthquake.The investment in Aareal Bank,which held southern European bonds,also represented a significant risk attimes. The reason for the underperformanceof the portfolio was the selectionof stocks with a more cyclical,economically sensitive character. Thisincluded equities of jewelry supplierPandora. The company's trading partnersreturned jewelry because of asteep drop in sales. This put considerablefinancial pressure on the company.For this reason, the stock was removedfrom the portfolio at a loss. The overweightingof the industrial sector alsodampened performance. The equitiesof FLSmidth & Co. recorded a particularlysteep decline. The world’s largestmanufacturer of cement plants, whichhas a strong presence in North Africa,had to significantly curtail its activities inthe region because of political changes.We also closed this position. The priceof Aixtron equities also dampenedthe performance of <strong>DWS</strong> EuropeanOpportunities. The manufacturer ofequipment to produce LEDs sawcompetition intensify as the result of anew generation of machines from itsAmerican competitor Veco. Demand inChina also fell because funding for LEDproducers was cut.38
The underweighting of the bankingsector was beneficial. The managementconcentrated here on selected northernEuropean institutions (Jyske Bank,Swedbank) with no investment insouthern Europe. Holdings in the technologysector were increased becauseindividual stocks here presentedpromising investment opportunities.Telecity made a comparatively goodcontribution to performance. TheBritish operator of data centers forfast Internet access profited from thedynamic development of data trafficand recorded strong growth. Thecompany has made a name for itself inthe area of outsourcing business-criticalIT systems. The company was able toconvince local authorities to providethe necessary infrastructure so that, forexample, the high power requirementsof data centers could be met. Towardsthe end of the reporting period, theliquidity of the portfolio was increasedat times because of the sharp rise inmarket turbulence.<strong>DWS</strong> EUROPEAN OPPORTUNITIES: Summary statement of assetsInvestment focus by sectorEquities 93.0% (September 30, 2011) / Equities 93.1% (September 30, 2010)FinancialsIndustrials16.917.516.425.6MaterialsInformation TechnologyConsumer Discretionary16.314.213.811.110.810.7Consumer Staples6.54.9Energy6.24.5Health Care6.14.6Cash and other assets7.06.90 5 10 15 20 25 30In % of the fund’s net assets in bondsas of September 30, 2011In % of the fund’s net assets in bondsas of September 30, 2010Security code: 847 415ISIN: DE0008474156As of: September 30, 2011Main sources of capital gains/lossesThe main sources of capital gains wereprofits realized on the sale of equities.Derivative transactions resulted inlosses.39
Annual report<strong>DWS</strong> European OpportunitiesInvestment portfolio – September 30, 2011Count/ Quantity/ Purchases/ Sales/ Market price Total market % ofDescription currency principal additions disposals value in net assets(– / ’000) amount in the reporting period EURSecurities traded on an exchange 405 569 334.65 91.61EquitiesHelvetia Holding Reg. (CH0012271687) . . . . . . . . . . . . . . Count 33 800 33 800 46 800 CHF 277.7500 7 695 980.90 1.74Sika (CH0000587979) . . . . . . . . . . . . . . . . . . . . . . . . . . . . Count 5 300 980 CHF 1 613.0000 7 008 151.00 1.58Sulzer Reg. (new) (CH0038388911) . . . . . . . . . . . . . . . . . Count 25 000 25 000 CHF 95.9000 1 965 403.97 0.44Christian Hansen Holding (DK0060227585) . . . . . . . . . . . Count 358 000 358 000 DKK 113.1000 5 440 997.81 1.23GN Store Nord (DK0010272632) . . . . . . . . . . . . . . . . . . . . Count 540 400 19 600 DKK 34.4800 2 503 891.56 0.57Jyske Bank (DK0010307958) . . . . . . . . . . . . . . . . . . . . . . Count 96 500 100 000 3 500 DKK 161.8000 2 098 160.71 0.47Aareal Bank (DE0005408116) . . . . . . . . . . . . . . . . . . . . . . Count 131 263 131 263 EUR 11.9000 1 562 029.70 0.35Aixtron Reg. (DE000A0WMPJ6) 3) . . . . . . . . . . . . . . . . . . Count 200 550 320 000 119 450 EUR 11.0950 2 225 102.25 0.50Andritz (AT0000730007) 3) . . . . . . . . . . . . . . . . . . . . . . . . Count 135 100 80 000 4 900 EUR 62.7200 8 473 472.00 1.91Brenntag (DE000A1DAHH0) . . . . . . . . . . . . . . . . . . . . . . . Count 81 890 84 840 2 950 EUR 65.0000 5 322 850.00 1.20Bull (FR0010266601) 3) . . . . . . . . . . . . . . . . . . . . . . . . . . . Count 700 000 700 000 EUR 3.2200 2 254 000.00 0.51Commerzbank (DE0008032004) . . . . . . . . . . . . . . . . . . . . Count 2 500 000 3 500 000 1 000 000 EUR 1.9420 4 855 000.00 1.10CompuGROUP Holding Ord. (DE0005437305) . . . . . . . . . Count 723 162 26 250 EUR 8.3250 6 020 323.65 1.36Deutsche EuroShop Reg. (DE0007480204) . . . . . . . . . . . Count 162 225 38 675 5 850 EUR 25.2000 4 088 070.00 0.92Diasorin (IT0003492391) . . . . . . . . . . . . . . . . . . . . . . . . . . Count 173 700 30 000 6 300 EUR 27.0500 4 698 585.00 1.06ElringKlinger Reg. (DE0007856023) . . . . . . . . . . . . . . . . . Count 163 180 169 080 5 900 EUR 17.5600 2 865 440.80 0.65Fielmann (DE0005772206) . . . . . . . . . . . . . . . . . . . . . . . . Count 87 850 3 150 EUR 74.5600 6 550 096.00 1.48Fresenius SE (DE0005785604) . . . . . . . . . . . . . . . . . . . . . Count 144 750 150 000 5 250 EUR 66.2000 9 582 450.00 2.16Hugo Boss Pref. (DE0005245534) . . . . . . . . . . . . . . . . . . Count 65 000 65 000 EUR 62.3600 4 053 400.00 0.92IMTECH (new) (NL0006055329) 3) . . . . . . . . . . . . . . . . . . Count 146 420 5 300 EUR 21.1650 3 098 979.30 0.70Ingenico (FR0000125346) . . . . . . . . . . . . . . . . . . . . . . . . . Count 214 798 7 800 EUR 28.0300 6 020 787.94 1.36KONE Cl.B (new) (FI0009013403) 3) . . . . . . . . . . . . . . . . . Count 216 800 153 200 EUR 35.8200 7 765 776.00 1.75Koninklijke DSM (NL0000009827) 3) . . . . . . . . . . . . . . . . Count 193 000 200 000 7 000 EUR 32.6250 6 296 625.00 1.42KWS SAAT (DE0007074007) . . . . . . . . . . . . . . . . . . . . . . . Count 45 000 13 700 6 100 EUR 141.4000 6 363 000.00 1.44Lanxess (DE0005470405) . . . . . . . . . . . . . . . . . . . . . . . . . Count 161 150 5 850 EUR 35.9450 5 792 536.75 1.31Lenzing (AT0000644505) . . . . . . . . . . . . . . . . . . . . . . . . . . Count 58 204 58 204 EUR 72.6600 4 229 102.64 0.96Mediobanca (IT0000062957) . . . . . . . . . . . . . . . . . . . . . . . Count 655 500 1 180 000 524 500 EUR 5.9250 3 883 837.50 0.88MTU Aero Engines Holding Reg. (DE000A0D9PT0) . . . . . Count 60 000 60 000 EUR 47.0000 2 820 000.00 0.64Nokian Renkaat (FI0009005318) 3) . . . . . . . . . . . . . . . . . . Count 200 000 103 000 EUR 22.5700 4 514 000.00 1.02NORMA Group (DE000A1H8BV3) . . . . . . . . . . . . . . . . . . Count 300 000 300 000 EUR 12.2000 3 660 000.00 0.83Nutreco Holding (NL0000375400) . . . . . . . . . . . . . . . . . . . Count 120 000 120 000 EUR 47.2450 5 669 400.00 1.28Obrascón Huarte Lain (ES0142090317) . . . . . . . . . . . . . . Count 140 000 280 000 140 000 EUR 18.4200 2 578 800.00 0.58ProSiebenSat.1 Media Pref. (DE0007771172) . . . . . . . . . Count 157 925 163 625 5 700 EUR 13.2650 2 094 875.13 0.47Recordati - Industria Chimica e Farmaceutica(IT0003828271) . . . . . . . . . . . . . . . . . . . . . . . . . . . . . . . . . Count 810 600 29 400 EUR 6.4550 5 232 423.00 1.18Rheinmetall Ord. (DE0007030009) . . . . . . . . . . . . . . . . . . Count 31 976 228 024 EUR 35.2700 1 127 793.52 0.25SCOR (FR0010411983) . . . . . . . . . . . . . . . . . . . . . . . . . . . Count 434 250 355 000 265 750 EUR 16.4550 7 145 583.75 1.61SEB (FR0000121709) 3) . . . . . . . . . . . . . . . . . . . . . . . . . . Count 101 350 105 000 3 650 EUR 60.2700 6 108 364.50 1.38Software (DE0003304002) . . . . . . . . . . . . . . . . . . . . . . . . Count 382 617 255 078 44 600 EUR 23.5850 9 024 021.95 2.04Technicolor (FR0010918292) 3) . . . . . . . . . . . . . . . . . . . . . Count 1 200 900 1 235 950 35 050 EUR 2.2310 2 679 207.90 0.61Technip (FR0000131708) 3) . . . . . . . . . . . . . . . . . . . . . . . Count 100 000 86 500 36 500 EUR 60.3500 6 035 000.00 1.36United Internet Reg. (DE0005089031) . . . . . . . . . . . . . . . Count 675 500 200 000 24 500 EUR 12.6800 8 565 340.00 1.93Valeo (FR0000130338) . . . . . . . . . . . . . . . . . . . . . . . . . . . Count 221 950 8 050 EUR 31.7700 7 051 351.50 1.59voestalpine (AT0000937503) . . . . . . . . . . . . . . . . . . . . . . . Count 80 000 80 000 EUR 21.7800 1 742 400.00 0.39African Barrick Gold (GB00B61D2N63) . . . . . . . . . . . . . . . Count 367 500 367 500 GBP 5.0273 2 127 020.77 0.48Aggreko (GB00B4WQ2Z29) . . . . . . . . . . . . . . . . . . . . . . . Count 256 968 256 968 GBP 16.3500 4 837 032.18 1.09ARM Holdings (GB0000595859) . . . . . . . . . . . . . . . . . . . . Count 549 200 1 080 000 530 800 GBP 5.5500 3 509 180.33 0.79Ashmore (GB00B132NW22) . . . . . . . . . . . . . . . . . . . . . . . Count 850 000 850 000 GBP 3.2790 3 208 799.03 0.72Associated British Foods (GB0006731235) . . . . . . . . . . . Count 190 000 190 000 GBP 11.0900 2 425 868.87 0.55AZ Electronic Materials (LU0552383324) . . . . . . . . . . . . . Count 3 000 000 3 053 000 53 000 GBP 2.1750 7 512 123.01 1.70Berkeley Group Holdings Units (GB00B02L3W35) . . . . . . Count 371 250 380 000 8 750 GBP 11.7000 5 000 742.58 1.13Burberry Group (GB0031743007) . . . . . . . . . . . . . . . . . . . Count 250 000 250 000 GBP 11.3200 3 258 131.51 0.74Centamin Egypt (AU000000CNT2) . . . . . . . . . . . . . . . . . . Count 1 843 400 1 843 400 GBP 0.9420 1 999 183.51 0.45Croda International (GB0002335270) . . . . . . . . . . . . . . . . Count 600 000 60 000 60 000 GBP 16.1900 11 183 565.20 2.53Icap (GB0033872168) . . . . . . . . . . . . . . . . . . . . . . . . . . . . Count 1 061 450 38 550 GBP 4.1320 5 049 426.20 1.14IG Group Holdings (GB00B06QFB75) . . . . . . . . . . . . . . . . Count 1 147 450 352 550 GBP 4.4320 5 854 848.97 1.32IMI (GB0004579636) . . . . . . . . . . . . . . . . . . . . . . . . . . . . . Count 500 000 500 000 GBP 7.0550 4 061 151.56 0.92Intertek Group (GB0031638363) . . . . . . . . . . . . . . . . . . . . Count 419 673 15 200 GBP 18.7000 9 035 138.43 2.04John Wood Group (GB00B5N0P849) . . . . . . . . . . . . . . . . Count 779 166 779 166 GBP 5.3450 4 794 682.76 1.08Kazakhmys (GB00B0HZPV38) . . . . . . . . . . . . . . . . . . . . . . Count 337 750 12 250 GBP 8.0000 3 110 767.26 0.70Lancashire Holdings (BMG5361W1047) . . . . . . . . . . . . . . Count 868 500 31 500 GBP 7.0750 7 074 218.05 1.60Old Mutual (GB0007389926) . . . . . . . . . . . . . . . . . . . . . . Count 1 929 900 2 000 000 70 100 GBP 1.0360 2 301 848.50 0.52Premier Oil (GB00B43G0577) . . . . . . . . . . . . . . . . . . . . . . Count 540 400 540 400 GBP 3.4950 2 174 426.32 0.49Randgold Resources (GB00B01C3S32) . . . . . . . . . . . . . . Count 126 000 126 000 169 299 GBP 61.2500 8 885 028.25 2.01Smiths Group (GB00B1WY2338) . . . . . . . . . . . . . . . . . . . Count 240 000 260 000 GBP 9.8450 2 720 251.99 0.61Spectris (GB0003308607) . . . . . . . . . . . . . . . . . . . . . . . . . Count 700 000 302 640 GBP 11.8000 9 509 599.40 2.15TeleCity Group (GB00B282YM11) . . . . . . . . . . . . . . . . . . . Count 2 181 700 650 000 68 300 GBP 5.5200 13 864 885.40 3.13Tullett Prebon (GB00B1H0DZ51) . . . . . . . . . . . . . . . . . . . Count 1 244 826 45 200 GBP 3.3810 4 845 470.98 1.09Wolseley (JE00B3YWCQ29) . . . . . . . . . . . . . . . . . . . . . . . Count 289 500 300 000 10 500 GBP 15.8600 5 286 082.37 1.19Algeta (NO0010239437) . . . . . . . . . . . . . . . . . . . . . . . . . . Count 230 000 230 000 NOK 174.5000 5 084 726.87 1.15Gjensidige Forsikring (NO0010582521) 3) . . . . . . . . . . . . Count 510 950 529 500 18 550 NOK 60.3000 3 903 373.21 0.8840
<strong>DWS</strong> European OpportunitiesCount/ Quantity/ Purchases/ Sales/ Market price Total market % ofDescription currency principal additions disposals value in net assets(– / ’000) amount in the reporting period EURSeaDrill (BMG7945E1057) . . . . . . . . . . . . . . . . . . . . . . . . Count 289 500 10 500 NOK 163.7000 6 004 012.80 1.36Subsea 7 (LU0075646355) . . . . . . . . . . . . . . . . . . . . . . . . Count 356 500 356 500 NOK 112.6000 5 085 601.03 1.15TGS Nopec Geophysical Co. (NO0003078800) 3) . . . . . . Count 230 000 230 000 NOK 110.2000 3 211 099.72 0.73Yara International (NO0010208051) . . . . . . . . . . . . . . . . . Count 221 950 230 000 328 050 NOK 240.4000 6 759 801.99 1.53Powszechny Zaklad Ubezpieczen(PLPZU0000011) . . . . . . . . . . . . . . . . . . . . . . . . . . . . . . . . Count 55 566 16 966 26 400 PLN 311.7000 3 900 582.93 0.88Autoliv SDR (SE0000382335) . . . . . . . . . . . . . . . . . . . . . . Count 103 800 159 200 SEK 336.2000 3 766 070.32 0.85Swedbank (SE0000242455) . . . . . . . . . . . . . . . . . . . . . . . Count 508 850 381 150 SEK 77.3000 4 244 852.80 0.96Swedish Match (SE0000310336) . . . . . . . . . . . . . . . . . . . Count 337 750 12 250 SEK 226.1000 8 241 177.77 1.86TAV Havalimanlari Holding (TRETAVH00018) . . . . . . . . . . Count 1 543 950 200 000 56 050 TRY 7.2600 4 455 603.27 1.01Tekfen Holding (TRETKHO00012) . . . . . . . . . . . . . . . . . . . Count 2 508 900 900 000 91 100 TRY 5.6000 5 584 805.34 1.26Etalon Group GDR Reg S (US29760G1031) . . . . . . . . . . . Count 1 102 940 1 102 940 USD 3.6000 2 935 541.44 0.66Securities that are admitted or included in organized markets 6 259 200.00 1.41EquitiesKerry Group (IE0004906560) . . . . . . . . . . . . . . . . . . . . . . . Count 240 000 240 000 EUR 26.0800 6 259 200.00 1.41Total securities portfolio 411 828 534.65 93.02DerivativesMinus signs denote short positionsEquity index derivatives 733 850.62 0.16(Receivables/payables)Equity index futuresDAX Index Future 12/2011 (EURX) EUR . . . . . . . . . . . . . . Count 3 750 733 850.62 0.17Cash and non-securitized money market instruments 28 506 651.17 6.44Cash at bank 28 506 651.17 6.44Demand deposits at CustodianEUR deposits . . . . . . . . . . . . . . . . . . . . . . . . . . . . . . . . . . EUR 14 243 773.05 % 100 14 243 773.05 3.22Deposits in other EU/EEA currencies . . . . . . . . . . . . . . . . EUR 10 466 956.29 % 100 10 466 956.29 2.36Deposits in non-EU/EEA currenciesSwiss franc . . . . . . . . . . . . . . . . . . . . . . . . . . . . . . . . . . . . CHF 4 130 016.01 % 100 3 385 672.52 0.76Turkish lira . . . . . . . . . . . . . . . . . . . . . . . . . . . . . . . . . . . . . TRY 728 174.10 % 100 289 448.89 0.07U.S. dollar . . . . . . . . . . . . . . . . . . . . . . . . . . . . . . . . . . . . . USD 163 268.62 % 100 120 708.14 0.03South African rand . . . . . . . . . . . . . . . . . . . . . . . . . . . . . . . ZAR 998.15 % 100 92.28 0.00Other assets 2 154 865.13 0.49Interest receivable . . . . . . . . . . . . . . . . . . . . . . . . . . . . . . EUR 13 179.70 % 100 13 179.70 0.00Dividends receivable . . . . . . . . . . . . . . . . . . . . . . . . . . . . . EUR 993 739.63 % 100 993 739.63 0.22Withholding tax claims . . . . . . . . . . . . . . . . . . . . . . . . . . . EUR 1 121 336.08 % 100 1 121 336.08 0.25Other receivables . . . . . . . . . . . . . . . . . . . . . . . . . . . . . . . EUR 26 609.72 % 100 26 609.72 0.01Receivables from share certificate transactions EUR 91 143.91 % 100 91 143.91 0.02Other liabilities -552 631.32 -0.12Liabilities from cost item . . . . . . . . . . . . . . . . . . . . . . . . . . EUR -539 326.43 % 100 -539 326.43 -0.12Additional other liabilities . . . . . . . . . . . . . . . . . . . . . . . . . EUR -13 304.89 % 100 -13 304.89 0.00Liabilities from share certificate transactions EUR -65 262.40 % 100 -65 262.40 -0.01Net assets 442 697 151.76 100.00Net asset value per unit 126.21Number of units outstanding 3 507 662.249Negligible rounding errors may have arisen due to the rounding of calculated percentages.41
<strong>DWS</strong> European OpportunitiesComposition of the reference portfolio (risk benchmark) (according to article 28 (3), of the Derivatives Regulation (DerivateV))70% Stoxx Mid 200 Price Index in EUR, 30% Stoxx - Small 200 Price IndexMarket risk exposure (value-at-risk) (according to article 28 (2), sentences 1 and 2, of the Derivatives Regulation (DerivateV))Lowest market risk exposure . . . . . . . . . . . . . . . . . . % 6.596Highest market risk exposure . . . . . . . . . . . . . . . . . . % 14.473Average market risk exposure . . . . . . . . . . . . . . . . . % 9.902The values-at-risk were calculated for the period from October 1, 2010, through September 30, 2011, using historical simulation with a 99% confidence level, a 10-day holding period andan effective historical observation period of one year. The risk in a reference portfolio that does not contain derivatives is used as the measurement benchmark. Market risk is the risk tothe fund from an unfavorable change in market prices. The investment company determines the potential market risk by means of the qualified approach as defined by the DerivativesRegulation.In the reporting period, the average leverage effect from the use of derivatives was 0.1, whereby the total of the nominal amounts of the derivates in relation to the fund’s assets wasused for the calculation (nominal value method).Market abbreviationsFutures exchangesEURX = Eurex (Eurex Frankfurt/Main / Eurex Zürich)Exchange rates (indirect quotes)As of September 30, 2011Swiss franc . . . . . . . . . . . . . . . . . . . . . CHF 1.219851 = EUR 1Danish krone . . . . . . . . . . . . . . . . . . . . DKK 7.441613 = EUR 1British pound . . . . . . . . . . . . . . . . . . . GBP 0.868596 = EUR 1Norwegian krone . . . . . . . . . . . . . . . . NOK 7.893246 = EUR 1Polish zloty . . . . . . . . . . . . . . . . . . . . . PLN 4.440342 = EUR 1Swedish krona . . . . . . . . . . . . . . . . . . SEK 9.266306 = EUR 1Turkish lira . . . . . . . . . . . . . . . . . . . . . . TRY 2.515726 = EUR 1U.S. dollar . . . . . . . . . . . . . . . . . . . . . USD 1.352590 = EUR 1South African rand . . . . . . . . . . . . . . . ZAR 10.816808 = EUR 1Notes on the valuationThe Custodian shall determine the value with the participation of the investment company. The Custodian generally bases its valuation on external sources.If no trading prices are available, prices are determined with the aid of valuation models (derived market values) which are agreed between the Custodian and the investment companyand which are based as far as possible on market parameters. This procedure is subject to an ongoing monitoring process. The plausibility of price information from third parties is checkedthrough other pricing sources, model calculations or other suitable procedure.Investments reported in this report are not valued at derived market values.Footnotes3) These securities were completely or partly transferred under securities loans. The equivalent value of the lent securities is EUR 22 183 312.91.42
<strong>DWS</strong> European OpportunitiesTransactions completed during the reporting period that no longer appear in the investment portfolioPurchases and sales of securities, investment fund units and promissory note loans (Schuldscheindarlehen); market classifications are as of the reporting dateDescriptionCount/currency(– / ’000)Purchases/additionsSales/disposalsDescriptionCount/currency(– / ’000)Purchases/additionsSales/disposalsSecurities traded on an exchangeUnlisted securitiesEquitiesAryzta Reg. (CH0043238366) . . . . . . . . . . . . . . . . . . Count 15 000 100 000Clariant Reg. (CH0012142631) . . . . . . . . . . . . . . . . . Count 870 000 870 000Dufry Reg. (CH0023405456) . . . . . . . . . . . . . . . . . . Count 30 000 30 000Gategroup Holding Reg. (CH0100185955) . . . . . . . . Count 170 000 170 000Sonova Holding Reg. (CH0012549785) . . . . . . . . . . Count 13 000 43 000Dampskibsselskabet Norden Bear.(DK0060083210) . . . . . . . . . . . . . . . . . . . . . . . . . . . . Count 350 000FLSmidth & Co. B (DK0010234467) . . . . . . . . . . . . . Count 100 000 180 000Pandora (DK0060252690) . . . . . . . . . . . . . . . . . . . . . Count 430 000 430 000Banca Popolare di Milano (IT0000064482) . . . . . . . . Count 700 000 2 200 000Comp. Générale de Géophysique-Veritas(FR0000120164) . . . . . . . . . . . . . . . . . . . . . . . . . . . . Count 250 000 250 000Daimler Reg. (DE0007100000) . . . . . . . . . . . . . . . . . Count 43 665 43 665Ebro Puleva Reg. (ES0112501012) . . . . . . . . . . . . . . Count 180 000 180 000Euler Hermes Reg. (FR0004254035) . . . . . . . . . . . . Count 45 000Fresenius SE Pref. (DE0005785638) . . . . . . . . . . . . Count 150 000Hochtief (DE0006070006) . . . . . . . . . . . . . . . . . . . . Count 100 000KBC Ancora (BE0003867844) . . . . . . . . . . . . . . . . . . Count 160 000Koninklijke Boskalis Westminster CVA (new)(NL0000852580) . . . . . . . . . . . . . . . . . . . . . . . . . . . . Count 243 700Lagardère Reg. (FR0000130213) . . . . . . . . . . . . . . . Count 210 000 210 000Leoni Reg. (DE0005408884) . . . . . . . . . . . . . . . . . . . Count 156 193Outotec (FI0009014575) . . . . . . . . . . . . . . . . . . . . . . Count 140 000Palfinger (AT0000758305) . . . . . . . . . . . . . . . . . . . . . Count 140 000 140 000Prosegur - Cía de Seguridad Reg. (ES0175438235) . Count 61 500 221 000Salzgitter (DE0006202005) . . . . . . . . . . . . . . . . . . . . Count 70 000 70 000Sampo Bear. A (FI0009003305) . . . . . . . . . . . . . . . . Count 400 000Tecnicas Reunidas & Westinghouse(ES0178165017) . . . . . . . . . . . . . . . . . . . . . . . . . . . . Count 254 000Tod’s (IT0003007728) . . . . . . . . . . . . . . . . . . . . . . . . Count 70 000 70 000Vienna Insurance Group (AT0000908504) . . . . . . . . Count 110 000Wacker Chemie (DE000WCH8881) . . . . . . . . . . . . . Count 19 000 114 000YIT OYJ (FI0009800643) . . . . . . . . . . . . . . . . . . . . . . Count 534 109Aggreko (GB0001478998) . . . . . . . . . . . . . . . . . . . . Count 200 000 200 000Antofagasta (GB0000456144) . . . . . . . . . . . . . . . . . . Count 150 000 400 000Autonomy Corp. (GB0055007982) . . . . . . . . . . . . . . Count 700 000 700 000AZ Electronic Materials (LU055238332X) . . . . . . . . . Count 1 512 120 1 512 120Cairn Energy (GB00B59MW615) . . . . . . . . . . . . . . . Count 450 000Carillion (GB0007365546) . . . . . . . . . . . . . . . . . . . . . Count 1 910 000Enterprise Inns (GB00B1L8B624) . . . . . . . . . . . . . . . Count 1 400 000John Wood Group (GB0031575839) . . . . . . . . . . . . Count 785 000 785 000Legal & General Group (GB0005603997) . . . . . . . . . Count 5 250 000Lonmin (GB0031192486) . . . . . . . . . . . . . . . . . . . . . Count 300 000Persimmon (GB0006825383) . . . . . . . . . . . . . . . . . . Count 1 000 000Premier Farnell (GB0003318416) . . . . . . . . . . . . . . . Count 700 000 2 500 000Premier Oil (GB0033560011) . . . . . . . . . . . . . . . . . . Count 140 000Serco Group (GB0007973794) . . . . . . . . . . . . . . . . . Count 600 669TUI Travel (GB00B1Z7RQ77) . . . . . . . . . . . . . . . . . . Count 3 600 000 3 600 000Wolseley (new) (GB00B5ZN3P43) . . . . . . . . . . . . . . Count 490 000EquitiesAareal Bank (new) (DE000A1KRLA6) . . . . . . . . . . . . Count 31 263 31 263Derivatives (option premiums realized in opening transactions, or total optionstransactions; in the case of warrants, purchases and sales are shown)Futures contractsValue (’000)Equity index futuresContracts purchased: EUR 47 516(Underlyings: DAX (performance index))Option contractsOptions on equity index derivativesOptions on equity indicesPut options purchased: EUR 47 250(Underlyings: DAX (performance index))Securities loans (total transactions, at the value agreed at the closing of the loancontract)Value (’000)Perpetual EUR 563 548(Security description: Aixtron Reg., Andritz, Antofagasta, Autoliv SDR,Autonomy Corp., Banca Popolare di Milano, Bull, ClariantReg., Comp. Générale de Géophysique-Veritas, CompuGROUPHolding Ord., Dampskibsselskabet Norden Bear., DeutscheEuroShop Reg., Diasorin, Dufry Reg., Electrolux B, Fielmann,FLSmidth & Co. B, Fresenius SE, Gjensidige Forsikring,GN Store Nord, IMTECH (new), Ingenico, KONE Cl.B (new),Koninklijke Boskalis Westminster CVA (new), KWS SAAT,Lanxess, Leoni Reg., Marine Harvest, Mediobanca, NokianRenkaat, Oriflame Cosmetics SDR, Outotec, Pandora,Petroleum Geo-Services (new), Premier Farnell, Recordati -Industria Chimica e Farmaceutica, Rezidor Hotel Group,Rheinmetall Ord., Salzgitter, Sampo Bear. A, SCOR, SeaDrill,SEB, Sika, Skandinaviska Enskilda Banken A (Free), Skanska B(Free), Sonova Holding Reg., Subsea 7. Swedbank, SwedishMatch, Technicolor, Technip, Tecnicas Reunidas & Westinghouse,Tekfen Holding, TGS Nopec Geophysical Co., United Internet Reg.,Valeo, Vienna Insurance Group, voestalpine, Wacker Chemie,Yara International, YIT OYJ)Marine Harvest (NO0003054108) . . . . . . . . . . . . . . . Count 12 500 000Petroleum Geo-Services (new) (NO0010199151) . . Count 940 000 940 000Warsaw Stock Exchange (PLGPW0000017) . . . . . . Count 28 570 28 570Ångpanneföreningen B (Free) (SE0000115578) . . . . Count 284 332Electrolux B (SE0000103814) . . . . . . . . . . . . . . . . . . Count 629 000Oriflame Cosmetics SDR (SE0001174889) . . . . . . . Count 120 000 220 000Rezidor Hotel Group (SE0001857533) . . . . . . . . . . . Count 700 000Skandinaviska Enskilda Banken A (Free)(SE0000148884) . . . . . . . . . . . . . . . . . . . . . . . . . . . . Count 675 000Skanska B (Free) (SE0000113250) . . . . . . . . . . . . . . Count 505 00043
<strong>DWS</strong> European OpportunitiesStatement of income and expenses (incl. income adjustment)Performance of the investment fund 2010/2011for the period from October 1, 2010, through September 30, 2011I. Income1. Dividends from domestic issuers . . . . . . . . . . . . . . . . . . EUR 3 035 036.802. Dividends from foreign issuers(before withholding tax) . . . . . . . . . . . . . . . . . . . . . . . . . EUR 8 237 338.233. Interest from investments of liquid assets in Germany . EUR 126 453.874. Income from securities lendingand repurchase agreements . . . . . . . . . . . . . . . . . . . . . . EUR 1 176 768.96including:from securities lending . . . . . . . . .EUR 1 176 768.965. Abzug ausländischer Quellensteuer *) . . . . . . . . . . . . . . EUR 257 382.936. Other income . . . . . . . . . . . . . . . . . . . . . . . . . . . . . . . . . EUR 2 677 604.38including:Compensation payments . . . . . . .EUR 2 667 216.73Other . . . . . . . . . . . . . . . . . . . . . . .EUR 10 387.65Total income . . . . . . . . . . . . . . . . . . . . . . . . . . . . . . . . . . . . EUR 15 510 585.17II. Expenses1. Interest on borrowings . . . . . . . . . . . . . . . . . . . . . . . . . . EUR -107.362. Management fee . . . . . . . . . . . . . . . . . . . . . . . . . . . . . . EUR -7 659 395.80including:All-in fee . . . . . . . . . . . . . . . . . . . .EUR -7 659 395.803. Other expenses . . . . . . . . . . . . . . . . . . . . . . . . . . . . . . . EUR -590 850.76including:Performance-based fee fromsecurities lending income . . . . . . .EUR -588 384.50Legal expenses . . . . . . . . . . . . . . .EUR -2 234.75Other . . . . . . . . . . . . . . . . . . . . . . .EUR -231.51Total expenses . . . . . . . . . . . . . . . . . . . . . . . . . . . . . . . . . . EUR -8 250 353.92III. Net investment income . . . . . . . . . . . . . . . . . . . . . . . . EUR 7 260 231.25IV. Sale transactionsRealized gains . . . . . . . . . . . . . . . . . . . . . . . . . . . . . . . . . . . . EUR 61 271 071.14Realized losses . . . . . . . . . . . . . . . . . . . . . . . . . . . . . . . . . . . EUR -46 172 591.22Capital gains/losses . . . . . . . . . . . . . . . . . . . . . . . . . . . . . . EUR 15 098 479.92V. Net gain/loss for the fiscal year . . . . . . . . . . . . . . . . . . EUR 22 358 711.17I. Value of the investment fund at the beginningof the fiscal year . . . . . . . . . . . . . . . . . . . . . . . . . . . . . . EUR 545 874 925.271. Previous year's distribution or tax abatement . . . . . . . . . EUR -4 886 549.232. Net inflows . . . . . . . . . . . . . . . . . . . . . . . . . . . . . . . . . . . EUR -15 568 783.59a) Inflows from subscriptions . . . . . . . . . . . . . . . . . . . . EUR 1 146 967 425.84b) Outflows from redemptions . . . . . . . . . . . . . . . . . . . EUR -1 162 536 209.433. Income adjustment and reimbursed expenses . . . . . . . . EUR 2 622 375.084. Net investment income . . . . . . . . . . . . . . . . . . . . . . . . . . EUR 7 260 231.255. Realized gains . . . . . . . . . . . . . . . . . . . . . . . . . . . . . . . . . EUR 61 271 071.146. Realized losses . . . . . . . . . . . . . . . . . . . . . . . . . . . . . . . . EUR -46 172 591.227. Net change in unrealized appreciation/depreciation . . . . EUR -107 703 526.94II. Value of the investment fund atthe end of the fiscal year . . . . . . . . . . . . . . . . . . . . . . . EUR 442 697 151.76Distribution policy of the investment fundTotalPer unitI. Calculation of distribution1. Balance brought forwardfrom previous year . . . . . . . . . . . . . . . . . . EUR 64 587 551.69 18.412. Net gain/loss for the fiscal year . . . . . . . . EUR 22 358 711.17 6.38II. Available for distribution . . . . . . . . . . . . EUR 86 946 262.86 24.791. Reinvested . . . . . . . . . . . . . . . . . . . . . . . . EUR -13 280 829.24 -3.792. Balance carried forward . . . . . . . . . . . . . . EUR -66 404 572.76 -18.93III. Total distribution . . . . . . . . . . . . . . . . . . EUR 7 260 860.86 2.071. Final distributiona) Cash distribution . . . . . . . . . . . . . . . . . EUR 6 924 451.99 1.98b) Withholding tax oncapital income withheld . . . . . . . . . . . . EUR 318 870.97 0.09c) Solidarity surcharge withheld . . . . . . . . EUR 17 537.90 0.00*) Includes withholding tax refunds from previous years.BVI total expense ratio (TER)The total expense ratio was 1.40% p.a. The TER expresses total expenses and fees(excluding transaction costs) as a percentage of the fund’s average net assets for a givenfiscal year.As well, the additional income from securities lending resulted in a performance-basedfee of 0.108% p.a. calculated on the fund’s average net assets.Information provided in accordance with article 41 (4) and (5) of the InvG (Costs and CostTransparency).In the fiscal year from October 1, 2010, through September 30, 2011, the investmentcompany, <strong>DWS</strong> Investment GmbH, was not reimbursed for the fees and expenses paidby <strong>DWS</strong> European Opportunities to the Custodian and other third parties, except in theform of financial information provided by brokers for research purposes.Changes in net assets and in the net asset value perunit over the last three yearsNet assetsat the end ofthe fiscal year EUREURNet assetvalue perunit2011 . . . . . . . . . . . . . . . . . . . . . . . . . . . . . . . . . . . . . 442 697 151.76 126.212010 . . . . . . . . . . . . . . . . . . . . . . . . . . . . . . . . . . . . . 545 874 925.27 149.142009 . . . . . . . . . . . . . . . . . . . . . . . . . . . . . . . . . . . . . 433 232 165.08 133.702008 . . . . . . . . . . . . . . . . . . . . . . . . . . . . . . . . . . . . . 407 119 052.15 137.13An all-in fee of 1.40% per year is payable to the investment company under the Terms ofContract. Of this annual fee, the investment company in turn pays up to 0.15% to theCustodian and up to 0.05% to other parties (for printing and publication costs, auditing andother items). Of its own portion of the all-in fee, the investment company pays more than10% in commissions to distributors of the fund; the specific percentage paid is based onthe balance of units distributed.Transaction costsThe transaction costs paid in the reporting period amounted to EUR 1 913 276.69.The transaction costs include all costs that were reported or settled separately for theaccount of the fund in the reporting period and are directly connected to the purchase orsale of assets.44Transactions processed for the account of the fund’s assets via closely related companies (based on major holdings of the Deutsche Bank Group)The share of transactions conducted for the account of the investment fund’s assets via brokers that are closely related companies and persons (share of five percent and above), amountedto 6.99 percent of all transactions. The total volume was EUR 65 416 398.05.
Independentauditor’s reportKPMG issued an unqualified auditor's report forthe full annual report in accordance with article 44 (5)of the German Investment Act. The translation of theauditor's report is as follows:To <strong>DWS</strong> Investment GmbH, Frankfurt/Main, GermanyIn accordance with article 44 (5) of the German Investment Act (Investmentgesetz;InvG), <strong>DWS</strong> Investment GmbH commissioned us to perform the audit of the annualreport of the investment fund <strong>DWS</strong> European Opportunities for the fiscal year fromOctober 1, 2010, through September 30, 2011.Responsibility of the legal representativesThe preparation of the annual report according to the provisions of the InvG is theresponsibility of the legal representatives of the investment company.Responsibility of the auditorsOur responsibility is to express an opinion on the annual report based on our audit.We conducted our audit in accordance with article 44 (5) InvG and generally acceptedGerman standards for the audit of financial statements promulgated by the Institut derWirtschaftsprüfer (Institute of Public Auditors in Germany; IDW). Those standardsrequire that we plan and perform the audit such that misstatements materially affectingthe annual report are detected with reasonable assurance. Knowledge of themanagement of the investment fund and expectations as to possible misstatementsare taken into account in the determination of audit procedures. The effectiveness ofthe accounting-related internal control system and the evidence supporting thedisclosures in the annual report are examined primarily on a test basis within theframework of the audit. The audit includes assessing the accounting principles usedfor the annual report and significant estimates made by the legal representatives ofthe investment company. In our view, our audit provides a reasonably secure basis forour evaluation.Audit opinionOur audit has not led to any reservations.In our opinion, based on the findings of our audit, the annual report complies with thelegal requirements.Frankfurt/Main, December 20, 2011KPMG AGWirtschaftsprüfungsgesellschaftHornschuWirtschaftsprüferNeufWirtschaftsprüfer45
2010The formatused for complete datesin securities descriptions in the investmentportfolio is “day/month/year”.Annual report<strong>DWS</strong> Eurovesta2011
<strong>DWS</strong> EurovestaInvestment objective andperformance in the reporting periodThe investment result of <strong>DWS</strong>Eurovesta was also hurt by the steepprice declines resulting from the intensificationof the debt crisis in Europe.The fund, which invests in Europeanblue chips, recorded a drop of 19.1%per unit (BVI method) during the12 months through the end of September2011. This placed it ahead of itsbenchmark, the MSCI Europe (since<strong>DWS</strong> EUROVESTAFive-year performance145130115100857055409/06* 9/07 9/08 9/09 9/109/11<strong>DWS</strong> Eurovesta* 9/2006 = 100Data on euro basis“BVI method” performance, i.e., excluding the initial sales charge. Past performance is no guide to future results.As of: September 30, 2011March 1, 2011, previously STOXXEurope 50), which fell 11.2%.Investment policyin the reporting period<strong>DWS</strong> EUROVESTA vs. benchmarkPerformance at a glancein %The underperformance was attributable0primarily to the insufficient weighting ofpurely defensive sectors. This includedstocks in non-cyclical consumer goods-6-12-18-24-19.1-11.2-10.4 -10.3such as food, beverage and tobacco.Companies in the tobacco segment, for-30-361 year3 years-29.0-31.15 yearsexample, had a solid cost structure,were able to afford expensive acquisitionsand their attractive dividends allowedtheir shareholders to participatein the success of the companies. The<strong>DWS</strong> EurovestaBenchmark MSCI Europe sinceMarch 1, 2011(previously: STOXX Europe 50)Data on euro basis“BVI method” performance, i.e., excluding theinitial sales charge. Past performance is no guideto future results.As of: September 30, 2011weighting of pharmaceutical stocks wasalso too low. Investors focused on thissegment because of its defensive characterand its stronger orientation towardshareholder value and cash flow generation.Holdings in Bayer were increasedfor a time; however, the performance ofits equity price was weaker than the industryaverage because of a delay in theapproval of a new medication. Purchasesof GlaxoSmithKline and Roche werethen made after their stock prices fell48
sharply because of the significant marketweakness.At the regional level, the fact that theweighting of the United Kingdom wasbelow the benchmark level dampenedperformance. With the country outsidethe euro area, prices in the British equitymarkets did not decline as steeply.During the fiscal year <strong>DWS</strong> Eurovestaincreased holdings here somewhat andadded British American Tobacco for atime. Aggreko was also added to theportfolio; the provider of rental powergenerators was active globally and hada leading market position particularly incountries with strong fluctuations inthe power supply. Investments in thebanking sector were reduced early on;in the view of the fund managementno significant risk existed even towardsthe end of the reporting period as thedebt crisis intensified. Instead the focusshifted to insurers (Allianz, Sampo) andasset managers (Ashmore) because oftheir better visibility.<strong>DWS</strong> EUROVESTA: Summary statement of assetsInvestment focus by sectorEquities 93.9% (September 30, 2011) / Equities 89.9% (September 30, 2010)Financials15.518.3Industrials13.715.2Energy5.912.7Consumer Discretionary4.711.7Materials10.613.4Health Care10.410.2Consumer Staples10.012.3Telecommunication Services4.93.4Information Technology2.44.7Utilities2.01.8Certificates2.42.6Cash and other assets3.77.50 3 6 9 12 15 18 21In % of the fund’s net assetsas of Sptember 30, 201In % of the fund’s net assetsas of Sptember 30, 2010Security code: 849 084ISIN: DE0008490848As of: September 30, 2011Main sources of capital gains/lossesThe main sources of capital gains wereprofits realized on the sale of equities.49
Annual report<strong>DWS</strong> EurovestaInvestment portfolio – September 30, 2011Count/ Quantity/ Purchases/ Sales/ Market price Total market % ofDescription currency principal additions disposals value in net assets(– / ’000) amount in the reporting period EURSecurities traded on an exchange 543 325 181.21 96.29EquitiesABB Reg. (CH0012221716) . . . . . . . . . . . . . . . . . . . . . . . . Count 562 114 1 909 831 1 347 717 CHF 15.6900 7 230 037.65 1.28Nestlé Reg. (CH0038863350) . . . . . . . . . . . . . . . . . . . . . . Count 640 751 742 249 301 498 CHF 49.8100 26 163 693.20 4.64Sulzer Reg. (new) (CH0038388911) . . . . . . . . . . . . . . . . . Count 52 377 52 377 105 000 CHF 95.9000 4 117 678.55 0.73The Swatch Group (CH0012255151) . . . . . . . . . . . . . . . . Count 31 022 51 330 70 308 CHF 303.6000 7 720 843.94 1.37Novo-Nordisk B (DK0060102614) . . . . . . . . . . . . . . . . . . . Count 104 653 104 653 DKK 554.0000 7 791 020.84 1.38adidas Reg. (DE000A1EWWW0) . . . . . . . . . . . . . . . . . . . Count 232 847 358 833 125 986 EUR 44.9500 10 466 472.65 1.85Alcatel-Lucent (FR0000130007) . . . . . . . . . . . . . . . . . . . . Count 1 193 643 2 592 022 1 398 379 EUR 2.2310 2 663 017.53 0.47Allianz SE (DE0008404005) . . . . . . . . . . . . . . . . . . . . . . . . Count 131 385 170 545 239 160 EUR 69.7100 9 158 848.35 1.62BASF Reg. (DE000BASF111) . . . . . . . . . . . . . . . . . . . . . . Count 163 136 424 906 261 770 EUR 45.9950 7 503 440.32 1.33Bayer (DE000BAY0017) . . . . . . . . . . . . . . . . . . . . . . . . . . Count 200 242 109 099 227 857 EUR 41.5050 8 311 044.21 1.47BMW Ord. (DE0005190003) . . . . . . . . . . . . . . . . . . . . . . . Count 216 433 376 457 160 024 EUR 49.0000 10 605 217.00 1.88Compagnie de Saint-Gobain (C.R.) (FR0000125007) . . . . Count 248 853 181 147 EUR 28.5800 7 112 218.74 1.26Continental (DE0005439004) . . . . . . . . . . . . . . . . . . . . . . Count 100 000 211 796 331 796 EUR 43.7800 4 378 000.00 0.78Daimler Reg. (DE0007100000) . . . . . . . . . . . . . . . . . . . . . Count 273 366 432 797 159 431 EUR 33.3450 9 115 389.27 1.62Essilor International (FR0000121667) 3) . . . . . . . . . . . . . . Count 174 363 64 363 110 000 EUR 53.8300 9 385 960.29 1.66Fortum (FI0009007132) . . . . . . . . . . . . . . . . . . . . . . . . . . . Count 398 955 150 387 351 432 EUR 17.7600 7 085 440.80 1.26Fresenius SE (DE0005785604) . . . . . . . . . . . . . . . . . . . . . Count 150 962 150 962 EUR 66.2000 9 993 684.40 1.77Galp Energia SGPS (PTGAL0AM0009) . . . . . . . . . . . . . . . Count 386 125 386 125 EUR 13.5400 5 228 132.50 0.93Groupe Danone (C.R.) (FR0000120644) . . . . . . . . . . . . . . Count 158 654 279 917 121 263 EUR 45.6450 7 241 761.83 1.28Henkel Pref. (DE0006048432) 3) . . . . . . . . . . . . . . . . . . . Count 303 200 380 805 77 605 EUR 39.2300 11 894 536.00 2.11ING Groep CVA (NL0000303600) . . . . . . . . . . . . . . . . . . . Count 2 462 099 2 327 108 3 065 009 EUR 5.4110 13 322 417.69 2.36Koninklijke DSM (NL0000009827) . . . . . . . . . . . . . . . . . . Count 302 081 343 255 41 174 EUR 32.6250 9 855 392.63 1.75Lenzing (AT0000644505) 3) . . . . . . . . . . . . . . . . . . . . . . . . Count 81 755 81 755 EUR 72.6600 5 940 318.30 1.05Linde (DE0006483001) . . . . . . . . . . . . . . . . . . . . . . . . . . . Count 170 233 170 233 EUR 101.6000 17 295 672.80 3.07LVMH Moët Hennessy Louis Vuitton (C.R.)(FR0000121014) . . . . . . . . . . . . . . . . . . . . . . . . . . . . . . . . Count 146 090 146 090 EUR 98.4100 14 376 716.90 2.55MAN Ord. (DE0005937007) . . . . . . . . . . . . . . . . . . . . . . . Count 113 662 233 559 119 897 EUR 59.2000 6 728 790.40 1.19Porsche Automobil Holding Pref. (DE000PAH0038) . . . . . Count 50 000 279 077 229 077 EUR 35.7850 1 789 250.00 0.32Repsol YPF (ES0173516115) . . . . . . . . . . . . . . . . . . . . . . Count 737 597 852 458 114 861 EUR 19.8300 14 626 548.51 2.59Safran (FR0000073272) . . . . . . . . . . . . . . . . . . . . . . . . . . . Count 290 000 429 345 139 345 EUR 23.5200 6 820 800.00 1.21Saipem (IT0000068525) . . . . . . . . . . . . . . . . . . . . . . . . . . Count 449 948 461 058 311 110 EUR 26.4900 11 919 122.52 2.11Sampo Bear. A (FI0009003305) . . . . . . . . . . . . . . . . . . . . Count 500 377 978 956 478 579 EUR 18.9900 9 502 159.23 1.68SAP (DE0007164600) . . . . . . . . . . . . . . . . . . . . . . . . . . . . Count 290 000 289 706 224 706 EUR 37.9650 11 009 850.00 1.95Schneider Electric (FR0000121972) 3) . . . . . . . . . . . . . . . Count 212 297 381 110 168 813 EUR 40.3550 8 567 245.44 1.52SES Cl.A FDR (LU0088087324) . . . . . . . . . . . . . . . . . . . . Count 440 000 511 040 71 040 EUR 17.6600 7 770 400.00 1.38Siemens Reg. (DE0007236101) . . . . . . . . . . . . . . . . . . . . Count 175 794 229 794 154 000 EUR 67.4200 11 852 031.48 2.10Telefonica (ES0178430E18) . . . . . . . . . . . . . . . . . . . . . . . . Count 334 390 874 223 1 139 833 EUR 14.2800 4 775 089.20 0.85VINCI (FR0000125486) 3) . . . . . . . . . . . . . . . . . . . . . . . . . Count 216 078 394 242 578 164 EUR 32.0050 6 915 576.39 1.23Aggreko (GB00B4WQ2Z29) . . . . . . . . . . . . . . . . . . . . . . . Count 469 084 469 084 GBP 16.3500 8 829 793.60 1.56Ashmore (GB00B132NW22) . . . . . . . . . . . . . . . . . . . . . . . Count 1 627 668 1 905 167 277 499 GBP 3.2790 6 144 540.58 1.09BG Group (GB0008762899) . . . . . . . . . . . . . . . . . . . . . . . Count 1 180 160 1 422 556 242 396 GBP 12.2800 16 684 816.42 2.96British American Tobacco (BAT) (GB0002875804) . . . . . . Count 352 264 552 264 900 000 GBP 27.3850 11 106 140.99 1.97GlaxoSmithkline (GB0009252882) . . . . . . . . . . . . . . . . . . Count 753 891 753 891 GBP 13.2268 11 480 052.61 2.03HSBC Holdings (GB0005405286) . . . . . . . . . . . . . . . . . . . Count 1 594 314 6 462 987 4 868 673 GBP 4.9200 9 030 694.22 1.60Legal & General Group (GB0005603997) . . . . . . . . . . . . . Count 10 741 096 10 741 096 GBP 0.9708 12 005 449.76 2.13Old Mutual (GB0007389926) . . . . . . . . . . . . . . . . . . . . . . Count 4 000 000 6 283 719 2 283 719 GBP 1.0360 4 770 917.66 0.85Rio Tinto (GB0007188757) . . . . . . . . . . . . . . . . . . . . . . . . Count 141 700 272 926 831 226 GBP 28.8850 4 712 207.40 0.84Royal Dutch Shell Cl. A (GB00B03MLX29) . . . . . . . . . . . . Count 959 759 1 809 759 850 000 GBP 19.8900 21 977 543.66 3.90Scottish and Southern Energy (GB0007908733) . . . . . . . Count 298 716 298 716 GBP 12.8200 4 408 884.13 0.78Standard Chartered (GB0004082847) . . . . . . . . . . . . . . . . Count 354 816 691 666 336 850 GBP 12.9200 5 277 738.70 0.94Vodafone Group (GB00B16GWD56) . . . . . . . . . . . . . . . . . Count 11 954 230 22 816 859 10 862 629 GBP 1.6560 22 791 038.50 4.04Xstrata (GB0031411001) . . . . . . . . . . . . . . . . . . . . . . . . . . Count 900 000 375 541 1 975 541 GBP 8.2010 8 497 506.32 1.51DnB NOR A (NO0010031479) . . . . . . . . . . . . . . . . . . . . . Count 1 253 753 1 478 557 224 804 NOK 58.6000 9 307 948.31 1.65Subsea 7 (LU0075646355) . . . . . . . . . . . . . . . . . . . . . . . . Count 93 037 100 000 606 963 NOK 112.6000 1 327 206.35 0.24Yara International (NO0010208051) . . . . . . . . . . . . . . . . . Count 191 195 270 303 279 108 NOK 240.4000 5 823 114.85 1.03Atlas Copco A (Free) (SE0000101032) 3) . . . . . . . . . . . . . Count 665 211 1 205 239 540 028 SEK 123.7000 8 880 194.62 1.57Nordea Bank (SE0000427361) . . . . . . . . . . . . . . . . . . . . . Count 1 463 862 2 505 932 1 042 070 SEK 56.2500 8 886 198.83 1.57Certificates<strong>DWS</strong> GO UK Best Picks TR Index Certificate(DE000<strong>DWS</strong>0J62) . . . . . . . . . . . . . . . . . . . . . . . . . . . . . . . Count 251 000 99 000 EUR 53.4750 13 422 225.00 2.38Other equity securitiesRoche Holding Profitsh. (CH0012032048) . . . . . . . . . . . . Count 97 581 293 564 195 983 CHF 146.6000 11 727 149.14 2.08Total securities portfolio 543 325 181.21 96.2950
<strong>DWS</strong> EurovestaCount/ Quantity/ Purchases/ Sales/ Market price Total market % ofDescription currency principal additions disposals value in net assets(– / ’000) amount in the reporting period EURCash and non-securitized money market instruments 22 946 244.62 4.07Cash at bank 22 946 244.62 4.07Demand deposits at CustodianDeposits in other EU/EEA currencies . . . . . . . . . . . . . . . . EUR 20 693 872.98 % 100 20 693 872.98 3.67Deposits in non-EU/EEA currenciesSwiss franc . . . . . . . . . . . . . . . . . . . . . . . . . . . . . . . . . . . . CHF 2 409 488.48 % 100 1 975 231.79 0.35U.S. dollar . . . . . . . . . . . . . . . . . . . . . . . . . . . . . . . . . . . . . USD 374 856.59 % 100 277 139.85 0.05Other assets 1 227 515.36 0.22Interest receivable . . . . . . . . . . . . . . . . . . . . . . . . . . . . . . EUR 15 192.71 % 100 15 192.71 0.00Dividends receivable . . . . . . . . . . . . . . . . . . . . . . . . . . . . . EUR 403 278.70 % 100 403 278.70 0.07Withholding tax claims . . . . . . . . . . . . . . . . . . . . . . . . . . . EUR 808 055.63 % 100 808 055.63 0.14Other receivables . . . . . . . . . . . . . . . . . . . . . . . . . . . . . . . EUR 988.32 % 100 988.32 0.00Receivables from share certificate transactions EUR 65 313.82 % 100 65 313.82 0.01Loan liabilities -2 499 600.87 -0.44EUR loans . . . . . . . . . . . . . . . . . . . . . . . . . . . . . . . . . . . . . EUR -2 499 600.87 % 100 -2 499 600.87 -0.44Other liabilities -672 441.05 -0.12Liabilities from cost item . . . . . . . . . . . . . . . . . . . . . . . . . . EUR -671 946.88 % 100 -671 946.88 -0.12Additional other liabilities . . . . . . . . . . . . . . . . . . . . . . . . . EUR -494.17 % 100 -494.17 0.00Liabilities from share certificate transactions EUR -142 848.93 % 100 -142 848.93 -0.03Net assets 564 249 364.16 100.00Net asset value per unit 71.32Number of units outstanding 7 912 063.335Negligible rounding errors may have arisen due to the rounding of calculated percentages.Composition of the reference portfolio (risk benchmark) (according to article 28 (3), of the Derivatives Regulation (DerivateV))MSCI Europe in EURMarket risk exposure (value-at-risk) (according to article 28 (2), sentences 1 and 2, of the Derivatives Regulation (DerivateV))Lowest market risk exposure . . . . . . . . . . . . . . . . . . % 6.895Highest market risk exposure . . . . . . . . . . . . . . . . . . % 13.774Average market risk exposure . . . . . . . . . . . . . . . . . % 10.306The values-at-risk were calculated for the period from October 1, 2010, through September 30, 2011, using historical simulation with a 99% confidence level, a 10-day holding period andan effective historical observation period of one year. The risk in a reference portfolio that does not contain derivatives is used as the measurement benchmark. Market risk is the risk tothe fund from an unfavorable change in market prices. The investment company determines the potential market risk by means of the qualified approach as defined by the DerivativesRegulation.In the reporting period, the average leverage effect from the use of derivatives was 0.0, whereby the total of the nominal amounts of the derivates in relation to the fund’s assets wasused for the calculation (nominal value method).Exchange rates (indirect quotes)As of September 30, 2011Swiss franc . . . . . . . . . . . . . . . . . . . . . CHF 1.219851 = EUR 1Danish krone . . . . . . . . . . . . . . . . . . . . DKK 7.441613 = EUR 1British pound . . . . . . . . . . . . . . . . . . . GBP 0.868596 = EUR 1Norwegian krone . . . . . . . . . . . . . . . . NOK 7.893246 = EUR 1Swedish krona . . . . . . . . . . . . . . . . . . SEK 9.266306 = EUR 1U.S. dollar . . . . . . . . . . . . . . . . . . . . . USD 1.352590 = EUR 151
<strong>DWS</strong> EurovestaNotes on the valuationThe Custodian shall determine the value with the participation of the investment company. The Custodian generally bases its valuation on external sources.If no trading prices are available, prices are determined with the aid of valuation models (derived market values) which are agreed between the Custodian and the investment companyand which are based as far as possible on market parameters. This procedure is subject to an ongoing monitoring process. The plausibility of price information from third parties is checkedthrough other pricing sources, model calculations or other suitable procedure.Investments reported in this report are not valued at derived market values.Footnotes3) These securities were completely or partly transferred under securities loans. The equivalent value of the lent securities is EUR 20 638 921.87.Transactions completed during the reporting period that no longer appear in the investment portfolioPurchases and sales of securities, investment fund units and promissory note loans (Schuldscheindarlehen); market classifications are as of the reporting dateDescriptionCount/currency(– / ’000)Purchases/additionsSales/disposalsDescriptionCount/currency(– / ’000)Purchases/additionsSales/disposalsSecurities traded on an exchangeEquitiesAdecco Reg. (CH0012138605) . . . . . . . . . . . . . . . . . Count 214 080 539 080Cie Financière Richemont A (CH0045039655) . . . . . Count 311 676 311 676Clariant Reg. (CH0012142631) . . . . . . . . . . . . . . . . . Count 472 500 472 500Julius Baer Gruppe Reg. (CH0102484968) . . . . . . . . Count 260 000Novartis Reg. (CH0012005267) . . . . . . . . . . . . . . . . Count 75 000 575 000SGS Reg. (CH0002497458) . . . . . . . . . . . . . . . . . . . Count 12 000Syngenta Reg. (CH0011037469) . . . . . . . . . . . . . . . Count 98 000 153 000A.P.Møller-Mærsk B (DK0010244508) . . . . . . . . . . . Count 1 900FLSmidth & Co. B (DK0010234467) . . . . . . . . . . . . . Count 225 000Abertis Infraestructuras Reg. (ES0111845014) . . . . Count 753 306 753 306ACCOR (FR0000120404) . . . . . . . . . . . . . . . . . . . . . Count 210 699 210 699Air France-KLM (FR0000031122) . . . . . . . . . . . . . . . Count 281 635 281 635Air Liquide (FR0000120073) . . . . . . . . . . . . . . . . . . . Count 115 687 115 687Aixtron Reg. (DE000A0WMPJ6) . . . . . . . . . . . . . . . . Count 50 000 550 000ArcelorMittal (new) (LU0323134006) . . . . . . . . . . . . Count 125 281 125 281Arkema (FR0010313833) . . . . . . . . . . . . . . . . . . . . . Count 50 000 50 000ASML Holding (NL0006034001) . . . . . . . . . . . . . . . . Count 450 503 450 503AXA (FR0000120628) . . . . . . . . . . . . . . . . . . . . . . . . Count 460 208 460 208Bilfinger Berger (DE0005909006) . . . . . . . . . . . . . . . Count 50 000BNP Paribas (FR0000131104) . . . . . . . . . . . . . . . . . Count 559 447 859 447Brenntag (DE000A1DAHH0) . . . . . . . . . . . . . . . . . . . Count 35 410 115 410Cap Gemini (FR0000125338) . . . . . . . . . . . . . . . . . . Count 325 000Carrefour (FR0000120172) . . . . . . . . . . . . . . . . . . . . Count 400 000Comp. Générale de Géophysique-Veritas(FR0000120164) . . . . . . . . . . . . . . . . . . . . . . . . . . . . Count 548 267 548 267Deutsche Bank Reg. (DE0005140008) . . . . . . . . . . . Count 579 718 579 718Deutsche Börse Reg. (DE0005810055) . . . . . . . . . . Count 140 000ENEL (IT0003128367) . . . . . . . . . . . . . . . . . . . . . . . . Count 3 153 270 3 153 270ENI (IT0003132476) . . . . . . . . . . . . . . . . . . . . . . . . . Count 636 585 636 585France Telecom (FR0000133308) . . . . . . . . . . . . . . . Count 200 000 950 000Freenet (DE000A0Z2ZZ5) . . . . . . . . . . . . . . . . . . . . . Count 400 000GdF Suez (FR0010208488) . . . . . . . . . . . . . . . . . . . . Count 747 935 747 935GEK Group of Companies S.A. (GRS145003000) . . . Count 2 761 000Gemalto (NL0000400653) . . . . . . . . . . . . . . . . . . . . . Count 180 000HeidelbergCement (DE0006047004) . . . . . . . . . . . . Count 157 319 307 319Immofinanz Immobilien Anlagen (AT0000809058) . . Count 2 849 999Intesa Sanpaolo (IT0000072618) . . . . . . . . . . . . . . . Count 1 643 255 1 643 255Koninklijke KPN (NL0000009082) . . . . . . . . . . . . . . . Count 715 299 715 299Koninklijke Philips Electronics (NL0000009538) . . . . Count 343 199 343 199Metro Ord. (DE0007257503) . . . . . . . . . . . . . . . . . . Count 120 000 120 000Pernod-Ricard (C.R.) (FR0000120693) . . . . . . . . . . . Count 218 866 333 866Peugeot (C.R.) (FR0000121501) . . . . . . . . . . . . . . . . Count 150 000 150 000Porsche Automobil Holding Right on Pref.(DE000A1KRRB1) . . . . . . . . . . . . . . . . . . . . . . . . . . . Count 137 416 137 416Qiagen (NL0000240000) . . . . . . . . . . . . . . . . . . . . . . Count 115 000Sanofi (FR0000120578) . . . . . . . . . . . . . . . . . . . . . . Count 400 000Societe Generale (FR0000130809) . . . . . . . . . . . . . . Count 464 305 964 305Terna Energy (GRS496003005) . . . . . . . . . . . . . . . . . Count 920 000ThyssenKrupp AG (DE0007500001) . . . . . . . . . . . . . Count 380 000 380 000Total (FR0000120271) . . . . . . . . . . . . . . . . . . . . . . . . Count 895 393 895 393UniCredit (IT0000064854) . . . . . . . . . . . . . . . . . . . . . Count 9 862 623 9 862 623Unilever (NL0000009355) . . . . . . . . . . . . . . . . . . . . . Count 450 000Volkswagen Pref. (DE0007664039) . . . . . . . . . . . . . Count 35 000 85 000Amec (GB0000282623) . . . . . . . . . . . . . . . . . . . . . . Count 987 379 987 379Anglo American (GB00B1XZS820) . . . . . . . . . . . . . . Count 430 596 530 596Astrazeneca (GB0009895292) . . . . . . . . . . . . . . . . . Count 229 079BHP Billiton (GB0000566504) . . . . . . . . . . . . . . . . . . Count 813 029 813 029BP (GB0007980591) . . . . . . . . . . . . . . . . . . . . . . . . . Count 3 500 000 3 500 000Croda International (GB0002335270) . . . . . . . . . . . . Count 613 000Enterprise Inns (GB00B1L8B624) . . . . . . . . . . . . . . . Count 4 540 000Imperial Tobacco Group (GB0004544929) . . . . . . . . Count 200 000 610 000Intercontinental Hotels Group (GB00B1WQCS47) . . Count 752 485 752 485International Consolidated Airlines Group(ES0177542018) . . . . . . . . . . . . . . . . . . . . . . . . . . . . Count 2 839 632 2 839 632Kazakhmys (GB00B0HZPV38) . . . . . . . . . . . . . . . . . Count 510 000 510 000Lloyds TSB Group (GB0008706128) . . . . . . . . . . . . . Count 12 000 000Prudential (GB0007099541) . . . . . . . . . . . . . . . . . . . Count 515 757 515 757Reckitt Benckiser Group (GB00B24CGK77) . . . . . . . Count 300 000Tesco (GB0008847096) . . . . . . . . . . . . . . . . . . . . . . Count 750 000 750 000The Royal Bank of Scotland Group(GB0007547838) . . . . . . . . . . . . . . . . . . . . . . . . . . . . Count 25 086 523 25 086 523Tullow Oil (GB0001500809) . . . . . . . . . . . . . . . . . . . Count 189 140 1 189 140Wm. Morrison Supermarkets (GB0006043169) . . . . Count 4 050 000Golden Ocean Group (BMG4032A1045) . . . . . . . . . Count 3 000 000Petroleum Geo-Services (new) (NO0010199151) . . Count 1 215 629 1 215 629SeaDrill (BMG7945E1057) . . . . . . . . . . . . . . . . . . . . Count 400 000 400 000Statoil (NO0010096985) . . . . . . . . . . . . . . . . . . . . . . Count 343 486 1 233 486Atlas Copco A Redempt. Shares (SE0001426065) . . Count 761 458 761 458Sandvik (SE0000667891) . . . . . . . . . . . . . . . . . . . . . Count 556 152 556 152Skandinaviska Enskilda Banken A (Free)(SE0000148884) . . . . . . . . . . . . . . . . . . . . . . . . . . . . Count 1 500 000Swedbank (SE0000242455) . . . . . . . . . . . . . . . . . . . Count 545 542 545 542Volvo B (Free) (SE0000115446) . . . . . . . . . . . . . . . . Count 1 270 000 1 270 000Mechel OAO ADR (US5838401033) . . . . . . . . . . . . Count 175 000 175 000Securities that are admitted or included in organized marketsEquitiesSberegatelniy Bank Rossiyskoy Federatsii(RU0009029540) . . . . . . . . . . . . . . . . . . . . . . . . . . . . Count 1 400 000 12 400 00052
<strong>DWS</strong> EurovestaDerivatives (option premiums realized in opening transactions, or total optionstransactions; in the case of warrants, purchases and sales are shown)Futures contractsValue (’000)Equity index futuresContracts purchased: EUR 259 412(Underlyings: Dow Jones Euro STOXX Bank, Dow Jones STOXX600 Insurance Index, Euro STOXX 50 Price Euro, STOXX Europe600 Banks)Currency futuresFutures contracts to sell currenciesEUR/GBP EUR 38 661Securities loans (total transactions, at the value agreed at the closing of the loancontract)Value (’000)Perpetual EUR 964 590(Security description: A.P.Møller-Mærsk B, Adecco Reg., Air France-KLM, AirLiquide, Aixtron Reg., Alcatel-Lucent, Allianz SE, Ashmore, ASMLHolding, Astrazeneca, Atlas Copco A (Free), Atlas Copco ARedempt. Shares, AXA, BASF Reg., Bayer, BMW Ord., BNPParibas, Cap Gemini, Carrefour, Cie Financière Richemont A,Clariant Reg., Comp. Générale de Géophysique-Veritas,Compagnie de Saint-Gobain (C.R.), Continental, Daimler Reg.,Deutsche Bank Reg., DnB NOR A, Essilor International,FLSmidth & Co. B, Fortum, Galp Energia SGPS, GdF Suez,Gemalto, Golden Ocean Group, HeidelbergCement, Henkel Pref.,Immofinanz Immobilien Anlagen, ING Groep CVA, KoninklijkeDSM, Linde, Metro Ord., Nestlé Reg., Nordea Bank, NovartisReg., Pernod-Ricard (C.R.), Petroleum Geo-Services (new),Peugeot (C.R.), Porsche Automobil Holding Pref., PorscheAutomobil Holding Right on Pref., Repsol YPF, Royal Dutch ShellCl. A, Saipem, Sampo Bear. A, Sandvik, Sanofi, SAP, SchneiderElectric, SeaDrill, SES Cl.A FDR, SGS Reg., Siemens Reg.,Skandinaviska Enskilda Banken A (Free), Societe Generale,Statoil, Subsea 7. Swedbank, Syngenta Reg., Telefonica, TheSwatch Group, Total, Unilever, VINCI, Volkswagen Pref., Volvo B(Free), Yara International)53
<strong>DWS</strong> EurovestaStatement of income and expenses (incl. income adjustment)Performance of the investment fund 2010/2011for the period from October 1, 2010, through September 30, 2011I. Income1. Dividends from domestic issuers . . . . . . . . . . . . . . . . . . EUR 4 238 927.082. Dividends from foreign issuers(before withholding tax) . . . . . . . . . . . . . . . . . . . . . . . . . EUR 8 032 181.223. Interest from investments of liquid assets in Germany . EUR 205 625.024. Income from securities lendingand repurchase agreements . . . . . . . . . . . . . . . . . . . . . . EUR 1 211 841.06including:from securities lending . . . . . . . . .EUR 1 211 841.065. Deduction for foreign withholding tax . . . . . . . . . . . . . . EUR -185 843.436. Other income . . . . . . . . . . . . . . . . . . . . . . . . . . . . . . . . . EUR 3 808 288.76including:Compensation payments . . . . . . .EUR 3 807 861.67Other . . . . . . . . . . . . . . . . . . . . . . .EUR 427.09Total income . . . . . . . . . . . . . . . . . . . . . . . . . . . . . . . . . . . . EUR 17 311 019.71II. Expenses1. Interest on borrowings . . . . . . . . . . . . . . . . . . . . . . . . . . EUR -369.312. Management fee . . . . . . . . . . . . . . . . . . . . . . . . . . . . . . EUR -10 052 969.46including:All-in fee . . . . . . . . . . . . . . . . . . . .EUR -10 052 969.463. Other expenses . . . . . . . . . . . . . . . . . . . . . . . . . . . . . . . EUR -608 494.79including:Performance-based fee fromsecurities lending income . . . . . . .EUR -605 920.54Legal expenses . . . . . . . . . . . . . . .EUR -2 432.38Other . . . . . . . . . . . . . . . . . . . . . . .EUR -141.87Total expenses . . . . . . . . . . . . . . . . . . . . . . . . . . . . . . . . . . EUR -10 661 833.56I. Value of the investment fund at the beginningof the fiscal year . . . . . . . . . . . . . . . . . . . . . . . . . . . . . . EUR 769 846 306.151. Previous year's distribution or tax abatement . . . . . . . . . EUR -5 674 909.102. Net inflows . . . . . . . . . . . . . . . . . . . . . . . . . . . . . . . . . . . EUR -70 076 201.24a) Inflows from subscriptions . . . . . . . . . . . . . . . . . . . . EUR 35 271 018.14b) Outflows from redemptions . . . . . . . . . . . . . . . . . . . EUR -105 347 219.383. Income adjustment and reimbursed expenses . . . . . . . . EUR 7 564 217.854. Net investment income . . . . . . . . . . . . . . . . . . . . . . . . . . EUR 6 649 186.155. Realized gains . . . . . . . . . . . . . . . . . . . . . . . . . . . . . . . . . EUR 127 683 354.806. Realized losses . . . . . . . . . . . . . . . . . . . . . . . . . . . . . . . . EUR -110 396 478.447. Net change in unrealized appreciation/depreciation . . . . EUR -161 346 112.01II. Value of the investment fund atthe end of the fiscal year . . . . . . . . . . . . . . . . . . . . . . . EUR 564 249 364.16Distribution policy of the investment fundTotalPer unitI. Calculation of distribution1. Balance brought forwardfrom previous year . . . . . . . . . . . . . . . . . . EUR 105 399 902.29 13.322. Net gain/loss for the fiscal year . . . . . . . . EUR 23 936 062.51 3.03II. Available for distribution . . . . . . . . . . . . EUR 129 335 964.80 16.351. Reinvested . . . . . . . . . . . . . . . . . . . . . . . . EUR -38 052 426.98 -4.812. Balance carried forward . . . . . . . . . . . . . . EUR -84 637 404.62 -10.70III. Total distribution . . . . . . . . . . . . . . . . . . EUR 6 646 133.20 0.84III. Net investment income . . . . . . . . . . . . . . . . . . . . . . . . EUR 6 649 186.15IV. Sale transactionsRealized gains . . . . . . . . . . . . . . . . . . . . . . . . . . . . . . . . . . . . EUR 127 683 354.80Realized losses . . . . . . . . . . . . . . . . . . . . . . . . . . . . . . . . . . . EUR -110 396 478.44Capital gains/losses . . . . . . . . . . . . . . . . . . . . . . . . . . . . . . EUR 17 286 876.361. Final distributiona) Cash distribution . . . . . . . . . . . . . . . . . EUR 6 288 866.42 0.80b) Withholding tax oncapital income withheld . . . . . . . . . . . . EUR 338 641.50 0.04c) Solidarity surcharge withheld . . . . . . . . EUR 18 625.28 0.00V. Net gain/loss for the fiscal year . . . . . . . . . . . . . . . . . . EUR 23 936 062.51Total expense ratio (in accordance with article 41 (2) of the InvGThe total expense ratio was 1.40% p.a. The TER expresses total expenses and fees(excluding transaction costs) as a percentage of the fund’s average net assets for a givenfiscal year.As well, the additional income from securities lending resulted in a performance-basedfee of 0.084% p.a. calculated on the fund’s average net assets.Information provided in accordance with article 41 (4) and (5) of the InvG (Costs and CostTransparency).In the fiscal year from October 1, 2010, through September 30, 2011, the investmentcompany, <strong>DWS</strong> Investment GmbH, was not reimbursed for the fees and expenses paidby <strong>DWS</strong> Eurovesta to the Custodian and other third parties, except in the form of financialinformation provided by brokers for research purposes.Changes in net assets and in the net asset value perunit over the last three yearsNet assetsat the end ofthe fiscal year EURNet assetvalue perunit EUR2011 . . . . . . . . . . . . . . . . . . . . . . . . . . . . . . . . . . . . 564 249 364.16 71.322010 . . . . . . . . . . . . . . . . . . . . . . . . . . . . . . . . . . . . 769 846 306.15 88.812009 . . . . . . . . . . . . . . . . . . . . . . . . . . . . . . . . . . . . 724 033 196.54 82.462008 . . . . . . . . . . . . . . . . . . . . . . . . . . . . . . . . . . . . 636 812 327.66 82.08An all-in fee of 1.40% per year is payable to the investment company under the Terms ofContract. Of this annual fee, the investment company in turn pays up to 0.15% to theCustodian and up to 0.05% to other parties (for printing and publication costs, auditing andother items). Of its own portion of the all-in fee, the investment company pays more than10% in commissions to distributors of the fund; the specific percentage paid is based onthe balance of units distributed.Transaction costsThe transaction costs paid in the reporting period amounted to EUR 5 672 492.69.The transaction costs include all costs that were reported or settled separately for theaccount of the fund in the reporting period and are directly connected to the purchase orsale of assets.Transactions processed for the account of the fund’s assets via closely related companies (based on major holdings of the Deutsche Bank Group)The share of transactions conducted for the account of the investment fund’s assets via brokers that are closely related companies and persons (share of five percent and above), amountedto 2.63 percent of all transactions. The total volume was EUR 77 076 351.49.54
Independentauditor’s reportKPMG issued an unqualified auditor's report forthe full annual report in accordance with article 44 (5)of the German Investment Act. The translation of theauditor's report is as follows:To <strong>DWS</strong> Investment GmbH, Frankfurt/Main, GermanyIn accordance with article 44 (5) of the German Investment Act (Investmentgesetz;InvG), <strong>DWS</strong> Investment GmbH commissioned us to perform the audit of the annualreport of the investment fund <strong>DWS</strong> Eurovesta for the fiscal year from October 1, 2010,through September 30, 2011.Responsibility of the legal representativesThe preparation of the annual report according to the provisions of the InvG is theresponsibility of the legal representatives of the investment company.Responsibility of the auditorsOur responsibility is to express an opinion on the annual report based on our audit.We conducted our audit in accordance with article 44 (5) InvG and generally acceptedGerman standards for the audit of financial statements promulgated by the Institut derWirtschaftsprüfer (Institute of Public Auditors in Germany; IDW). Those standardsrequire that we plan and perform the audit such that misstatements materially affectingthe annual report are detected with reasonable assurance. Knowledge of themanagement of the investment fund and expectations as to possible misstatementsare taken into account in the determination of audit procedures. The effectiveness ofthe accounting-related internal control system and the evidence supporting thedisclosures in the annual report are examined primarily on a test basis within theframework of the audit. The audit includes assessing the accounting principles usedfor the annual report and significant estimates made by the legal representatives ofthe investment company. In our view, our audit provides a reasonably secure basis forour evaluation.Audit opinionOur audit has not led to any reservations.In our opinion, based on the findings of our audit, the annual report complies with thelegal requirements.Frankfurt/Main, December 20, 2011KPMG AGWirtschaftsprüfungsgesellschaftHornschuWirtschaftsprüferNeufWirtschaftsprüfer55
2010The formatused for complete datesin securities descriptions in the investmentportfolio is “day/month/year”.Annual report<strong>DWS</strong> Intervest2011
<strong>DWS</strong> IntervestInvestment objective andperformance in the reporting periodIn its global stock selection, the inter -national equity fund <strong>DWS</strong> Intervest preferredcompanies with strong earnings,comparatively solid business modelsand attractive valuations, supplementedby selected growth stocks. In the fiscalyear through the end of September2011, the fund recorded a depreciationof 18.0% per unit (BVI method) and<strong>DWS</strong> INTERVESTFive-year performance130120110100908070609/06* 9/07 9/08 9/09 9/109/11<strong>DWS</strong> Intervest* 9/2006 = 100Data on euro basis“BVI method” performance, i.e., excluding the initial sales charge. Past performance is no guide to future results.As of: September 30, 2011was thus behind its benchmark, theMSCI World, which fell 3.2%.Investment policyin the reporting periodThe management saw major risks forthe investment fund in an economicslowdown, compounded by the highsovereign debt of western countriesand the lack of unified political processesin some nations. For risk reasons,the fund therefore focused on higherquality value stocks. The more defensiveorientation of the portfolio, how -ever, dampened the fund’s performancein the fourth quarter of 2010, as cyclical,<strong>DWS</strong> INTERVEST vs. benchmarkPerformance at a glancein %1470-7-14-21-28-18.0-3.21 year-12.9+7.83 years-21.5-13.95 years<strong>DWS</strong> IntervestBenchmark MSCI WorldData on euro basis“BVI method” performance, i.e., excluding theinitial sales charge. Past performance is no guideto future results.As of: September 30, 2011growth-oriented stocks enjoyed strongview of this, the European weighting inthe fund was reduced towards the endof the reporting period. The earthquakedisaster in Japan was also a drag onperformance since the fund was overweightedhere. Japan’s weighting waslater reduced and hedging in Japaneseyen was completely liquidated in thecourse of the year. The higher cashratio boosted performance, particularlyat the end of the reporting period.demand during the upward trend in thecapital markets in light of the initiallyfavorable climate of the global economy.In addition, the overweighting ofinvestments in the euro area had anegative impact. European equitiesappeared to be valued more attractivelythan U.S. securities. Furthermore, thecontinuing high unemployment figuresand the failure of the house market torecover indicated weaker U.S. consumerspending. As the EU sovereigndebt problems deteriorated, Europeanstocks came under greater pressure. InAt sector level, <strong>DWS</strong> Intervest bene -fited from its selection of individual58
equities in the commodities sector. Investmentsin gold mine operators suchas Newmont Mining and Yamana Goldbenefited from the high price of gold.Both gold manufacturers operate theirmines in relatively politically stableregions and therefore seem quite interesting.Telecommunications serviceproviders, which were overweighted inthe portfolio, also had a positive impacton performance. The selected mobilephone operators Vodafone and ChinaMobile impressed with their defensivecharacter, high dividend yields and stableearnings. The considerable underweightingof the financial sector incomparison to the benchmark made apositive contribution to performance.Concerns regarding banks’ investmentsin southern European bonds wereamong the factors weighing on equityprices. In the industrial sector, PostNLrecorded a below-average performance.The company failed to live up to expectationsafter spinning off the Dutch logisticsgroup TNT. Utilities companies,including E.ON and RWE, were sharplyreduced. Plans to switch off nuclearpower stations and other potential<strong>DWS</strong> INTERVEST: Summary statement of assetsInvestment focus by sectorEquities 89.6% (September 30, 2011) / Equities 73.0% (September 30, 2010)Information TechnologyHealth Care8.912.212.111.1Financials5.011.2IndustrialsTelecommunication Services6.77.410.410.3Energy9.29.1Consumer Staples7.76.4Materials5.97.5Consumer Discretionary4.94.2Utilities4.18.3Time deposit0.010.1Warrants0.00.4Cash and other assets10.416.50 4 8 12 16 20In % of the fund’s net assets in bondsas of September 30, 2011In % of the fund’s net assets in bondsas of September 30, 2010regulatory interventions were amongthe factors weighing on equity prices.Main sources of capital gains/lossesThe main sources of capital gains/losses were losses realized on equitiesand forward transactions.Security code: 847 401ISIN: DE0008474016As of: September 30, 201159
Annual report<strong>DWS</strong> IntervestInvestment portfolio – September 30, 2011Count/ Quantity/ Purchases/ Sales/ Market price Total market % ofDescription currency principal additions disposals value in net assets(– / ’000) amount in the reporting period EURSecurities traded on an exchange 222 111 551.54 89.61EquitiesAgnico-Eagle Mines (CA0084741085) . . . . . . . . . . . . . . . . Count 40 000 115 000 150 000 CAD 62.0800 1 760 713.93 0.71Barrick Gold (CA0679011084) . . . . . . . . . . . . . . . . . . . . . . Count 35 000 180 000 260 000 CAD 48.0100 1 191 452.82 0.48Canadian Natural Resources (CA1363851017) . . . . . . . . . Count 85 000 100 000 130 000 CAD 31.5200 1 899 687.81 0.77Canadian Oil Sands (CA13643E1051) . . . . . . . . . . . . . . . . Count 90 000 200 000 110 000 CAD 20.6700 1 319 046.44 0.53EnCana Corp (CA2925051047) 3) . . . . . . . . . . . . . . . . . . . Count 120 000 245 000 300 000 CAD 20.3400 1 730 650.19 0.70Iamgold (CA4509131088) . . . . . . . . . . . . . . . . . . . . . . . . . Count 85 000 235 000 150 000 CAD 20.6400 1 243 958.00 0.50Kinross Gold (CA4969024047) . . . . . . . . . . . . . . . . . . . . . Count 160 000 550 000 840 000 CAD 15.0000 1 701 720.94 0.69Suncor Energy (new) (CA8672241079) . . . . . . . . . . . . . . . Count 150 000 250 000 315 000 CAD 27.7100 2 947 167.95 1.19Yamana Gold (CA98462Y1007) . . . . . . . . . . . . . . . . . . . . . Count 125 000 560 000 1 185 000 CAD 14.0400 1 244 383.43 0.50Credit Suisse Group Reg. (CH0012138530) . . . . . . . . . . . Count 70 000 575 000 505 000 CHF 24.0800 1 381 808.11 0.56Nestlé Reg. (CH0038863350) . . . . . . . . . . . . . . . . . . . . . . Count 35 000 105 000 70 000 CHF 49.8100 1 429 149.95 0.58Novartis Reg. (CH0012005267) . . . . . . . . . . . . . . . . . . . . . Count 60 000 145 000 85 000 CHF 50.5500 2 486 369.24 1.00UBS Reg. (CH0024899483) . . . . . . . . . . . . . . . . . . . . . . . . Count 150 000 815 000 865 000 CHF 10.7400 1 320 653.10 0.53AEGON (NL0000303709) . . . . . . . . . . . . . . . . . . . . . . . . . Count 650 000 1 750 000 1 100 000 EUR 3.0670 1 993 550.00 0.80Allianz SE (DE0008404005) . . . . . . . . . . . . . . . . . . . . . . . . Count 27 500 106 500 79 000 EUR 69.7100 1 917 025.00 0.77Alstom (FR0010220475) 3) . . . . . . . . . . . . . . . . . . . . . . . . Count 50 000 215 000 165 000 EUR 24.8800 1 244 000.00 0.50Areva (FR0011027143) 3) . . . . . . . . . . . . . . . . . . . . . . . . . Count 90 000 130 000 40 000 EUR 23.7250 2 135 250.00 0.86Atos Origin (FR0000051732) . . . . . . . . . . . . . . . . . . . . . . Count 80 000 150 000 70 000 EUR 32.3500 2 588 000.00 1.04AXA (FR0000120628) . . . . . . . . . . . . . . . . . . . . . . . . . . . . Count 200 000 775 000 575 000 EUR 9.7940 1 958 800.00 0.79Axel Springer Vink. Reg. (DE0005501357) . . . . . . . . . . . . Count 75 000 79 851 38 000 EUR 25.7850 1 933 875.00 0.78Bayer (DE000BAY0017) . . . . . . . . . . . . . . . . . . . . . . . . . . Count 75 000 75 000 EUR 41.5050 3 112 875.00 1.26Bouygues (FR0000120503) . . . . . . . . . . . . . . . . . . . . . . . . Count 75 000 75 000 165 000 EUR 24.9550 1 871 625.00 0.76Deutsche Boerse New (appliedfor tender) (DE000A1KRND6) . . . . . . . . . . . . . . . . . . . . . . Count 85 000 95 000 10 000 EUR 37.3900 3 178 150.00 1.28Deutsche Post Reg. (DE0005552004) . . . . . . . . . . . . . . . Count 195 000 550 000 355 000 EUR 9.6000 1 872 000.00 0.76Deutsche Telekom Reg. (DE0005557508) 3) . . . . . . . . . . Count 450 000 400 000 450 000 EUR 8.7700 3 946 500.00 1.59E.ON Reg. (DE000ENAG999) . . . . . . . . . . . . . . . . . . . . . . Count 150 000 225 000 550 000 EUR 16.4250 2 463 750.00 0.99France Telecom (FR0000133308) . . . . . . . . . . . . . . . . . . . Count 325 000 285 000 435 000 EUR 12.2250 3 973 125.00 1.60GdF Suez (FR0010208488) . . . . . . . . . . . . . . . . . . . . . . . . Count 115 000 140 000 275 000 EUR 22.5850 2 597 275.00 1.05Gemalto (NL0000400653) . . . . . . . . . . . . . . . . . . . . . . . . . Count 55 000 100 000 45 000 EUR 34.8300 1 915 650.00 0.77ING Groep CVA (NL0000303600) . . . . . . . . . . . . . . . . . . . Count 275 000 1 780 000 1 505 000 EUR 5.4110 1 488 025.00 0.60K+S Reg. (DE000KSAG888) . . . . . . . . . . . . . . . . . . . . . . . Count 42 500 47 500 5 000 EUR 40.1950 1 708 287.50 0.69Koninklijke KPN (NL0000009082) . . . . . . . . . . . . . . . . . . . Count 265 000 210 000 495 000 EUR 9.7750 2 590 375.00 1.05LVMH Moët Hennessy Louis Vuitton(C.R.) (FR0000121014) . . . . . . . . . . . . . . . . . . . . . . . . . . . Count 16 500 48 000 31 500 EUR 98.4100 1 623 765.00 0.66PostNL (NL0009739416) . . . . . . . . . . . . . . . . . . . . . . . . . . Count 725 000 1 220 000 495 000 EUR 3.3280 2 412 800.00 0.97Qiagen (NL0000240000) . . . . . . . . . . . . . . . . . . . . . . . . . . Count 125 000 300 000 175 000 EUR 10.5300 1 316 250.00 0.53RWE Ord. (DE0007037129) . . . . . . . . . . . . . . . . . . . . . . . Count 70 000 80 000 210 000 EUR 27.6850 1 937 950.00 0.78Sanofi (FR0000120578) . . . . . . . . . . . . . . . . . . . . . . . . . . . Count 50 000 50 000 100 000 EUR 49.5150 2 475 750.00 1.00SAP (DE0007164600) . . . . . . . . . . . . . . . . . . . . . . . . . . . . Count 50 000 275 000 225 000 EUR 37.9650 1 898 250.00 0.77Suez Environnement (FR0010613471) . . . . . . . . . . . . . . . Count 300 000 505 000 205 000 EUR 10.4000 3 120 000.00 1.26TNT Express (NL0009739424) . . . . . . . . . . . . . . . . . . . . . Count 225 000 445 600 220 600 EUR 5.2790 1 187 775.00 0.48Total (FR0000120271) . . . . . . . . . . . . . . . . . . . . . . . . . . . . Count 120 000 165 000 245 000 EUR 32.8600 3 943 200.00 1.59Unilever (NL0000009355) . . . . . . . . . . . . . . . . . . . . . . . . . Count 80 000 195 000 115 000 EUR 23.5250 1 882 000.00 0.76VINCI (FR0000125486) . . . . . . . . . . . . . . . . . . . . . . . . . . . Count 60 000 105 000 45 000 EUR 32.0050 1 920 300.00 0.77Vivendi (FR0000127771) . . . . . . . . . . . . . . . . . . . . . . . . . . Count 245 000 115 000 245 000 EUR 15.1950 3 722 775.00 1.503i Group (GB00B1YW4409) . . . . . . . . . . . . . . . . . . . . . . . Count 1 400 000 1 750 000 350 000 GBP 1.8740 3 020 506.66 1.22Anglo American (GB00B1XZS820) . . . . . . . . . . . . . . . . . . Count 70 000 180 000 110 000 GBP 22.0850 1 779 826.29 0.72BG Group (GB0008762899) . . . . . . . . . . . . . . . . . . . . . . . Count 215 000 215 000 GBP 12.2800 3 039 617.96 1.23Burberry Group (GB0031743007) . . . . . . . . . . . . . . . . . . . Count 85 000 90 000 5 000 GBP 11.3200 1 107 764.71 0.45GlaxoSmithkline (GB0009252882) . . . . . . . . . . . . . . . . . . Count 125 000 135 890 185 890 GBP 13.2268 1 903 466.92 0.77Invensys (GB00B19DVX61) . . . . . . . . . . . . . . . . . . . . . . . . Count 725 000 1 300 000 575 000 GBP 2.2840 1 906 409.88 0.77Rio Tinto (GB0007188757) . . . . . . . . . . . . . . . . . . . . . . . . Count 50 000 115 000 65 000 GBP 28.8850 1 662 740.79 0.67Smiths Group (GB00B1WY2338) . . . . . . . . . . . . . . . . . . . Count 225 000 375 000 150 000 GBP 9.8450 2 550 236.24 1.03Vodafone Group (GB00B16GWD56) . . . . . . . . . . . . . . . . . Count 1 030 000 350 000 1 970 000 GBP 1.6560 1 963 720.76 0.79Wm. Morrison Supermarkets (GB0006043169) . . . . . . . . Count 550 000 900 000 2 200 000 GBP 2.8820 1 824 899.03 0.74Belle International Holdings (KYG097021045) . . . . . . . . . Count 1 050 000 1 075 000 25 000 HKD 13.6000 1 354 946.05 0.55China Mobile LTD (HK0941009539) . . . . . . . . . . . . . . . . . Count 500 000 540 000 40 000 HKD 77.1000 3 657 785.03 1.48HSBC Holdings (GB0005405286) . . . . . . . . . . . . . . . . . . . Count 415 000 500 000 85 000 HKD 60.9000 2 398 055.25 0.97Canon (JP3242800005) . . . . . . . . . . . . . . . . . . . . . . . . . . . Count 70 000 100 000 215 000 JPY 3 550.0000 2 394 721.35 0.97Daiwa Securities Group (JP3502200003) . . . . . . . . . . . . . Count 700 000 1 000 000 1 950 000 JPY 292.0000 1 969 742.63 0.79Fanuc (JP3802400006) . . . . . . . . . . . . . . . . . . . . . . . . . . . Count 23 500 25 000 1 500 JPY 10 830.0000 2 452 589.77 0.99Lawson (JP3982100004) . . . . . . . . . . . . . . . . . . . . . . . . . . Count 45 000 85 000 185 000 JPY 4 380.0000 1 899 394.68 0.77Mitsubishi UFJ Financial Group (JP3902900004) . . . . . . . Count 725 000 800 000 1 825 000 JPY 354.0000 2 473 260.50 1.00Nippon Sheet Glass Co. (JP3686800008) . . . . . . . . . . . . . Count 1 500 000 3 440 000 1 940 000 JPY 175.0000 2 529 635.23 1.02Seven & I Holdings Co. (JP3422950000) . . . . . . . . . . . . . Count 90 000 180 000 365 000 JPY 2 189.0000 1 898 527.38 0.7760
<strong>DWS</strong> IntervestCount/ Quantity/ Purchases/ Sales/ Market price Total market % ofDescription currency principal additions disposals value in net assets(– / ’000) amount in the reporting period EURShiseido Co. (JP3351600006) . . . . . . . . . . . . . . . . . . . . . . Count 175 000 540 000 515 000 JPY 1 507.0000 2 541 440.20 1.03Sumitomo Corp. (JP3404600003) . . . . . . . . . . . . . . . . . . . Count 195 000 350 000 155 000 JPY 967.0000 1 817 145.40 0.73T & D Holdings (JP3539220008) . . . . . . . . . . . . . . . . . . . . Count 370 000 735 000 365 000 JPY 737.0000 2 627 833.26 1.06Tokio Marine Holdings Inc. (JP3910660004) . . . . . . . . . . . Count 105 000 425 000 320 000 JPY 1 984.0000 2 007 518.52 0.81Cermaq (NO0010003882) . . . . . . . . . . . . . . . . . . . . . . . . . Count 190 000 50 000 360 000 NOK 63.0000 1 516 486.37 0.61Petroleum Geo-Services (new)(NO0010199151) . . . . . . . . . . . . . . . . . . . . . . . . . . . . . . . . Count 245 000 525 000 280 000 NOK 60.0000 1 862 351.69 0.75Singapore Telecommunications (SG1T75931496) . . . . . . Count 1 050 000 1 185 000 135 000 SGD 3.1800 1 902 701.79 0.77Catcher Technology Corp. (TW0002474004) . . . . . . . . . . Count 300 000 300 000 TWD 179.0000 1 302 052.58 0.53Hon Hai Precision Industry Co. (TW0002317005) . . . . . . Count 1 850 000 2 785 000 935 000 TWD 69.2000 3 104 073.96 1.25Air Products & Chemicals (US0091581068) . . . . . . . . . . . Count 25 000 35 000 10 000 USD 79.2900 1 465 521.70 0.59Alnylam Pharmaceuticals (US02043Q1076) 3) . . . . . . . . . Count 250 000 200 000 USD 6.7000 1 238 364.91 0.50Amazon.com (US0231351067) . . . . . . . . . . . . . . . . . . . . . Count 15 000 17 500 2 500 USD 222.4400 2 466 822.91 1.00Apple (US0378331005) . . . . . . . . . . . . . . . . . . . . . . . . . . . Count 10 000 10 000 USD 390.5700 2 887 571.25 1.17AutoZone (US0533321024) . . . . . . . . . . . . . . . . . . . . . . . . Count 8 000 9 000 1 000 USD 317.5800 1 878 351.90 0.76Avon Products (US0543031027) . . . . . . . . . . . . . . . . . . . . Count 245 000 400 000 155 000 USD 19.8300 3 591 886.68 1.45Chiquita Brands International(US1700328099) . . . . . . . . . . . . . . . . . . . . . . . . . . . . . . . . Count 400 000 250 000 100 000 USD 8.7300 2 581 713.60 1.04Chunghwa Telecom Sp. ADR (new)(US17133Q5027) . . . . . . . . . . . . . . . . . . . . . . . . . . . . . . . . Count 80 000 80 000 USD 33.2900 1 968 963.25 0.79ConocoPhillips (US20825C1045) . . . . . . . . . . . . . . . . . . . . Count 30 000 85 000 55 000 USD 64.3700 1 427 705.37 0.58Eli Lilly & Co. (US5324571083) . . . . . . . . . . . . . . . . . . . . . Count 140 000 265 000 400 000 USD 37.2500 3 855 565.99 1.56Gazprom ADR (US3682872078) . . . . . . . . . . . . . . . . . . . . Count 250 000 640 000 390 000 USD 9.5400 1 763 283.77 0.71Gilead Sciences (US3755581036) . . . . . . . . . . . . . . . . . . . Count 85 000 95 000 235 000 USD 39.2500 2 466 564.15 1.00Google A (US38259P5089) . . . . . . . . . . . . . . . . . . . . . . . . Count 6 000 7 000 1 000 USD 527.5000 2 339 955.20 0.94Intel Corp. (US4581401001) . . . . . . . . . . . . . . . . . . . . . . . Count 150 000 115 000 315 000 USD 22.2100 2 463 052.37 0.99Itron (US4657411066) . . . . . . . . . . . . . . . . . . . . . . . . . . . . Count 100 000 145 000 105 000 USD 32.1400 2 376 181.99 0.96Johnson & Johnson (US4781601046) . . . . . . . . . . . . . . . Count 40 000 45 000 5 000 USD 63.9000 1 889 707.89 0.76LUKOIL Oil ADR (US6778621044) . . . . . . . . . . . . . . . . . . Count 50 000 220 000 170 000 USD 49.7200 1 837 955.33 0.74Merck (new) (US58933Y1055) . . . . . . . . . . . . . . . . . . . . . Count 160 000 145 000 160 000 USD 32.6600 3 863 402.80 1.56Microsoft Corp. (US5949181045) . . . . . . . . . . . . . . . . . . . Count 200 000 135 000 335 000 USD 25.4500 3 763 150.70 1.52Mosaic (new) (US61945C1036) . . . . . . . . . . . . . . . . . . . . Count 30 000 90 000 60 000 USD 54.2000 1 202 138.12 0.49Newmont Mining Corp. (US6516391066) . . . . . . . . . . . . . Count 40 000 280 000 320 000 USD 62.5200 1 848 897.30 0.75Telekomunikasi Indonesia ADR (US7156841063) . . . . . . . Count 78 500 215 000 136 500 USD 33.0900 1 920 437.83 0.77Teva Pharmaceutical Industries ADR (US8816242098) . . Count 140 000 185 000 45 000 USD 36.9400 3 823 479.40 1.54The Home Depot (US4370761029) . . . . . . . . . . . . . . . . . . Count 75 000 85 000 10 000 USD 33.7900 1 873 627.63 0.76The Shaw Group (US8202801051) . . . . . . . . . . . . . . . . . . Count 115 000 100 000 135 000 USD 22.3400 1 899 393.02 0.77VeriFone Holdings (US92342Y1091) . . . . . . . . . . . . . . . . . Count 110 000 110 000 USD 37.2600 3 030 186.53 1.22Vulcan Materials (US9291601097) . . . . . . . . . . . . . . . . . . Count 85 000 215 000 130 000 USD 28.9500 1 819 287.44 0.73Weatherford International Reg. (CH0038838394) . . . . . . . Count 120 000 505 000 385 000 USD 12.7500 1 131 163.18 0.46Other equity securitiesRoche Holding Profitsh. (CH0012032048) . . . . . . . . . . . . Count 11 500 26 500 65 000 CHF 146.6000 1 382 054.04 0.56Total securities portfolio 222 111 551.54 89.61DerivativesMinus signs denote short positionsEquity index derivatives -329 344.38 -0.13(Receivables/payables)Equity index futuresS&P 500 EMINI Future 12/2011 (CME) USD . . . . . . . . . . Count -14500 -329 344.38 -0.13Currency derivatives 6 163 084.39 2.49Currency futures (long)Open positionsEUR/USD 25.00 million . . . . . . . . . . . . . . . . . . . . . . . . . . . -172 913.31 -0.07USD/EUR 100.00 million . . . . . . . . . . . . . . . . . . . . . . . . . . 3 039 621.79 1.2361
<strong>DWS</strong> IntervestCount/ Quantity/ Purchases/ Sales/ Market price Total market % ofDescription currency principal additions disposals value in net assets(– / ’000) amount in the reporting period EURCurrency futures (short)Open positionsEUR/USD 32.00 million . . . . . . . . . . . . . . . . . . . . . . . . . . . 1 783 760.91 0.72Option contractsCurrency optionsCall USD/EUR (DBK) 22.12.11 Strike 1.325 (OTC FFM) . . Count 65 000 000 EUR 0.0233 1 512 615.00 0.61Cash and non-securitized money market instruments 19 343 222.16 7.80Cash at bank 19 343 222.16 7.80Demand deposits at CustodianEUR deposits . . . . . . . . . . . . . . . . . . . . . . . . . . . . . . . . . . EUR 8 263 557.38 % 100 8 263 557.38 3.33Deposits in other EU/EEA currencies . . . . . . . . . . . . . . . . EUR 2 196 299.32 % 100 2 196 299.32 0.89Deposits in non-EU/EEA currenciesCanadian dollar . . . . . . . . . . . . . . . . . . . . . . . . . . . . . . . . . CAD 120 682.77 % 100 85 570.17 0.03Swiss franc . . . . . . . . . . . . . . . . . . . . . . . . . . . . . . . . . . . . CHF 1 217 269.81 % 100 997 884.01 0.40Hong Kong dollar . . . . . . . . . . . . . . . . . . . . . . . . . . . . . . . HKD 50 234 431.54 % 100 4 766 452.71 1.92Japanese yen . . . . . . . . . . . . . . . . . . . . . . . . . . . . . . . . . . JPY 58 435 932.00 % 100 563 129.88 0.23South Korean won . . . . . . . . . . . . . . . . . . . . . . . . . . . . . . . KRW 2 745 929 631.00 % 100 1 718 844.36 0.69New Zealand dollar . . . . . . . . . . . . . . . . . . . . . . . . . . . . . . NZD 0.18 % 100 0.10 0.00Singapore dollar . . . . . . . . . . . . . . . . . . . . . . . . . . . . . . . . SGD 809 625.80 % 100 461 358.63 0.19Taiwan dollar . . . . . . . . . . . . . . . . . . . . . . . . . . . . . . . . . . . TWD 3 204 154.20 % 100 77 690.45 0.03U.S. dollar . . . . . . . . . . . . . . . . . . . . . . . . . . . . . . . . . . . . . USD 287 337.66 % 100 212 435.15 0.09Other assets 792 730.77 0.32Interest receivable . . . . . . . . . . . . . . . . . . . . . . . . . . . . . . EUR 7 153.32 % 100 7 153.32 0.00Dividends receivable . . . . . . . . . . . . . . . . . . . . . . . . . . . . . EUR 448 642.00 % 100 448 642.00 0.18Withholding tax claims . . . . . . . . . . . . . . . . . . . . . . . . . . . EUR 326 472.54 % 100 326 472.54 0.13Other receivables . . . . . . . . . . . . . . . . . . . . . . . . . . . . . . . EUR 10 462.91 % 100 10 462.91 0.00Receivables from share certificate transactions EUR 151 082.06 % 100 151 082.06 0.06Other liabilities -315 089.10 -0.13Liabilities from cost item . . . . . . . . . . . . . . . . . . . . . . . . . . EUR -309 857.60 % 100 -309 857.60 -0.13Additional other liabilities . . . . . . . . . . . . . . . . . . . . . . . . . EUR -5 231.50 % 100 -5 231.50 0.00Liabilities from share certificate transactions EUR -57 062.22 % 100 -57 062.22 -0.02Net assets 247 860 175.22 100.00Net asset value per unit 99.85Number of units outstanding 2 482 227.592Negligible rounding errors may have arisen due to the rounding of calculated percentages.Composition of the reference portfolio (risk benchmark) (according to article 28 (3), of the Derivatives Regulation (DerivateV))MSCI Equities The World Index EUR TRMarket risk exposure (value-at-risk) (according to article 28 (2), sentences 1 and 2, of the Derivatives Regulation (DerivateV))Lowest market risk exposure . . . . . . . . . . . . . . . . . . % 3.113Highest market risk exposure . . . . . . . . . . . . . . . . . . % 10.066Average market risk exposure . . . . . . . . . . . . . . . . . % 6.744The values-at-risk were calculated for the period from October 1, 2010, through September 30, 2011, using historical simulation with a 99% confidence level, a 10-day holding period andan effective historical observation period of one year. The risk in a reference portfolio that does not contain derivatives is used as the measurement benchmark. Market risk is the risk tothe fund from an unfavorable change in market prices. The investment company determines the potential market risk by means of the qualified approach as defined by the DerivativesRegulation.In the reporting period, the average leverage effect from the use of derivatives was 0.6, whereby the total of the nominal amounts of the derivates in relation to the fund’s assets wasused for the calculation (nominal value method).62
<strong>DWS</strong> IntervestMarket abbreviationsFutures exchangesCME = Chicago Mercantile Exchange (CME) - Index and Options Market Division (IOM)OTC FFM = Over the counter Frankfurt/MainExchange rates (indirect quotes)As of September 30, 2011Canadian dollar . . . . . . . . . . . . . . . . . CAD 1.410337 = EUR 1Swiss franc . . . . . . . . . . . . . . . . . . . . . CHF 1.219851 = EUR 1British pound . . . . . . . . . . . . . . . . . . . GBP 0.868596 = EUR 1Hong Kong dollar . . . . . . . . . . . . . . . . HKD 10.539165 = EUR 1Japanese yen . . . . . . . . . . . . . . . . . . . JPY 103.769902 = EUR 1South Korean won . . . . . . . . . . . . . . . KRW 1 597.544080 = EUR 1Norwegian krone . . . . . . . . . . . . . . . . NOK 7.893246 = EUR 1New Zealand dollar . . . . . . . . . . . . . . . NZD 1.771235 = EUR 1Singapore dollar . . . . . . . . . . . . . . . . . SGD 1.754873 = EUR 1Taiwan dollar . . . . . . . . . . . . . . . . . . . . TWD 41.242574 = EUR 1U.S. dollar . . . . . . . . . . . . . . . . . . . . . USD 1.352590 = EUR 1Notes on the valuationThe Custodian shall determine the value with the participation of the investment company. The Custodian generally bases its valuation on external sources.If no trading prices are available, prices are determined with the aid of valuation models (derived market values) which are agreed between the Custodian and the investment companyand which are based as far as possible on market parameters. This procedure is subject to an ongoing monitoring process. The plausibility of price information from third parties is checkedthrough other pricing sources, model calculations or other suitable procedure.Investments reported in this report are not valued at derived market values.Footnotes3) These securities were completely or partly transferred under securities loans. The equivalent value of the lent securities is EUR 6 133 184.01.63
<strong>DWS</strong> IntervestTransactions completed during the reporting period that no longer appear in the investment portfolioPurchases and sales of securities, investment fund units and promissory note loans (Schuldscheindarlehen); market classifications are as of the reporting dateDescriptionCount/currency(– / ’000)Purchases/additionsSales/disposalsDescriptionCount/currency(– / ’000)Purchases/additionsSales/disposalsSecurities traded on an exchangeEquitiesGammon Gold (CA36467T1066) . . . . . . . . . . . . . . . . Count 850 000 850 000Goldcorp (CA3809564097) . . . . . . . . . . . . . . . . . . . . Count 35 000 185 000MEG Energy (CA5527041084) . . . . . . . . . . . . . . . . . Count 105 000 105 000New Gold (CA6445351068) . . . . . . . . . . . . . . . . . . . Count 475 000 475 000Nexen (CA65334H1029) . . . . . . . . . . . . . . . . . . . . . . Count 35 000 485 000ABB Reg. (CH0012221716) . . . . . . . . . . . . . . . . . . . Count 625 000 625 000Cie Financière Richemont A (CH0045039655) . . . . . Count 80 000 80 000Areva Pref. B (FR0004275832) . . . . . . . . . . . . . . . . . Count 166 500 182 500Areva Right (FR0010986174) . . . . . . . . . . . . . . . . . . Count 160 000 160 000BNP Paribas (FR0000131104) . . . . . . . . . . . . . . . . . Count 245 000 245 000Crucell (NL0000358562) . . . . . . . . . . . . . . . . . . . . . . Count 300 000Deutsche Bank Reg. (DE0005140008) . . . . . . . . . . . Count 250 000 300 000Deutsche Bank Right (DE000A1E8H87) . . . . . . . . . . Count 50 000Deutsche Börse Reg. (DE0005810055) . . . . . . . . . . Count 235 000 235 000Electricité de France (E.D.F.) Reg. (FR0010242511) . Count 105 000 255 000Koninklijke Philips Electronics (NL0000009538) . . . . Count 175 000 175 000Nokia (FI0009000681) . . . . . . . . . . . . . . . . . . . . . . . . Count 2 350 000 2 750 000Royal Dutch Shell Cl. A (GB00B03MLX29) . . . . . . . . Count 100 000 450 000Societe Generale (FR0000130809) . . . . . . . . . . . . . . Count 355 000 355 000TNT (NL0000009066) . . . . . . . . . . . . . . . . . . . . . . . . Count 325 000 325 000Umicore (new) (BE0003884047) . . . . . . . . . . . . . . . Count 85 000 85 000Wolters Kluwer (NL0000395903) . . . . . . . . . . . . . . . Count 175 000Barclays (GB0031348658) . . . . . . . . . . . . . . . . . . . . Count 2 100 000 2 100 000Centrica (GB00B033F229) . . . . . . . . . . . . . . . . . . . . Count 700 000Scottish and Southern Energy (GB0007908733) . . . Count 50 000 600 000Bank of China Cl.H (new) (CNE1000001Z5) . . . . . . . Count 5 150 000 5 150 000Beijing Capital Intern. Airport Co. Cl.H(new) (CNE100000221) . . . . . . . . . . . . . . . . . . . . . . . Count 250 000 7 500 000China Construction Bank Cl.H (new)(CNE1000002H1) . . . . . . . . . . . . . . . . . . . . . . . . . . . Count 3 000 000 3 000 000China Yurun Food Group (BMG211591018) . . . . . . . Count 2 150 000 2 150 000The Industrial & Commercial Bank of ChinaCl.H (CNE1000003G1) . . . . . . . . . . . . . . . . . . . . . . . Count 3 000 000 3 000 000KDDI Corp. (JP3496400007) . . . . . . . . . . . . . . . . . . . Count 750 2 100Kubota Corp. (JP3266400005) . . . . . . . . . . . . . . . . . Count 625 000 625 000Nomura Holdings (JP3762600009) . . . . . . . . . . . . . . Count 1 000 000NTT Docomo (JP3165650007) . . . . . . . . . . . . . . . . . Count 3 750Olympus Corp. (JP3201200007) . . . . . . . . . . . . . . . . Count 55 000 305 000Panasonic Corp. (JP3866800000) . . . . . . . . . . . . . . . Count 225 000 975 000Shin-Etsu Chemical Co. (JP3371200001) . . . . . . . . . Count 160 000 160 000Sumitomo Electric Industries (JP3407400005) . . . . Count 125 000 700 000Sumitomo Mitsui Financial Group (JP3890350006) . Count 125 000 390 000Suzuki Motor Corp. (JP3397200001) . . . . . . . . . . . . Count 485 000 485 000Takeda Pharmaceutical Co. (JP3463000004) . . . . . . Count 105 000Yakult Honsha Co. (JP3931600005) . . . . . . . . . . . . . Count 35 000 150 000Samsung Electronics Co. (KR7005930003) . . . . . . . Count 7 500 7 500Statoil (NO0010096985) . . . . . . . . . . . . . . . . . . . . . . Count 100 000 425 000Anadarko Petroleum Corp. (US0325111070) . . . . . . Count 62 500 62 500Babcock & Wilcox (new) (US05615F1021) . . . . . . . . Count 235 000Bank of America Corp. (US0605051046) . . . . . . . . . Count 525 000 525 000Becton, Dickinson & Co. (US0758871091) . . . . . . . . Count 70 000CF Industries Holdings (US1252691001) . . . . . . . . . Count 48 000 48 000CME Group (US12572Q1058) . . . . . . . . . . . . . . . . . Count 26 000 26 000Colgate-Palmolive Co. (US1941621039) . . . . . . . . . . Count 80 000 80 000Corning (US2193501051) . . . . . . . . . . . . . . . . . . . . . Count 200 000Devon Energy Corp. (US25179M1036) . . . . . . . . . . Count 80 000EOG Resources (US26875P1012) . . . . . . . . . . . . . . Count 45 000 45 000Fluor Corp. (new) (US3434121022) . . . . . . . . . . . . . Count 105 000Hess (US42809H1077) . . . . . . . . . . . . . . . . . . . . . . . Count 50 000 50 000Intercontinental Exchange (US45865V1008) . . . . . . Count 66 500 66 500Marathon Oil Corp. (US5658491064) . . . . . . . . . . . . Count 115 000Marvell Technology Group (BMG5876H1051) . . . . . Count 325 000 325 000Medtronic (US5850551061) . . . . . . . . . . . . . . . . . . . Count 115 000 115 000NetApp (new) (US64110D1046) . . . . . . . . . . . . . . . . Count 65 000 65 000NVIDIA Corp. (US67066G1040) . . . . . . . . . . . . . . . . Count 425 000Overseas Shipholding Group (US6903681053) . . . . Count 275 000 275 000Quanta Services (US74762E1029) . . . . . . . . . . . . . . Count 100 000 375 000Rowan Companies (US7793821007) . . . . . . . . . . . . Count 75 000 75 000Schlumberger N.Y. Shares (AN8068571086) . . . . . . Count 75 000 75 000SK Telecom ADR (US78440P1084) . . . . . . . . . . . . . Count 100 000 400 000Sprint Nextel Corp. FON S. 1 (US8520611000) . . . . Count 1 450 000 1 450 000SPX Corp. (US7846351044) . . . . . . . . . . . . . . . . . . . Count 40 000 40 000Symantec Corp. (US8715031089) . . . . . . . . . . . . . . Count 150 000 700 000Take-Two Interactive Software (US8740541094) . . . Count 50 000 1 050 000Teekay Shipping (MHY8564W1030) . . . . . . . . . . . . . Count 265 000 265 000The Estée Lauder Companies (US5184391044) . . . Count 85 000The Mosaic Co. (US61945A1079) . . . . . . . . . . . . . . Count 50 000 50 000Derivatives (option premiums realized in opening transactions, or total optionstransactions; in the case of warrants, purchases and sales are shown)WarrantsWarrants on currency derivativesAdditionsDisposalsCurrency warrantsCommerzbank WRT 15.03.11 EUR/USD(DE000CM4UM28) . . . . . . . . . . . . . . . . . . . . . . . . . . Count 1 000 000 2 500 000Commerzbank WRT 24.06.11 EUR/USD(DE000CM51LG3) . . . . . . . . . . . . . . . . . . . . . . . . . . . Count 1 700 000 1 700 000DZ Bank WRT 09.12.10 EUR/USD(DE000DZ6NA52) . . . . . . . . . . . . . . . . . . . . . . . . . . . Count 1 100 000Value (’000)Futures contractsEquity index futuresContracts purchased: EUR 724 540(Underlyings: DAX (performance index), Dow Jones Euro STOXXBank, Euro STOXX 50 Price Euro, Nikkei 225. S&P 500 Index)Contracts sold: EUR 98 486(Underlyings: DAX (performance index), Euro STOXX 50 PriceEuro, Nikkei 225)Currency futuresFutures contracts to purchase currenciesEUR/JPY EUR 204 114EUR/USD EUR 89 987USD/EUR EUR 277 879Futures contracts to sell currenciesEUR/JPY EUR 89 296EUR/USD EUR 154 899JPY/EUR EUR 22 098USD/EUR EUR 113 85964
<strong>DWS</strong> IntervestDerivatives (option premiums realized in opening transactions, or total optionstransactions; in the case of warrants, purchases and sales are shown)Option contractsSecurities optionsValue (’000)Equity optionsCall options purchased: EUR 178 766(Underlyings: DUMMY SHARE, E.ON Reg., Select Sector SPDR- Financial (Shares of Benef.))Put options sold: EUR 30 000(Underlyings: E.ON Reg.)Options on equity index derivativesOptions on equity indicesCall options purchased: EUR 5 460 458(Underlyings: DAX (performance index), Euro STOXX 50 PriceEuro, S&P 500 Index)Put options purchased: EUR 12 514 718(Underlyings: DAX (performance index), Euro STOXX 50 PriceEuro, Nasdaq 100 Index, S&P 500 Index)Put options sold: EUR 53 000(Underlyings: Euro STOXX 50 Price Euro)Securities loans (total transactions, at the value agreed at the closing of the loancontract)Value (’000)Perpetual EUR 407 045(Security description: Allianz SE, Alnylam Pharmaceuticals, Alstom,Anglo American, Areva, Areva Pref. B, Areva Right, AtosOrigin, AXA, Barrick Gold, BNP Paribas, Bouygues, CanadianNatural Resources, Credit Suisse Group Reg., Crucell, DeutscheBank Reg., Deutsche Post Reg., Deutsche Telekom Reg., E.ONReg., Electricité de France (E.D.F.) Reg., Eli Lilly &Co., EnCana Corp, France Telecom, Gazprom ADR, GdF Suez,Goldcorp, ING Groep CVA, Koninklijke KPN, Koninklijke PhilipsElectronics, Lawson, LVMH Moët Hennessy Louis Vuitton (C.R.),Marathon Oil Corp., Microsoft Corp., Nokia, Overseas ShipholdingGroup, Petroleum Geo-Services (new), PostNL, Quanta Services,Roche Holding Profitsh., Royal Dutch Shell Cl. A, RWE Ord.,Sanofi, SAP, Scottish and Southern Energy, SK Telecom ADR,Societe Generale, Statoil, Suez Environnement, Suncor Energy(new), Symantec Corp., Telekomunikasi Indonesia ADR, TheEstée Lauder Companies, TNT Express, Total, UBS Reg., Umicore(new), Unilever, Vivendi, Yamana Gold)Options on currency derivativesCurrency optionsCall options purchased: EUR 159 375(Underlyings: Call USD/EUR (CSI) 14.12.11 Strike 1.375.Call USD/EUR (DBK) 14.12.11 Strike 1.375. Call USD/EUR(DBK) 19.10.11 Strike 1.35)Put options sold: EUR 87 000(Underlyings: Put USD/EUR (DBK) 19.10.11 Strike 1.45)65
<strong>DWS</strong> IntervestStatement of income and expenses (incl. income adjustment)Performance of the investment fund 2010/2011for the period from October 1, 2010, through September 30, 2011I. Income1. Dividends from domestic issuers . . . . . . . . . . . . . . . . . . EUR 833 296.052. Dividends from foreign issuers(before withholding tax) . . . . . . . . . . . . . . . . . . . . . . . . . EUR 4 500 884.073. Interest from investments of liquid assets in Germany . EUR 155 359.654. Income from securities lendingand repurchase agreements . . . . . . . . . . . . . . . . . . . . . . EUR 411 394.66including:from securities lending . . . . . . . . .EUR 411 394.665. Deduction for foreign withholding tax . . . . . . . . . . . . . . EUR -229 909.736. Other income . . . . . . . . . . . . . . . . . . . . . . . . . . . . . . . . . EUR 1 924 035.30including:Compensation payments . . . . . . .EUR 1 697 592.61Other . . . . . . . . . . . . . . . . . . . . . . .EUR 226 442.69Total income . . . . . . . . . . . . . . . . . . . . . . . . . . . . . . . . . . . . EUR 7 595 060.00II. Expenses1. Interest on borrowings . . . . . . . . . . . . . . . . . . . . . . . . . . EUR -3 040.732. Management fee . . . . . . . . . . . . . . . . . . . . . . . . . . . . . . EUR -4 298 546.84including:All-in fee . . . . . . . . . . . . . . . . . . . .EUR -4 298 546.843. Other expenses . . . . . . . . . . . . . . . . . . . . . . . . . . . . . . . EUR -218 652.17including:Performance-based fee fromsecurities lending income . . . . . . .EUR -205 697.30Legal expenses . . . . . . . . . . . . . . .EUR -12 853.61Other . . . . . . . . . . . . . . . . . . . . . . .EUR -101.26Total expenses . . . . . . . . . . . . . . . . . . . . . . . . . . . . . . . . . . EUR -4 520 239.74I. Value of the investment fund at the beginningof the fiscal year . . . . . . . . . . . . . . . . . . . . . . . . . . . . . . EUR 494 878 410.001. Previous year's distribution or tax abatement . . . . . . . . . EUR -2 556 934.192. Net inflows . . . . . . . . . . . . . . . . . . . . . . . . . . . . . . . . . . . EUR -174 833 426.22a) Inflows from subscriptions . . . . . . . . . . . . . . . . . . . . EUR 377 078 073.68b) Outflows from redemptions . . . . . . . . . . . . . . . . . . . EUR -551 911 499.903. Income adjustment and reimbursed expenses . . . . . . . . EUR -8 160 101.754. Net investment income . . . . . . . . . . . . . . . . . . . . . . . . . . EUR 3 074 820.265. Realized gains . . . . . . . . . . . . . . . . . . . . . . . . . . . . . . . . . EUR 62 908 542.396. Realized losses . . . . . . . . . . . . . . . . . . . . . . . . . . . . . . . . EUR -102 294 598.697. Net change in unrealized appreciation/depreciation . . . . EUR -25 156 536.58II. Value of the investment fund atthe end of the fiscal year . . . . . . . . . . . . . . . . . . . . . . . EUR 247 860 175.22Distribution policy of the investment fundTotalPer unitI. Calculation of distribution1. Balance brought forwardfrom previous year . . . . . . . . . . . . . . . . . . EUR 45 584 904.25 18.362. Net gain/loss for the fiscal year . . . . . . . . EUR -36 311 236.04 -14.62II. Available for distribution . . . . . . . . . . . . EUR 9 273 668.21 3.741. Balance carried forward . . . . . . . . . . . . . . EUR -6 915 552.00 -2.79III. Total distribution . . . . . . . . . . . . . . . . . . EUR 2 358 116.21 0.95III. Net investment income . . . . . . . . . . . . . . . . . . . . . . . . EUR 3 074 820.26IV. Sale transactionsRealized gains . . . . . . . . . . . . . . . . . . . . . . . . . . . . . . . . . . . . EUR 62 908 542.39Realized losses . . . . . . . . . . . . . . . . . . . . . . . . . . . . . . . . . . . EUR -102 294 598.69Capital gains/losses . . . . . . . . . . . . . . . . . . . . . . . . . . . . . . EUR -39 386 056.30V. Net gain/loss for the fiscal year . . . . . . . . . . . . . . . . . . EUR -36 311 236.04Total expense ratio (in accordance with article 41 (2) of the InvGThe total expense ratio was 1.45% p.a. The TER expresses total expenses and fees(excluding transaction costs) as a percentage of the fund’s average net assets for a givenfiscal year.As well, the additional income from securities lending resulted in a performance-basedfee of 0.065% p.a. calculated on the fund’s average net assets.Information provided in accordance with article 41 (4) and (5) of the InvG (Costs and CostTransparency).In the fiscal year from October 1, 2010, through September 30, 2011, the investmentcompany, <strong>DWS</strong> Investment GmbH, was not reimbursed for the fees and expenses paidby <strong>DWS</strong> Intervest to the Custodian and other third parties, except in the form of financialinformation provided by brokers for research purposes.1. Final distributiona) Cash distribution . . . . . . . . . . . . . . . . . . . EUR 2 267 832.82 0.92b) Withholding tax oncapital income withheld . . . . . . . . . . . . . . EUR 85 576.67 0.03c) Solidarity surcharge withheld . . . . . . . . . . EUR 4 706.72 0.00Changes in net assets and in the net asset value perunit over the last three yearsNet assetsat the end ofthe fiscal year EURNet assetvalue perunit EUR2011 . . . . . . . . . . . . . . . . . . . . . . . . . . . . . . . . . . . . 247 860 175.22 99.852010 . . . . . . . . . . . . . . . . . . . . . . . . . . . . . . . . . . . . 494 878 410.00 122.432009 . . . . . . . . . . . . . . . . . . . . . . . . . . . . . . . . . . . . 393 320 441.58 124.542008 . . . . . . . . . . . . . . . . . . . . . . . . . . . . . . . . . . . . 333 567 177.95 116.61An all-in fee of 1.45% per year is payable to the investment company under the Terms ofContract. Of this annual fee, the investment company in turn pays up to 0.15% to theCustodian and up to 0.05% to other parties (for printing and publication costs, auditing andother items). Of its own portion of the all-in fee, the investment company pays less than10% in commissions to distributors of the fund; the specific percentage paid is based onthe balance of units distributed.Transaction costsThe transaction costs paid in the reporting period amounted to EUR 5 132 336.06.The transaction costs include all costs that were reported or settled separately for theaccount of the fund in the reporting period and are directly connected to the purchase orsale of assets.66Transactions processed for the account of the fund’s assets via closely related companies (based on major holdings of the Deutsche Bank Group)The share of transactions conducted for the account of the investment fund’s assets via brokers that are closely related companies and persons (share of five percent and above), amountedto 5.40 percent of all transactions. The total volume was EUR 107 307 990.34.
Independentauditor’s reportKPMG issued an unqualified auditor's report forthe full annual report in accordance with article 44 (5)of the German Investment Act. The translation of theauditor's report is as follows:To <strong>DWS</strong> Investment GmbH, Frankfurt/Main, GermanyIn accordance with article 44 (5) of the German Investment Act (Investmentgesetz;InvG), <strong>DWS</strong> Investment GmbH commissioned us to perform the audit of the annualreport of the investment fund <strong>DWS</strong> Intervest for the fiscal year from October 1, 2010,through September 30, 2011.Responsibility of the legal representativesThe preparation of the annual report according to the provisions of the InvG is theresponsibility of the legal representatives of the investment company.Responsibility of the auditorsOur responsibility is to express an opinion on the annual report based on our audit.We conducted our audit in accordance with article 44 (5) InvG and generally acceptedGerman standards for the audit of financial statements promulgated by the Institut derWirtschaftsprüfer (Institute of Public Auditors in Germany; IDW). Those standardsrequire that we plan and perform the audit such that misstatements materially affectingthe annual report are detected with reasonable assurance. Knowledge of themanagement of the investment fund and expectations as to possible misstatementsare taken into account in the determination of audit procedures. The effectiveness ofthe accounting-related internal control system and the evidence supporting thedisclosures in the annual report are examined primarily on a test basis within theframework of the audit. The audit includes assessing the accounting principles usedfor the annual report and significant estimates made by the legal representatives ofthe investment company. In our view, our audit provides a reasonably secure basis forour evaluation.Audit opinionOur audit has not led to any reservations.In our opinion, based on the findings of our audit, the annual report complies with thelegal requirements.Frankfurt/Main, December 20, 2011KPMG AGWirtschaftsprüfungsgesellschaftHornschuWirtschaftsprüferNeufWirtschaftsprüfer67
2010The formatused for complete datesin securities descriptions in the investmentportfolio is “day/month/year”.Annual report<strong>DWS</strong> Akkumula2011
<strong>DWS</strong> AkkumulaInvestment objective andperformance in the reporting period<strong>DWS</strong> Akkumula invested worldwide incompanies with strong earnings, solidbusiness models and attractive valuations.Essentially, the fund focused onhigh quality stocks from high-dividendsectors. In the fiscal year from the beginningof October 2010, through theend of September 2011, the fundrecorded a decline of 13.0% per unit(BVI method) and was thus behind its<strong>DWS</strong> AKKUMULAFive-year performance124116108100928476689/06* 9/07 9/08 9/09 9/109/11<strong>DWS</strong> Akkumula* 9/2006 = 100Data on euro basis“BVI method” performance, i.e., excluding the initial sales charge. Past performance is no guide to future results.As of: September 30, 2011benchmark, the MSCI World, whichfell 3.2%.Investment policyin the reporting periodThe management saw major risks forthe investment fund in an economicslowdown, compounded by the highsovereign debt of western countriesand the lack of unified political processesin some nations. For risk reasons,the fund therefore focused on higherquality value stocks. The more defensiveorientation of the portfolio, how -ever, dampened the fund’s performance<strong>DWS</strong> AKKUMULA vs. benchmarkPerformance at a glancein %1260-6-12-18-24-13.0-3.21 year-8.4+7.83 years-13.9-16.85 years<strong>DWS</strong> AkkumulaBenchmark MSCI WorldData on euro basis“BVI method” performance, i.e., excluding theinitial sales charge. Past performance is no guideto future results.As of: September 30, 2011in the fourth quarter of 2010, as cyclical,growth-oriented stocks enjoyed strongdemand during the upward trend in thecapital markets in light of the initiallyfavorable climate of the global economy.In addition, the overweighting ofinvestments in the euro area had anegative impact. European equitiesappeared to be valued more attractivelythan U.S. securities. Furthermore, thecontinuing high unemployment figuresand the failure of the house market torecover indicated weaker U.S. consumerspending. As the EU sovereigndebt problems deteriorated, Europeanstocks came under greater pressure. Inview of this, the European weighting inthe fund was reduced towards the endof the reporting period. The higher cashratio boosted performance at the end ofthe reporting period.At sector level, <strong>DWS</strong> Akkumula bene -fited from its selection of individualequities in the commodities sector.Investments in fertilizer producers,such as Potash Corporation ofSaskatchewan, profited from ongoinghigh demand and rising sales prices,particularly in the potash fertilizer segment.Health care and pharmaceuticalstocks, which were overweighted inthe portfolio, had a positive impact onperformance. Attractively-valued U.S.pharmaceutical manufacturer Pfizer70
impressed the markets with high dividendyields and measures to increaseproductivity in the area of research anddevelopment. Both its defensive characterand the high proportion of sales inemerging markets prompted investmentin GlaxoSmithKline. In addition,the product range of the company iswell-positioned with long-term patents.Individual financial stocks recorded adisappointing performance. The price ofUniCredit equities came under pressureas the European debt crisis deteriorated,due to the high level of investmentin Italian government bonds. Bank ofAmerica also suffered considerably dueto ongoing law suits relating to mortgagetransactions before the latestfinancial crisis. In the industrial sector,PostNL and Koninklijke Philips Elec -tronics recorded below-average performance.PostNL failed to live up to expectationsafter spinning off the Dutchlogistics group TNT. At Philips, thelighting technology and consumer electronicssegments performed poorly,which could not be offset by the stablemedical technology business area.Utilities companies, including E.ON,were sharply reduced. Plans to switchoff nuclear power stations and otherpotential regulatory interventions wereamong the factors weighing on equityprices. The hedge in the Japanese yenwas completely liquidated in the courseof the year.<strong>DWS</strong> AKKUMULA: Summary statement of assetsInvestment focus by sectorEquities 87.2% (September 30, 2011) / Equities 87.5% (September 30, 2010)Health CareIndustrialsFinancialsInformation TechnologyEnergyTelecommunication ServicesMaterialsConsumer StaplesConsumer DiscretionaryUtilitiesTime depositCertificatesWarrantsBonds*Cash and other assets0.70.6In % of the fund’s net assets in bondsas of September 30, 2011In % of the fund’s net assets in bondsas of September 30, 2010*(incl. pro-rata accrued interest)0.0 0.30.11.72.03.33.24.74.94.916.213.914.612.012.510.812.113.07.88.96.59.86.17.58.27.23.0 3.50 3 6 9 12 15 18Security code: 847 402ISIN: DE0008474024As of: September 30, 2011Main sources of capital gains/lossesThe main sources of capital gains wereprofits realized on equities and bonds.Currency hedging transactions generatedlosses in forward currency transactions.71
Annual report<strong>DWS</strong> AkkumulaInvestment portfolio – September 30, 2011Count/ Quantity/ Purchases/ Sales/ Market price Total market % ofDescription currency principal additions disposals value in net assets(– / ’000) amount in the reporting period EURSecurities traded on an exchange 2 318 433 923.70 88.05EquitiesCanadian Natural Resources (CA1363851017) . . . . . . . . . Count 500 000 500 000 CAD 31.5200 11 174 634.15 0.42Canadian Pacific Railway (CA13645T1003) . . . . . . . . . . . Count 550 000 CAD 51.7200 20 169 647.40 0.77Nexen (CA65334H1029) . . . . . . . . . . . . . . . . . . . . . . . . . . Count 1 475 000 250 000 775 000 CAD 16.4800 17 235 596.88 0.65Suncor Energy (new) (CA8672241079) . . . . . . . . . . . . . . . Count 750 000 750 000 CAD 27.7100 14 735 839.73 0.56Nestlé Reg. (CH0038863350) . . . . . . . . . . . . . . . . . . . . . . Count 1 000 000 1 000 000 CHF 49.8100 40 832 855.82 1.55UBS Reg. (CH0024899483) . . . . . . . . . . . . . . . . . . . . . . . . Count 3 000 000 3 000 000 CHF 10.7400 26 413 061.92 1.00AEGON (NL0000303709) . . . . . . . . . . . . . . . . . . . . . . . . . Count 8 000 000 8 000 000 9 400 000 EUR 3.0670 24 536 000.00 0.93Allianz SE (DE0008404005) 3) . . . . . . . . . . . . . . . . . . . . . . Count 750 000 700 000 450 000 EUR 69.7100 52 282 500.00 1.99BNP Paribas (FR0000131104) . . . . . . . . . . . . . . . . . . . . . . Count 500 000 1 300 000 800 000 EUR 29.8750 14 937 500.00 0.57Compagnie de Saint-Gobain (C.R.)(FR0000125007) 3) . . . . . . . . . . . . . . . . . . . . . . . . . . . . . . Count 600 000 600 000 EUR 28.5800 17 148 000.00 0.65Deutsche Bank Reg. (DE0005140008) 3) . . . . . . . . . . . . . Count 1 000 000 2 700 000 1 950 000 EUR 26.2200 26 220 000.00 1.00Deutsche Post Reg. (DE0005552004) 3) . . . . . . . . . . . . . Count 2 500 000 2 000 000 EUR 9.6000 24 000 000.00 0.91Deutsche Telekom Reg. (DE0005557508) 3) . . . . . . . . . . Count 5 500 000 11 500 000 EUR 8.7700 48 235 000.00 1.83E.ON Reg. (DE000ENAG999) 3) . . . . . . . . . . . . . . . . . . . . Count 2 500 000 3 500 000 EUR 16.4250 41 062 500.00 1.56France Telecom (FR0000133308) 3) . . . . . . . . . . . . . . . . . Count 2 500 000 500 000 1 000 000 EUR 12.2250 30 562 500.00 1.16GdF Suez (FR0010208488) . . . . . . . . . . . . . . . . . . . . . . . . Count 1 200 000 1 550 000 EUR 22.5850 27 102 000.00 1.03ING Groep CVA (NL0000303600) . . . . . . . . . . . . . . . . . . . Count 10 000 000 4 000 000 2 500 000 EUR 5.4110 54 110 000.00 2.06Ingenico (FR0000125346) . . . . . . . . . . . . . . . . . . . . . . . . . Count 279 930 427 200 147 270 EUR 28.0300 7 846 437.90 0.30Koninklijke Philips Electronics(NL0000009538) 3) . . . . . . . . . . . . . . . . . . . . . . . . . . . . . . Count 1 750 000 500 000 500 000 EUR 13.3650 23 388 750.00 0.89Nexans (FR0000044448) 3) . . . . . . . . . . . . . . . . . . . . . . . . Count 380 000 370 000 EUR 44.0800 16 750 400.00 0.64PostNL (NL0009739416) . . . . . . . . . . . . . . . . . . . . . . . . . . Count 6 250 000 6 250 000 EUR 3.3280 20 800 000.00 0.79Qiagen (NL0000240000) 3) . . . . . . . . . . . . . . . . . . . . . . . . Count 2 600 000 1 750 000 EUR 10.5300 27 378 000.00 1.04Royal Dutch Shell Cl. A (GB00B03MLX29) . . . . . . . . . . . . Count 1 500 000 2 000 000 EUR 22.9900 34 485 000.00 1.31Saft Groupe Reg. (FR0010208165) . . . . . . . . . . . . . . . . . . Count 230 000 155 500 EUR 20.3450 4 679 350.00 0.18Sanofi (FR0000120578) 3) . . . . . . . . . . . . . . . . . . . . . . . . . Count 801 500 801 500 EUR 49.5150 39 686 272.50 1.51SAP (DE0007164600) 3) . . . . . . . . . . . . . . . . . . . . . . . . . . Count 1 350 000 1 600 000 250 000 EUR 37.9650 51 252 750.00 1.95Siemens Reg. (DE0007236101) 3) . . . . . . . . . . . . . . . . . . Count 150 000 200 000 500 000 EUR 67.4200 10 113 000.00 0.38Verbund AG (AT0000746409) . . . . . . . . . . . . . . . . . . . . . . Count 750 000 EUR 21.4350 16 076 250.00 0.61VINCI (FR0000125486) 3) . . . . . . . . . . . . . . . . . . . . . . . . . Count 850 000 850 000 EUR 32.0050 27 204 250.00 1.03Vivendi (FR0000127771) 3) . . . . . . . . . . . . . . . . . . . . . . . . Count 3 500 000 2 000 000 EUR 15.1950 53 182 500.00 2.02Barclays (GB0031348658) . . . . . . . . . . . . . . . . . . . . . . . . . Count 12 000 000 5 000 000 GBP 1.6125 22 277 330.31 0.85BHP Billiton (GB0000566504) . . . . . . . . . . . . . . . . . . . . . . Count 1 500 000 1 800 000 300 000 GBP 17.2250 29 746 280.20 1.13GlaxoSmithkline (GB0009252882) . . . . . . . . . . . . . . . . . . Count 2 500 000 GBP 13.2268 38 069 338.33 1.45Sig (GB0008025412) . . . . . . . . . . . . . . . . . . . . . . . . . . . . . Count 11 500 000 GBP 0.9310 12 326 213.80 0.47TUI Travel (GB00B1Z7RQ77) . . . . . . . . . . . . . . . . . . . . . . . Count 15 000 000 15 000 000 GBP 1.4680 25 351 256.51 0.96Vodafone Group (GB00B16GWD56) . . . . . . . . . . . . . . . . . Count 20 000 000 2 000 000 12 000 000 GBP 1.6560 38 130 500.26 1.45Prada Holding (IT0003874101) 3) . . . . . . . . . . . . . . . . . . . Count 1 750 000 2 967 300 1 217 300 HKD 32.8500 5 454 654.14 0.21Astellas Pharma (JP3942400007) . . . . . . . . . . . . . . . . . . . Count 750 000 JPY 2 941.0000 21 256 163.47 0.81Chiyoda Corp. (6366) (JP3528600004) . . . . . . . . . . . . . . . Count 3 000 000 4 000 000 1 000 000 JPY 765.0000 22 116 239.45 0.84Kyocera Corp. (JP3249600002) . . . . . . . . . . . . . . . . . . . . . Count 500 000 JPY 6 540.0000 31 512 027.45 1.20Marubeni Corp. (JP3877600001) . . . . . . . . . . . . . . . . . . . Count 5 000 000 5 000 000 JPY 439.0000 21 152 568.88 0.80Mitsui & Co. (JP3893600001) . . . . . . . . . . . . . . . . . . . . . . Count 2 500 000 2 500 000 JPY 1 134.0000 27 320 060.49 1.04Mitsui O.S.K. Lines (JP3362700001) . . . . . . . . . . . . . . . . Count 8 987 000 JPY 300.0000 25 981 522.08 0.99Nippon Yusen (JP3753000003) . . . . . . . . . . . . . . . . . . . . . Count 10 000 000 JPY 211.0000 20 333 448.90 0.77Shin-Etsu Chemical Co. (JP3371200001) . . . . . . . . . . . . . Count 1 000 000 250 000 JPY 3 830.0000 36 908 582.61 1.40Shiseido Co. (JP3351600006) . . . . . . . . . . . . . . . . . . . . . . Count 2 000 000 2 000 000 JPY 1 507.0000 29 045 030.80 1.10Sumitomo Corp. (JP3404600003) . . . . . . . . . . . . . . . . . . . Count 3 500 000 3 500 000 JPY 967.0000 32 615 430.24 1.24Takeda Pharmaceutical Co. (JP3463000004) . . . . . . . . . . Count 1 000 000 1 500 000 JPY 3 680.0000 35 463 076.76 1.35Tokyo Electron (JP3571400005) . . . . . . . . . . . . . . . . . . . . Count 375 000 JPY 3 560.0000 12 865 002.03 0.49City Development (SG1R89002252) . . . . . . . . . . . . . . . . . Count 4 000 000 SGD 9.5900 21 859 131.69 0.83SembCorp Industries New (SG1R50925390) . . . . . . . . . . Count 8 000 000 2 500 000 500 000 SGD 3.4200 15 590 871.82 0.59Epistar (TW0002448008) . . . . . . . . . . . . . . . . . . . . . . . . . . Count 6 750 000 6 750 000 TWD 54.1000 8 854 321.27 0.34Everlight Electronics Co. (TW0002393006) . . . . . . . . . . . Count 15 000 000 8 500 000 TWD 52.8000 19 203 457.09 0.73Taiwan Semiconductor ManufacturingCo. (TW0002330008) . . . . . . . . . . . . . . . . . . . . . . . . . . . . Count 16 079 998 TWD 70.0000 27 292 182.59 1.04Air Products & Chemicals (US0091581068) . . . . . . . . . . . Count 500 000 500 000 USD 79.2900 29 310 434.06 1.11Anadarko Petroleum Corp. (US0325111070) . . . . . . . . . . Count 900 000 1 500 000 600 000 USD 67.1500 44 680 945.45 1.70Apache Corp. (US0374111054) . . . . . . . . . . . . . . . . . . . . . Count 200 000 100 000 USD 82.8800 12 255 007.06 0.47Apple (US0378331005) . . . . . . . . . . . . . . . . . . . . . . . . . . . Count 190 000 190 000 USD 390.5700 54 863 853.79 2.08Avon Products (US0543031027) . . . . . . . . . . . . . . . . . . . . Count 1 750 000 250 000 USD 19.8300 25 656 333.40 0.97Bank of America Corp. (US0605051046) . . . . . . . . . . . . . Count 4 500 000 500 000 USD 6.3500 21 126 135.78 0.80Comcast Corp. A (US20030N1019) . . . . . . . . . . . . . . . . . Count 1 650 000 1 650 000 USD 21.6900 26 459 237.46 1.00Corning (US2193501051) . . . . . . . . . . . . . . . . . . . . . . . . . Count 3 480 001 2 519 999 USD 12.6600 32 572 185.70 1.2472
<strong>DWS</strong> AkkumulaCount/ Quantity/ Purchases/ Sales/ Market price Total market % ofDescription currency principal additions disposals value in net assets(– / ’000) amount in the reporting period EUREli Lilly & Co. (US5324571083) . . . . . . . . . . . . . . . . . . . . . Count 1 500 000 USD 37.2500 41 309 635.59 1.57Gilead Sciences (US3755581036) . . . . . . . . . . . . . . . . . . . Count 1 250 000 1 250 000 USD 39.2500 36 273 002.17 1.38Google A (US38259P5089) . . . . . . . . . . . . . . . . . . . . . . . . Count 100 000 100 000 USD 527.5000 38 999 253.28 1.48ITT Corp. (US4509111021) . . . . . . . . . . . . . . . . . . . . . . . . Count 500 000 384 032 USD 43.4700 16 069 171.00 0.61Laboratory Corp. America Holdings(US50540R4092) . . . . . . . . . . . . . . . . . . . . . . . . . . . . . . . . Count 400 000 100 000 USD 80.6000 23 835 752.15 0.91Lincoln National Corp. (US5341871094) . . . . . . . . . . . . . . Count 1 750 000 500 000 USD 16.4600 21 296 179.92 0.81Medtronic (US5850551061) . . . . . . . . . . . . . . . . . . . . . . . Count 1 650 000 350 000 USD 33.9600 41 427 187.84 1.57Mosaic (new) (US61945C1036) . . . . . . . . . . . . . . . . . . . . Count 500 000 745 956 245 956 USD 54.2000 20 035 635.34 0.76Murphy Oil Corp. (US6267171022) . . . . . . . . . . . . . . . . . . Count 700 000 300 000 591 384 USD 45.3000 23 443 911.31 0.89Pall Corp. (US6964293079) . . . . . . . . . . . . . . . . . . . . . . . . Count 850 000 150 000 USD 43.9300 27 606 665.73 1.05PepsiCo (US7134481081) . . . . . . . . . . . . . . . . . . . . . . . . . Count 750 000 750 000 USD 62.5800 34 700 093.89 1.32Pfizer (US7170811035) . . . . . . . . . . . . . . . . . . . . . . . . . . . Count 3 500 000 1 500 000 USD 17.9800 46 525 554.68 1.77Plum Creek Timber Co. (US7292511083) . . . . . . . . . . . . . Count 1 000 000 100 000 USD 35.6000 26 319 875.20 1.00Potash Corp. of Saskatchewan(CA73755L1076) . . . . . . . . . . . . . . . . . . . . . . . . . . . . . . . . Count 500 000 1 300 000 800 000 USD 45.4000 16 782 617.05 0.64Quest Diagnostics (US74834L1008) . . . . . . . . . . . . . . . . . Count 750 000 300 000 USD 50.7100 28 118 276.79 1.07Schlumberger N.Y. Shares (AN8068571086) . . . . . . . . . . Count 600 000 285 000 435 000 USD 61.3300 27 205 583.36 1.03Symantec Corp. (US8715031089) 3) . . . . . . . . . . . . . . . . . Count 2 750 000 2 250 000 USD 16.8900 34 339 674.25 1.30Teva Pharmaceutical IndustriesADR (US8816242098) . . . . . . . . . . . . . . . . . . . . . . . . . . . . Count 1 750 000 1 250 000 USD 36.9400 47 793 492.48 1.82The Hartford Financial ServicesGroup (US4165151048) . . . . . . . . . . . . . . . . . . . . . . . . . . . Count 1 500 000 USD 17.1100 18 974 707.78 0.72The Walt Disney Co. (US2546871060) . . . . . . . . . . . . . . . Count 1 250 000 1 250 000 USD 30.6500 28 325 287.04 1.08Vulcan Materials (US9291601097) 3) . . . . . . . . . . . . . . . . Count 1 250 000 150 000 USD 28.9500 26 754 227.08 1.02Weatherford International Reg.(CH0038838394) . . . . . . . . . . . . . . . . . . . . . . . . . . . . . . . . Count 2 000 000 2 814 700 814 700 USD 12.7500 18 852 719.60 0.72Interest-bearing securities4.7500 % Barclays Bank 05/und. MTN(XS0214398199) . . . . . . . . . . . . . . . . . . . . . . EUR 6 000 % 52.0000 3 120 000.00 0.12Certificates<strong>DWS</strong> GO Medical Innovations Certificate(DE000<strong>DWS</strong>0H31) . . . . . . . . . . . . . . . . . . . . . . . . . . . . . . . Count 400 000 EUR 47.6900 19 076 000.00 0.72Total securities portfolio 2 318 433 923.70 88.05DerivativesMinus signs denote short positionsDerivatives on individual securities 14 979 201.01 0.57Warrants on securitiesEquity warrantsUBS London WRT 13.01.14 SimeDarby (CH0122933986) . . . . . . . . . . . . . . . . . . . . . . . . . . . Count 4 000 000 4 000 000 USD 2.6432 7 816 707.21 0.30Securities futuresEquity futuresThe Swatch Group Future 12/2011 (EURX) CHF . . . . . . . Count -110 000 5 251 808.80 0.20BMW Future 12/2011 (EURX) EUR . . . . . . . . . . . . . . . . . . Count -350 000 1 910 685.00 0.07Equity index derivatives 897 178.16 0.03(Receivables/payables)Equity index futuresDAX Index Future 12/2011 (EURX) EUR . . . . . . . . . . . . . . Count 7500 897 178.16 0.0373
<strong>DWS</strong> AkkumulaCount/ Quantity/ Purchases/ Sales/ Market price Total market % ofDescription currency principal additions disposals value in net assets(– / ’000) amount in the reporting period EURCurrency derivatives -20 117 553.42 -0.76Currency futures (long)Closed positionsEUR/JPY 219.65 million . . . . . . . . . . . . . . . . . . . . . . . . . . -9 567 279.37 -0.36Currency futures (short)Open positionsEUR/CAD 500.00 million . . . . . . . . . . . . . . . . . . . . . . . . . . -15 274 040.06 -0.58EUR/SGD 150.00 million . . . . . . . . . . . . . . . . . . . . . . . . . . -3 362 887.12 -0.13EUR/USD 200.00 million . . . . . . . . . . . . . . . . . . . . . . . . . . 1 565 830.12 0.06Closed positionsEUR/USD 200.00 million . . . . . . . . . . . . . . . . . . . . . . . . . . 6 520 823.01 0.25Cash and non-securitized money market instruments 313 949 732.40 11.92Cash at bank 313 949 732.40 11.92Demand deposits at CustodianEUR deposits . . . . . . . . . . . . . . . . . . . . . . . . . . . . . . . . . . EUR 36 785 041.74 % 100 36 785 041.74 1.40Deposits in other EU/EEA currencies . . . . . . . . . . . . . . . . EUR 31 545 246.15 % 100 31 545 246.15 1.20Deposits in non-EU/EEA currenciesAustralian dollar . . . . . . . . . . . . . . . . . . . . . . . . . . . . . . . . . AUD 1 824 576.28 % 100 1 314 734.19 0.05Brazilian real . . . . . . . . . . . . . . . . . . . . . . . . . . . . . . . . . . . BRL 811 845.11 % 100 325 761.33 0.01Canadian dollar . . . . . . . . . . . . . . . . . . . . . . . . . . . . . . . . . CAD 775 967.18 % 100 550 199.83 0.02Swiss franc . . . . . . . . . . . . . . . . . . . . . . . . . . . . . . . . . . . . CHF 9 644 657.17 % 100 7 906 422.32 0.30Hong Kong dollar . . . . . . . . . . . . . . . . . . . . . . . . . . . . . . . HKD 69 699 030.21 % 100 6 613 335.14 0.25Japanese yen . . . . . . . . . . . . . . . . . . . . . . . . . . . . . . . . . . JPY 474 309 767.00 % 100 4 570 783.61 0.17South Korean won . . . . . . . . . . . . . . . . . . . . . . . . . . . . . . . KRW 85 160 105.00 % 100 53 306.89 0.00Singapore dollar . . . . . . . . . . . . . . . . . . . . . . . . . . . . . . . . SGD 7 452 687.75 % 100 4 246 853.05 0.16Turkish lira . . . . . . . . . . . . . . . . . . . . . . . . . . . . . . . . . . . . . TRY 58 419.01 % 100 23 221.53 0.00Taiwan dollar . . . . . . . . . . . . . . . . . . . . . . . . . . . . . . . . . . . TWD 3 826 269.00 % 100 92 774.74 0.00U.S. dollar . . . . . . . . . . . . . . . . . . . . . . . . . . . . . . . . . . . . . USD 6 502 476.24 % 100 4 807 425.93 0.18South African rand . . . . . . . . . . . . . . . . . . . . . . . . . . . . . . . ZAR 1 239 886.90 % 100 114 625.95 0.00Time depositEUR deposits (Deutsche Bank AG, Frankfurt/Main) . . . . . EUR 215 000 000.00 % 100 215 000 000.00 8.17Other assets 8 323 426.72 0.32Interest receivable . . . . . . . . . . . . . . . . . . . . . . . . . . . . . . EUR 205 595.01 % 100 205 595.01 0.01Dividends receivable . . . . . . . . . . . . . . . . . . . . . . . . . . . . . EUR 7 562 609.09 % 100 7 562 609.09 0.29Withholding tax claims . . . . . . . . . . . . . . . . . . . . . . . . . . . EUR 329 898.60 % 100 329 898.60 0.01Other receivables . . . . . . . . . . . . . . . . . . . . . . . . . . . . . . . EUR 225 324.02 % 100 225 324.02 0.01Receivables from share certificate transactions EUR 222 075.28 % 100 222 075.28 0.01Other liabilities -3 294 260.17 -0.13Liabilities from cost item . . . . . . . . . . . . . . . . . . . . . . . . . . EUR -3 181 598.11 % 100 -3 181 598.11 -0.12Additional other liabilities . . . . . . . . . . . . . . . . . . . . . . . . . EUR -112 662.06 % 100 -112 662.06 0.00Liabilities from share certificate transactions EUR -344 528.16 % 100 -344 528.16 -0.01Net assets 2 633 049 195.52 100.00Net asset value per unit 466.76Number of units outstanding 5 641 127.739Negligible rounding errors may have arisen due to the rounding of calculated percentages.74
<strong>DWS</strong> AkkumulaComposition of the reference portfolio (risk benchmark) (according to article 28 (3), of the Derivatives Regulation (DerivateV))MSCI Equities The World Index EUR TRMarket risk exposure (value-at-risk) (according to article 28 (2), sentences 1 and 2, of the Derivatives Regulation (DerivateV))Lowest market risk exposure . . . . . . . . . . . . . . . . . . % 5.832Highest market risk exposure . . . . . . . . . . . . . . . . . . % 9.834Average market risk exposure . . . . . . . . . . . . . . . . . % 8.057The values-at-risk were calculated for the period from October 1, 2010, through September 30, 2011, using historical simulation with a 99% confidence level, a 10-day holding period andan effective historical observation period of one year. The risk in a reference portfolio that does not contain derivatives is used as the measurement benchmark. Market risk is the risk tothe fund from an unfavorable change in market prices. The investment company determines the potential market risk by means of the qualified approach as defined by the DerivativesRegulation.In the reporting period, the average leverage effect from the use of derivatives was 0.6, whereby the total of the nominal amounts of the derivates in relation to the fund’s assets wasused for the calculation (nominal value method).Market abbreviationsFutures exchangesEURX = Eurex (Eurex Frankfurt/Main / Eurex Zürich)Exchange rates (indirect quotes)As of September 30, 2011Australian dollar . . . . . . . . . . . . . . . . . AUD 1.387791 = EUR 1Brazilian real . . . . . . . . . . . . . . . . . . . . BRL 2.492147 = EUR 1Canadian dollar . . . . . . . . . . . . . . . . . CAD 1.410337 = EUR 1Swiss franc . . . . . . . . . . . . . . . . . . . . . CHF 1.219851 = EUR 1British pound . . . . . . . . . . . . . . . . . . . GBP 0.868596 = EUR 1Hong Kong dollar . . . . . . . . . . . . . . . . HKD 10.539165 = EUR 1Japanese yen . . . . . . . . . . . . . . . . . . . JPY 103.769902 = EUR 1South Korean won . . . . . . . . . . . . . . . KRW 1 597.544080 = EUR 1Singapore dollar . . . . . . . . . . . . . . . . . SGD 1.754873 = EUR 1Turkish lira . . . . . . . . . . . . . . . . . . . . . . TRY 2.515726 = EUR 1Taiwan dollar . . . . . . . . . . . . . . . . . . . . TWD 41.242574 = EUR 1U.S. dollar . . . . . . . . . . . . . . . . . . . . . USD 1.352590 = EUR 1South African rand . . . . . . . . . . . . . . . ZAR 10.816808 = EUR 1Notes on the valuationThe Custodian shall determine the value with the participation of the investment company. The Custodian generally bases its valuation on external sources.If no trading prices are available, prices are determined with the aid of valuation models (derived market values) which are agreed between the Custodian and the investment companyand which are based as far as possible on market parameters. This procedure is subject to an ongoing monitoring process. The plausibility of price information from third parties is checkedthrough other pricing sources, model calculations or other suitable procedure.Investments reported in this report are not valued at derived market values.Footnotes3) These securities were completely or partly transferred under securities loans. The equivalent value of the lent securities is EUR 423 040 967.66.75
<strong>DWS</strong> AkkumulaTransactions completed during the reporting period that no longer appear in the investment portfolioPurchases and sales of securities, investment fund units and promissory noteloans (Schuldscheindarlehen); market classifications are as of the reporting dateCount/Purchases/ Sales/Descriptioncurrencyadditions disposals(– / ’000)Securities traded on an exchangeEquitiesVestas Wind Systems (DK0010268606) . . . . . . . . . . Count 650 000Banco Santander Central Hispanola Reg.(ES0113900J37) . . . . . . . . . . . . . . . . . . . . . . . . . . . . Count 2 500 000 2 500 000Bayer (DE000BAY0017) . . . . . . . . . . . . . . . . . . . . . . Count 250 000 250 000Crucell (NL0000358562) . . . . . . . . . . . . . . . . . . . . . . Count 721 343ENI (IT0003132476) . . . . . . . . . . . . . . . . . . . . . . . . . Count 750 000 2 750 000Iberdrola (new) (ES0144580Y14) . . . . . . . . . . . . . . . Count 4 000 000K+S (DE0007162000) . . . . . . . . . . . . . . . . . . . . . . . . Count 500 000 500 000Koninklijke KPN (NL0000009082) . . . . . . . . . . . . . . . Count 2 084 573 6 084 573Linde (DE0006483001) . . . . . . . . . . . . . . . . . . . . . . . Count 300 000Metso (FI0009007835) . . . . . . . . . . . . . . . . . . . . . . . Count 450 000 450 000Nokia (FI0009000681) . . . . . . . . . . . . . . . . . . . . . . . . Count 8 000 000 8 000 000Prysmian (IT0004176001) . . . . . . . . . . . . . . . . . . . . . Count 1 000 000Societe Generale (FR0000130809) . . . . . . . . . . . . . . Count 1 250 000 1 250 000Total (FR0000120271) . . . . . . . . . . . . . . . . . . . . . . . . Count 1 000 000UniCredit (IT0000064854) . . . . . . . . . . . . . . . . . . . . . Count 25 000 000 25 000 000Unilever (NL0000009355) . . . . . . . . . . . . . . . . . . . . . Count 500 000Old Mutual (GB0007389926) . . . . . . . . . . . . . . . . . . Count 20 000 000 20 000 000AIA Group (HK0000069689) . . . . . . . . . . . . . . . . . . . Count 14 450 000 14 450 000Hongkong Exchanges and Clearing(HK0388045442) . . . . . . . . . . . . . . . . . . . . . . . . . . . . Count 1 000 000 1 000 000Canon (JP3242800005) . . . . . . . . . . . . . . . . . . . . . . . Count 1 500 000Denso Corp. (JP3551500006) . . . . . . . . . . . . . . . . . . Count 1 750 000Nintendo Co. (JP3756600007) . . . . . . . . . . . . . . . . . Count 175 000Nomura Holdings (JP3762600009) . . . . . . . . . . . . . . Count 5 000 000Sharp Corp. (JP3359600008) . . . . . . . . . . . . . . . . . . Count 1 750 000Tokuyama Corp. (JP3625000009) . . . . . . . . . . . . . . . Count 3 500 000Cisco Systems (US17275R1023) . . . . . . . . . . . . . . . Count 1 500 000Cree (US2254471012) . . . . . . . . . . . . . . . . . . . . . . . Count 250 000 250 000CSX Corp. (US1264081035) . . . . . . . . . . . . . . . . . . . Count 750 000Dean Foods Co. (US2423701042) . . . . . . . . . . . . . . Count 2 350 000Fluor Corp. (new) (US3434121022) . . . . . . . . . . . . . Count 300 000FMC Corp. (US3024913036) . . . . . . . . . . . . . . . . . . Count 500 000Freeport-McMoRan Copper & Gold B(US35671D8570) . . . . . . . . . . . . . . . . . . . . . . . . . . . Count 500 000 500 000Hewlett-Packard Co. (US4282361033) . . . . . . . . . . . Count 1 500 000 3 000 000Microsoft Corp. (US5949181045) . . . . . . . . . . . . . . . Count 2 500 000Petróleo Brasileiro ADR (US71654V4086) . . . . . . . . Count 500 000The Mosaic Co. (US61945A1079) . . . . . . . . . . . . . . Count 700 000Interest-bearing securities5.3300 % Deutsche Bank Capital TrustIV 03/und. (XS0176823424) . . . . . . . . . . EUR 55 200Derivatives (option premiums realized in opening transactions, or total optionstransactions; in the case of warrants, purchases and sales are shown)Futures contractsSecurities futuresValue (’000)Equity futuresContracts sold: EUR 124 397(Underlyings: BMW Ord.)Equity index futuresContracts purchased: EUR 736 806(Underlyings: DAX (performance index), Nikkei 225. S&P 500Index)Contracts sold: EUR 1 741 065(Underlyings: DAX (performance index), Nikkei 225. S&P 500Index)Interest rate futuresContracts sold: EUR 125 573(Underlyings: Euro-Bund Future 03/2011)Currency futuresFutures contracts to purchase currenciesEUR/JPY EUR 739 266JPY/EUR EUR 369 716USD/JPY EUR 1 793 396Futures contracts to sell currenciesEUR/CAD EUR 499 889EUR/JPY EUR 370 354EUR/SGD EUR 149 868EUR/USD EUR 734 938JPY/EUR EUR 370 354USD/EUR EUR 1 815 552USD/JPY EUR 723 351Option contractsOptions on currency derivativesCurrency optionsPut options sold: EUR 2 522 500(Underlyings: Put USD/EUR (DBK) 02.06.11 Strike 1.49. PutUSD/EUR (DBK) 05.05.11 Strike 1.42. Put USD/EUR (DBK) 07.04.11Strike 1.40. Put USD/EUR (DBK) 11.07.11 Strike 1.47)Unlisted securitiesEquitiesIberdrola Right (ES0644580914) . . . . . . . . . . . . . . . . Count 4 000 000 4 000 00076
<strong>DWS</strong> AkkumulaSecurities loans (total transactions, at the value agreed at the closing of the loancontract)Value (’000)Perpetual EUR 3 304 975(Security description: 4.7500 % Barclays Bank 05/und. MTN, 5.3300 %Deutsche Bank Capital Trust IV 03/und., AEGON, AIA Group,Allianz SE, Anadarko Petroleum Corp., Astellas Pharma,Banco Santander Central Hispanola Reg., Bayer, BNP Paribas,Canadian Pacific Railway, Canon, Cisco Systems, City Development,Compagnie de Saint-Gobain (C.R.), Corning, Crucell, DensoCorp., Deutsche Bank Reg., Deutsche Post Reg., DeutscheTelekom Reg., E.ON Reg., Eli Lilly & Co., ENI, France Telecom,GdF Suez, Hewlett-Packard Co., Hongkong Exchanges and Clearing,Iberdrola (new), Iberdrola Right, ING Groep CVA, Ingenico,ITT Corp., Koninklijke KPN, Koninklijke Philips Electronics,Laboratory Corp. America Holdings, Linde, Medtronic, Metso,Microsoft Corp., Mitsui & Co., Murphy Oil Corp., NestléReg., Nexans, Nippon Yusen, Nokia, Pfizer, PostNL, PradaHolding, Prysmian, Qiagen, Royal Dutch Shell Cl. A, Sanofi,SAP, Shiseido Co., Siemens Reg., Societe Generale, SumitomoCorp., Takeda Pharmaceutical Co., The Hartford FinancialServices Group, The Walt Disney Co., Total, TUI Travel,UniCredit, Unilever, Verbund AG, Vestas Wind Systems, VINCI,Vivendi, Vulcan Materials)77
<strong>DWS</strong> AkkumulaStatement of income and expenses (incl. income adjustment)Performance of the investment fund 2010/2011for the period from October 1, 2010, through September 30, 2011I. Income1. Dividends from domestic issuers . . . . . . . . . . . . . . . . . . EUR 9 932 320.732. Dividends from foreign issuers(before withholding tax) . . . . . . . . . . . . . . . . . . . . . . . . . EUR 50 723 160.443. Interest from foreign securities(before withholding tax) . . . . . . . . . . . . . . . . . . . . . . . . . EUR 833 309.214. Interest from investments of liquid assets in Germany . EUR 1 697 260.905. Income from securities lendingand repurchase agreements . . . . . . . . . . . . . . . . . . . . . . EUR 4 341 333.02including:from securities lending . . . . . . . . .EUR 4 341 333.026. Deduction for foreign withholding tax . . . . . . . . . . . . . . EUR -3 911 083.707. Other income . . . . . . . . . . . . . . . . . . . . . . . . . . . . . . . . . EUR 14 358 807.49including:Compensation payments . . . . . . .EUR 14 154 830.43Other . . . . . . . . . . . . . . . . . . . . . . .EUR 203 977.06Total income . . . . . . . . . . . . . . . . . . . . . . . . . . . . . . . . . . . . EUR 77 975 108.09II. Expenses1. Interest on borrowings . . . . . . . . . . . . . . . . . . . . . . . . . . EUR -7 528.482. Management fee . . . . . . . . . . . . . . . . . . . . . . . . . . . . . . EUR -45 004 853.88including:All-in fee . . . . . . . . . . . . . . . . . . . .EUR -45 004 853.883. Other expenses . . . . . . . . . . . . . . . . . . . . . . . . . . . . . . . EUR -2 187 224.16including:Performance-based fee fromsecurities lending income . . . . . . .EUR -2 170 666.52Legal expenses . . . . . . . . . . . . . . .EUR -16 396.71Other . . . . . . . . . . . . . . . . . . . . . . .EUR -160.93Total expenses . . . . . . . . . . . . . . . . . . . . . . . . . . . . . . . . . . EUR -47 199 606.52III. Net investment income . . . . . . . . . . . . . . . . . . . . . . . . EUR 30 775 501.57IV. Sale transactionsRealized gains . . . . . . . . . . . . . . . . . . . . . . . . . . . . . . . . . . . . EUR 408 938 146.53Realized losses . . . . . . . . . . . . . . . . . . . . . . . . . . . . . . . . . . . EUR -418 279 130.90Capital gains/losses . . . . . . . . . . . . . . . . . . . . . . . . . . . . . . EUR -9 340 984.37I. Value of the investment fund at the beginningof the fiscal year . . . . . . . . . . . . . . . . . . . . . . . . . . . . . . EUR 3 264 560 226.731. Previous year's distribution or tax abatement . . . . . . . . EUR -8 367 909.432. Net inflows . . . . . . . . . . . . . . . . . . . . . . . . . . . . . . . . . . . EUR -213 580 221.63a) Inflows from subscriptions . . . . . . . . . . . . . . . . . . . . EUR 535 683 778.71b) Outflows from redemptions . . . . . . . . . . . . . . . . . . . EUR -749 264 000.343. Income adjustment and reimbursed expenses . . . . . . . EUR 4 968 554.144. Net investment income . . . . . . . . . . . . . . . . . . . . . . . . . EUR 30 775 501.575. Realized gains . . . . . . . . . . . . . . . . . . . . . . . . . . . . . . . . . EUR 408 938 146.536. Realized losses . . . . . . . . . . . . . . . . . . . . . . . . . . . . . . . . EUR -418 279 130.907. Net change in unrealized appreciation/depreciation . . . . EUR -435 965 971.49II. Value of the investment fund atthe end of the fiscal year . . . . . . . . . . . . . . . . . . . . . . . EUR 2 633 049 195.52Distribution policy of the investment fundTotalPer unitI. Calculation of distribution1. Net gain/loss for the fiscal year . . . . . . . . EUR 21 434 517.20 3.79II. Available for distribution . . . . . . . . . . . . EUR 21 434 517.20 3.791. Reinvested . . . . . . . . . . . . . . . . . . . . . . . . EUR -14 693 466.55 -2.60III. Total distribution . . . . . . . . . . . . . . . . . . EUR 6 741 050.65 1.191. Final distributiona) Withholding tax oncapital income withheld . . . . . . . . . . . . EUR 6 389 621.47 1.13b) Solidarity surcharge withheld . . . . . . . EUR 351 429.18 0.06Changes in net assets and in the net asset value perunit over the last three yearsV. Net gain/loss for the fiscal year . . . . . . . . . . . . . . . . . . EUR 21 434 517.20Total expense ratio (in accordance with article 41 (2) of the InvGNet assetsat the end ofthe fiscal year EURNet assetvalue perunit EURThe total expense ratio was 1.45% p.a. The TER expresses total expenses and fees(excluding transaction costs) as a percentage of the fund’s average net assets for a givenfiscal year.As well, the additional income from securities lending resulted in a performance-basedfee of 0.070% p.a. calculated on the fund’s average net assets.2011 . . . . . . . . . . . . . . . . . . . . . . . . . . . . . . . . . . . . 2 633 049 195.52 466.762010 . . . . . . . . . . . . . . . . . . . . . . . . . . . . . . . . . . . . 3 264 560 226.73 537.642009 . . . . . . . . . . . . . . . . . . . . . . . . . . . . . . . . . . . . 3 115 665 431.74 529.122008 . . . . . . . . . . . . . . . . . . . . . . . . . . . . . . . . . . . . 2 675 783 856.03 512.59Information provided in accordance with article 41 (4) and (5) of the InvG (Costs and CostTransparency).In the fiscal year from October 1, 2010, through September 30, 2011, the investmentcompany, <strong>DWS</strong> Investment GmbH, was not reimbursed for the fees and expenses paidby <strong>DWS</strong> Akkumula to the Custodian and other third parties, except in the form of financialinformation provided by brokers for research purposes.An all-in fee of 1.45% per year is payable to the investment company under the Terms ofContract. Of this annual fee, the investment company in turn pays up to 0.15% to theCustodian and up to 0.05% to other parties (for printing and publication costs, auditing andother items). Of its own portion of the all-in fee, the investment company pays more than10% in commissions to distributors of the fund; the specific percentage paid is based onthe balance of units distributed.Transaction costsThe transaction costs paid in the reporting period amounted to EUR 9 575 807.05.The transaction costs include all costs that were reported or settled separately for theaccount of the fund in the reporting period and are directly connected to the purchase orsale of assets.78Transactions processed for the account of the fund’s assets via closely related companies (based on major holdings of the Deutsche Bank Group)The share of transactions conducted for the account of the investment fund’s assets via brokers that are closely related companies and persons (share of five percent and above), amountedto 8.37 percent of all transactions. The total volume was EUR 371 793 085.65.
Independentauditor’s reportKPMG issued an unqualified auditor's report forthe full annual report in accordance with article 44 (5)of the German Investment Act. The translation of theauditor's report is as follows:To <strong>DWS</strong> Investment GmbH, Frankfurt/Main, GermanyIn accordance with article 44 (5) of the German Investment Act (Investmentgesetz;InvG), <strong>DWS</strong> Investment GmbH commissioned us to perform the audit of the annualreport of the investment fund <strong>DWS</strong> Akkumula for the fiscal year from October 1, 2010,through September 30, 2011.Responsibility of the legal representativesThe preparation of the annual report according to the provisions of the InvG is theresponsibility of the legal representatives of the investment company.Responsibility of the auditorsOur responsibility is to express an opinion on the annual report based on our audit.We conducted our audit in accordance with article 44 (5) InvG and generally acceptedGerman standards for the audit of financial statements promulgated by the Institut derWirtschaftsprüfer (Institute of Public Auditors in Germany; IDW). Those standardsrequire that we plan and perform the audit such that misstatements materially affectingthe annual report are detected with reasonable assurance. Knowledge of themanagement of the investment fund and expectations as to possible misstatementsare taken into account in the determination of audit procedures. The effectiveness ofthe accounting-related internal control system and the evidence supporting thedisclosures in the annual report are examined primarily on a test basis within theframework of the audit. The audit includes assessing the accounting principles usedfor the annual report and significant estimates made by the legal representatives ofthe investment company. In our view, our audit provides a reasonably secure basis forour evaluation.Audit opinionOur audit has not led to any reservations.In our opinion, based on the findings of our audit, the annual report complies with thelegal requirements.Frankfurt/Main, December 20, 2011KPMG AGWirtschaftsprüfungsgesellschaftHornschuWirtschaftsprüferNeufWirtschaftsprüfer79
2010The formatused for complete datesin securities descriptions in the investmentportfolio is “day/month/year”.Annual report<strong>DWS</strong> Global Small/Mid Cap2011
<strong>DWS</strong> Global Small/Mid CapInvestment objective andperformance in the reporting periodThe investment focus of <strong>DWS</strong> GlobalSmall/Mid Cap is on small- and mid-capsworldwide. The remaining portion is investedprimarily in large-caps. In thefiscal year through the end of Septem -ber 2011, the fund recorded a declineof 23.5% per unit (BVI method) andwas thus behind its benchmark, theMSCI World Mid Cap, which fell 3.3%.<strong>DWS</strong> GLOBAL SMALL/MID CAPFive-year performance130120110100908070609/06* 9/07 9/08 9/09 9/109/11<strong>DWS</strong> Global Small/Mid Cap* 9/2006 = 100Data on euro basis“BVI method” performance, i.e., excluding the initial sales charge. Past performance is no guide to future results.As of: September 30, 2011Investment policyin the reporting periodThe management saw major risks forthe investment fund in an economicslowdown, compounded by the highsovereign debt of western countriesand the lack of unified political processesin some nations. The overweightingof investments in the euro area had anegative impact on the fund’s performance.European equities appeared tobe valued more attractively than U.S. se -curities. Furthermore, the continuing highunemployment figures and the failure ofthe house market to recover indicated<strong>DWS</strong> GLOBAL SMALL/MID CAPvs. benchmarkPerformance at a glancein %1680-8-16-24-32-23.5-3.31 year-1.6+9.33 years-25.9-12.75 years<strong>DWS</strong> Global Small/Mid CapBenchmark MSCI World Mid Cap sinceJuly1, 2010 (previously: MSCI World)Data on euro basis“BVI method” performance, i.e., excluding theinitial sales charge. Past performance is no guideto future results.As of: September 30, 2011weaker U.S. consumer spending.However, as the EU sovereign debtproblems deteriorated, European stocksHowever Asian countries were unableto avoid the effects of the trend towardslowing economic growth in the industrialcountries. They came under strongselling pressure and dampened performance.The higher cash ratio boostedperformance, particularly at the end ofthe reporting period.came under greater pressure. In viewof this, the European weighting in thefund was reduced during the reportingperiod. The earthquake disaster inJapan was also a drag on performancesince the fund was overweighted here.Japan’s weighting was later reducedand hedging in Japanese yen was completelyliquidated in the course of theyear. Asian growth countries wereanother heavyweight in the portfolio.At sector level, <strong>DWS</strong> Global Small/Mid Cap participated in the commodi-82
ties sector via its selection of individualequities. Investments in gold mine ope -rators such as AuRico Gold and YamanaGold benefited from the high price ofgold. Both gold manufacturers operatetheir mines in politically stable regionsand therefore seem quite interesting.The considerable underweighting of thefinancial sector overall made a positivecontribution to performance. Concernsregarding banks’ investments in southernEuropean bonds were among thefactors weighing on equity prices.The back-office processes specialistXchanging, which was included in theportfolio at times, was hurt by thistrend. The company, which focuses onthe financial sector, turned in a belowaverageperformance. In durable consumergoods, Pandora failed to meetexpectations after the Danish jewelrymanufacturer saw demand drop sharply.<strong>DWS</strong> GLOBAL SMALL/MID CAP: Summary statement of assetsInvestment focus by sectorEquities 72.7% (September 30, 2011) / Equities 98.1% (September 30, 2010)Industrials13.418.1Financials10.911.8Materials10.514.9Health Care3.79.0Information Technology7.717.0Energy7.014.0Consumer Discretionary6.78.5Consumer Staples4.59.0Utilities1.81.1Telecommunication Services 1.20.0Time deposit0.06.4Cash and other assets1.920.90 5 10 15 20 25In % of the fund’s net assets in bondsas of September 30, 2011In % of the fund’s net assets in bondsas of September 30, 2010Security code: 847 650ISIN: DE0008476508As of: September 30, 2011Main sources of capital gains/lossesThe main sources of capital gains/losses were losses realized on equities,options, futures and forward currencytransactions.83
Annual report<strong>DWS</strong> Global Small/Mid CapInvestment portfolio – September 30, 2011Count/ Quantity/ Purchases/ Sales/ Market price Total market % ofDescription currency principal additions disposals value in net assets(– / ’000) amount in the reporting period EURSecurities traded on an exchange 28 494 525.39 72.73EquitiesAgnico-Eagle Mines (CA0084741085) . . . . . . . . . . . . . . . . Count 4 500 83 000 98 500 CAD 62.0800 198 080.32 0.51Aurico Gold (CA05155C1059) . . . . . . . . . . . . . . . . . . . . . . Count 42 000 291 000 249 000 CAD 9.8200 292 440.74 0.75Golden Star Resources (CA38119T1049) . . . . . . . . . . . . . Count 220 000 1 656 000 1 686 000 CAD 1.8400 287 023.60 0.73Grande Cache Coal Corporation(CA38655X1050) . . . . . . . . . . . . . . . . . . . . . . . . . . . . . . . . Count 42 000 50 000 8 000 CAD 4.3000 128 054.50 0.33Kinross Gold (CA4969024047) . . . . . . . . . . . . . . . . . . . . . Count 42 000 457 000 605 000 CAD 15.0000 446 701.75 1.14Lundin Mining (CA5503721063) . . . . . . . . . . . . . . . . . . . . Count 90 000 105 000 15 000 CAD 3.7600 239 942.65 0.61Yamana Gold (CA98462Y1007) . . . . . . . . . . . . . . . . . . . . . Count 26 000 277 000 771 000 CAD 14.0400 258 831.75 0.66Partners Group Holding Reg.(CH0024608827) . . . . . . . . . . . . . . . . . . . . . . . . . . . . . . . . Count 5 500 5 500 CHF 149.3000 673 155.98 1.72Pandora (DK0060252690) . . . . . . . . . . . . . . . . . . . . . . . . . Count 43 000 100 000 57 000 DKK 37.2600 215 300.10 0.55Axel Springer Vink. Reg. (DE0005501357) . . . . . . . . . . . . Count 21 000 28 000 31 749 EUR 25.7850 541 485.00 1.38Bauer (DE0005168108) . . . . . . . . . . . . . . . . . . . . . . . . . . . Count 30 000 33 700 44 063 EUR 17.3950 521 850.00 1.33Deutsche EuroShop Reg. (DE0007480204) . . . . . . . . . . . Count 17 000 17 000 EUR 25.2000 428 400.00 1.09Fiat Industrial (IT0004644743) . . . . . . . . . . . . . . . . . . . . . . Count 35 000 52 000 17 000 EUR 5.6700 198 450.00 0.51KSB Pref. (DE0006292030) . . . . . . . . . . . . . . . . . . . . . . . . Count 750 830 2 480 EUR 384.0500 288 037.50 0.74Metso (FI0009007835) . . . . . . . . . . . . . . . . . . . . . . . . . . . Count 10 500 10 500 EUR 22.1700 232 785.00 0.59Prysmian (IT0004176001) . . . . . . . . . . . . . . . . . . . . . . . . . Count 40 000 105 000 145 000 EUR 10.0500 402 000.00 1.03Qiagen (NL0000240000) . . . . . . . . . . . . . . . . . . . . . . . . . . Count 60 000 130 000 190 000 EUR 10.5300 631 800.00 1.61Rheinmetall Ord. (DE0007030009) . . . . . . . . . . . . . . . . . . Count 10 500 79 500 69 000 EUR 35.2700 370 335.00 0.95Wolters Kluwer (NL0000395903) . . . . . . . . . . . . . . . . . . . Count 48 000 87 000 139 000 EUR 12.1900 585 120.00 1.493i Group (GB00B1YW4409) . . . . . . . . . . . . . . . . . . . . . . . Count 335 000 1 216 000 881 000 GBP 1.8740 722 764.09 1.84Centamin Egypt (AU000000CNT2) . . . . . . . . . . . . . . . . . . Count 240 000 480 000 240 000 GBP 0.9420 260 282.11 0.66Eurasian Natural Resources (GB00B29BCK10) . . . . . . . . . Count 34 000 72 000 38 000 GBP 5.7100 223 510.12 0.57Kazakhmys (GB00B0HZPV38) . . . . . . . . . . . . . . . . . . . . . . Count 28 000 53 000 25 000 GBP 8.0000 257 887.44 0.66Man Group (new) (GB00B28KQ186) . . . . . . . . . . . . . . . . . Count 380 000 704 000 1 624 000 GBP 1.6746 732 629.90 1.87Old Mutual (GB0007389926) . . . . . . . . . . . . . . . . . . . . . . Count 374 000 1 250 000 876 000 GBP 1.0360 446 080.80 1.14Shanks Group (GB0007995243) . . . . . . . . . . . . . . . . . . . . Count 400 000 801 000 1 901 000 GBP 1.0700 492 749.22 1.26Smiths Group (GB00B1WY2338) . . . . . . . . . . . . . . . . . . . Count 18 000 75 000 57 000 GBP 9.8450 204 018.90 0.52Wm. Morrison Supermarkets (GB0006043169) . . . . . . . . Count 210 000 592 000 982 000 GBP 2.8820 696 779.63 1.78China Automation Group (KYG2112N1117) . . . . . . . . . . . Count 970 000 2 070 000 1 100 000 HKD 1.9900 183 154.93 0.47China High Precision AutomationGroup (KYG211221091) . . . . . . . . . . . . . . . . . . . . . . . . . . Count 1 600 000 4 035 000 2 435 000 HKD 3.0000 455 444.05 1.16China National Building Material Co. Cl.H (new)(CNE1000002N9) . . . . . . . . . . . . . . . . . . . . . . . . . . . . . . . . Count 520 000 699 000 179 000 HKD 6.7300 332 056.67 0.85China National Materials Co. (CNE100000874) . . . . . . . . . Count 1 310 000 2 050 000 740 000 HKD 2.8500 354 250.08 0.90China Railway Construction Cl.H (CNE100000981) . . . . . Count 450 000 2 400 000 2 750 000 HKD 3.3100 141 329.98 0.36Lonking Holdings (new) (KYG5636C1078) 3) . . . . . . . . . . Count 1 000 000 2 014 000 1 014 000 HKD 2.5800 244 801.18 0.62Shougang Fushan Resource Group (HK0639031506) . . . . Count 750 000 3 735 000 2 985 000 HKD 2.6400 187 870.67 0.48Xingda International Holdings (KYG9827V1068) . . . . . . . . Count 850 000 1 510 000 660 000 HKD 3.8200 308 088.92 0.79Yuanda China Holdings (KYG987761007) . . . . . . . . . . . . . Count 6 802 000 11 630 000 4 828 000 HKD 0.9200 593 770.00 1.52Yamada Denki Co. (JP3939000000) . . . . . . . . . . . . . . . . . Count 16 000 16 000 JPY 5 450.0000 840 320.73 2.14Cermaq (NO0010003882) . . . . . . . . . . . . . . . . . . . . . . . . . Count 70 000 41 000 471 000 NOK 63.0000 558 705.51 1.43Marine Harvest (NO0003054108) . . . . . . . . . . . . . . . . . . . Count 700 000 1 150 000 2 950 000 NOK 2.6520 235 188.41 0.60Capitaland (SG1J27887962) . . . . . . . . . . . . . . . . . . . . . . . Count 323 000 600 000 277 000 SGD 2.4700 454 625.49 1.16Sakari Resources (SG1U11932563) . . . . . . . . . . . . . . . . . Count 190 000 1 300 000 1 110 000 SGD 2.0000 216 539.89 0.55E Ink Holdings (TW0008069006) . . . . . . . . . . . . . . . . . . . Count 170 000 2 000 000 1 830 000 TWD 64.1000 264 217.26 0.67Epistar (TW0002448008) . . . . . . . . . . . . . . . . . . . . . . . . . . Count 200 000 350 000 150 000 TWD 54.1000 262 350.26 0.67Aecom Technology (Del.) (US00766T1007) . . . . . . . . . . . Count 16 000 77 000 121 000 USD 18.1800 215 054.08 0.55Agilent Technologies (US00846U1016) . . . . . . . . . . . . . . . Count 22 000 22 000 USD 32.5200 528 940.77 1.35AirMedia Group ADR (US0094111095) . . . . . . . . . . . . . . . Count 220 000 761 602 1 011 602 USD 2.7000 439 157.47 1.12AK Steel Holding Corp. (US0015471081) . . . . . . . . . . . . . Count 46 000 316 000 270 000 USD 6.8400 232 620.38 0.59Alpha Natural Resources (US02076X1028) . . . . . . . . . . . . Count 20 500 82 000 61 500 USD 18.7100 283 570.78 0.72Avon Products (US0543031027) . . . . . . . . . . . . . . . . . . . . Count 18 000 18 000 USD 19.8300 263 893.72 0.67Bruker BioSciences Corp. (US1167941087) . . . . . . . . . . . Count 55 000 55 000 USD 13.5600 551 386.60 1.41Carefusion (US14170T1016) . . . . . . . . . . . . . . . . . . . . . . . Count 26 000 26 000 USD 24.5800 472 486.12 1.21CNH Global (NL0000298933) . . . . . . . . . . . . . . . . . . . . . . Count 28 500 47 500 19 000 USD 27.7500 584 711.55 1.49General Cable Corp. (US3693001089) . . . . . . . . . . . . . . . Count 15 000 32 000 87 000 USD 24.4200 270 813.77 0.69Itron (US4657411066) . . . . . . . . . . . . . . . . . . . . . . . . . . . . Count 24 000 69 000 45 000 USD 32.1400 570 283.68 1.46KT ADR (US48268K1016) . . . . . . . . . . . . . . . . . . . . . . . . . Count 40 000 213 000 173 000 USD 15.4500 456 901.20 1.17Life Technologies (US53217V1098) . . . . . . . . . . . . . . . . . Count 12 000 53 000 41 000 USD 38.9200 345 293.10 0.88Lincoln National Corp. (US5341871094) . . . . . . . . . . . . . . Count 31 000 43 000 202 000 USD 16.4600 377 246.62 0.96Marvell Technology Group (BMG5876H1051) . . . . . . . . . Count 24 000 179 000 155 000 USD 14.9600 265 446.29 0.6884
<strong>DWS</strong> Global Small/Mid CapCount/ Quantity/ Purchases/ Sales/ Market price Total market % ofDescription currency principal additions disposals value in net assets(– / ’000) amount in the reporting period EURMurphy Oil Corp. (US6267171022) . . . . . . . . . . . . . . . . . . Count 23 000 50 500 27 500 USD 45.3000 770 299.94 1.97Nabors Industries (BMG6359F1032) . . . . . . . . . . . . . . . . . Count 26 000 101 000 195 000 USD 13.1100 252 005.41 0.64Perfect World ADR (US71372U1043) . . . . . . . . . . . . . . . . Count 22 000 235 000 213 000 USD 11.5800 188 349.76 0.48PerkinElmer (US7140461093) . . . . . . . . . . . . . . . . . . . . . . Count 32 000 32 000 USD 19.5800 463 229.80 1.18Sohu.Com (US83408W1036) . . . . . . . . . . . . . . . . . . . . . . Count 6 000 28 000 39 000 USD 50.6200 224 546.98 0.57Take-Two Interactive Software (US8740541094) . . . . . . . Count 25 000 292 573 USD 13.1600 243 237.05 0.62The AES Corp. (US00130H1059) . . . . . . . . . . . . . . . . . . . Count 95 000 248 000 153 000 USD 10.2600 720 617.48 1.84The Hartford Financial Services Group (US4165151048) . Count 33 000 140 000 107 000 USD 17.1100 417 443.57 1.07Transneft’, Aktsionernaya Pref. (RU0009091573) . . . . . . . Count 1 130 1 100 2 870 USD 965.8572 806 910.14 2.06Trina Solar (Sp. ADR) (US89628E1047) 3) . . . . . . . . . . . . . Count 53 000 315 000 262 000 USD 6.4000 250 778.14 0.64United States Steel Corp. (US9129091081) . . . . . . . . . . Count 14 000 55 500 41 500 USD 23.0700 238 786.33 0.61Walter Energy (US93317Q1058) . . . . . . . . . . . . . . . . . . . . Count 5 000 10 000 5 000 USD 60.4500 223 460.18 0.57Weatherford International Reg. (CH0038838394) . . . . . . . Count 43 000 171 000 268 000 USD 12.7500 405 333.47 1.03WuXi PharmaTech (Cayman) ADR (US9293521020) . . . . Count 63 000 253 700 190 700 USD 11.6900 544 488.72 1.39Yingli Green Energy Holding Co. (US98584B1035) 3) . . . Count 115 000 207 000 92 000 USD 3.2700 278 022.16 0.71Total securities portfolio 28 494 525.39 72.73DerivativesMinus signs denote short positionsDerivatives on individual securities 19 373.28 0.05Securities futuresEquity futuresAmazon.com Future 12/2011 (EURX) USD . . . . . . . . . . . . Count -2 500 -4 753.09 -0.01Salesforce.com Future 12/2011 (EURX) USD . . . . . . . . . . Count -4 000 24 126.37 0.06Equity index derivatives 43 950.04 0.11(Receivables/payables)Equity index futuresMDAX Future 12/2011 (EURX) EUR . . . . . . . . . . . . . . . . . Count -750 81 955.02 0.21H-Shares Index Future 10/2011 (HKFE) HKD . . . . . . . . . . Count 2 750 -38 004.98 -0.10Currency derivatives 831 751.54 2.12Currency futures (long)Open positionsUSD/AUD 5.00 million . . . . . . . . . . . . . . . . . . . . . . . . . . . . 188 248.58 0.48USD/EUR 8.00 million . . . . . . . . . . . . . . . . . . . . . . . . . . . . 342 614.56 0.87Currency futures (short)Open positionsEUR/USD 6.50 million . . . . . . . . . . . . . . . . . . . . . . . . . . . . 140 180.45 0.36Closed positionsEUR/CAD 2.00 million . . . . . . . . . . . . . . . . . . . . . . . . . . . . -2 978.01 -0.01EUR/USD 4.00 million . . . . . . . . . . . . . . . . . . . . . . . . . . . . 163 685.96 0.42Cash and non-securitized money market instruments 8 722 437.65 22.26Cash at bank 8 722 437.65 22.26Demand deposits at CustodianEUR deposits . . . . . . . . . . . . . . . . . . . . . . . . . . . . . . . . . . EUR 3 133 373.81 % 100 3 133 373.81 8.00Deposits in other EU/EEA currencies . . . . . . . . . . . . . . . . EUR 244 164.44 % 100 244 164.44 0.6285
<strong>DWS</strong> Global Small/Mid CapCount/ Quantity/ Purchases/ Sales/ Market price Total market % ofDescription currency principal additions disposals value in net assets(– / ’000) amount in the reporting period EURDeposits in non-EU/EEA currenciesAustralian dollar . . . . . . . . . . . . . . . . . . . . . . . . . . . . . . . . . AUD 95 480.62 % 100 68 800.43 0.18Brazilian real . . . . . . . . . . . . . . . . . . . . . . . . . . . . . . . . . . . BRL 4 427.77 % 100 1 776.69 0.00Canadian dollar . . . . . . . . . . . . . . . . . . . . . . . . . . . . . . . . . CAD 254 372.97 % 100 180 363.25 0.46Swiss franc . . . . . . . . . . . . . . . . . . . . . . . . . . . . . . . . . . . . CHF 18 764.30 % 100 15 382.45 0.04Hong Kong dollar . . . . . . . . . . . . . . . . . . . . . . . . . . . . . . . HKD 6 326 714.19 % 100 600 305.07 1.53Japanese yen . . . . . . . . . . . . . . . . . . . . . . . . . . . . . . . . . . JPY 173 765.00 % 100 1 674.52 0.00South Korean won . . . . . . . . . . . . . . . . . . . . . . . . . . . . . . . KRW 244 527 113.00 % 100 153 064.39 0.39New Zealand dollar . . . . . . . . . . . . . . . . . . . . . . . . . . . . . . NZD 111 741.08 % 100 63 086.54 0.16Singapore dollar . . . . . . . . . . . . . . . . . . . . . . . . . . . . . . . . SGD 173 719.74 % 100 98 992.77 0.25Turkish lira . . . . . . . . . . . . . . . . . . . . . . . . . . . . . . . . . . . . . TRY 304 957.29 % 100 121 220.39 0.31Taiwan dollar . . . . . . . . . . . . . . . . . . . . . . . . . . . . . . . . . . . TWD 26 376 053.35 % 100 639 534.61 1.63U.S. dollar . . . . . . . . . . . . . . . . . . . . . . . . . . . . . . . . . . . . . USD 1 218 275.50 % 100 900 698.29 2.30Time depositEUR deposits (Deutsche Bank AG, Frankfurt) . . . . . . . . . EUR 2 500 000.00 % 100 2 500 000.00 6.38Other assets 1 141 652.25 2.91Interest receivable . . . . . . . . . . . . . . . . . . . . . . . . . . . . . . EUR 1 023.21 % 100 1 023.21 0.00Dividends receivable . . . . . . . . . . . . . . . . . . . . . . . . . . . . . EUR 21 605.87 % 100 21 605.87 0.06Withholding tax claims . . . . . . . . . . . . . . . . . . . . . . . . . . . EUR 70 513.16 % 100 70 513.16 0.18Initial margins . . . . . . . . . . . . . . . . . . . . . . . . . . . . . . . . . . EUR 1 047 391.29 % 100 1 047 391.29 2.67Other receivables . . . . . . . . . . . . . . . . . . . . . . . . . . . . . . . EUR 1 118.72 % 100 1 118.72 0.00Receivables from share certificate transactions EUR 2 121.58 % 100 2 121.58 0.01Other liabilities -49 691.32 -0.13Liabilities from cost items . . . . . . . . . . . . . . . . . . . . . . . . . EUR -49 131.95 % 100 -49 131.95 -0.13Additional other liabilities . . . . . . . . . . . . . . . . . . . . . . . . . EUR -559.37 % 100 -559.37 0.00Liabilities from share certificate transactions EUR -24 067.76 % 100 -24 067.76 -0.06Net assets 39 182 052.65 100.00Net asset value per unit 34.81Number of units outstanding 1 125 557.421Negligible rounding errors may have arisen due to the rounding of calculated percentages.Composition of the reference portfolio (risk benchmark) (according to article 28 (3), of the Derivatives Regulation (DerivateV))50% MSCI AC WORLD INDEX MID CAP Index in USD, 50% STOXX 600Market risk exposure (value-at-risk) (according to article 28 (2), sentences 1 and 2, of the Derivatives Regulation (DerivateV))Lowest market risk exposure . . . . . . . . . . . . . . . . . . % 4.597Highest market risk exposure . . . . . . . . . . . . . . . . . . % 13.713Average market risk exposure . . . . . . . . . . . . . . . . . % 8.124The values-at-risk were calculated for the period from October 1, 2010, through September 30, 2011, using historical simulation with a 99% confidence level, a 10-day holding period andan effective historical observation period of one year. The risk in a reference portfolio that does not contain derivatives is used as the measurement benchmark. Market risk is the risk tothe fund from an unfavorable change in market prices. The investment company determines the potential market risk by means of the qualified approach as defined by the DerivativesRegulation.In the reporting period, the average leverage effect from the use of derivatives was 2.2, whereby the total of the nominal amounts of the derivates in relation to the fund’s assets wasused for the calculation (nominal value method).Market abbreviationsFutures exchangesEURX = Eurex (Eurex Frankfurt/Main / Eurex Zürich)HKFE = HKEx - Hong Kong Futures Exchange (HKFE)86
<strong>DWS</strong> Global Small/Mid CapExchange rates (indirect quotes)As of September 30, 2011Australian dollar . . . . . . . . . . . . . . . . . AUD 1.387791 = EUR 1Brazilian real . . . . . . . . . . . . . . . . . . . . BRL 2.492147 = EUR 1Canadian dollar . . . . . . . . . . . . . . . . . CAD 1.410337 = EUR 1Swiss franc . . . . . . . . . . . . . . . . . . . . . CHF 1.219851 = EUR 1Danish krone . . . . . . . . . . . . . . . . . . . . DKK 7.441613 = EUR 1British pound . . . . . . . . . . . . . . . . . . . GBP 0.868596 = EUR 1Hong Kong dollar . . . . . . . . . . . . . . . . HKD 10.539165 = EUR 1Japanese yen . . . . . . . . . . . . . . . . . . . JPY 103.769902 = EUR 1South Korean won . . . . . . . . . . . . . . . KRW 1 597.544080 = EUR 1Norwegian krone . . . . . . . . . . . . . . . . NOK 7.893246 = EUR 1New Zealand dollar . . . . . . . . . . . . . . . NZD 1.771235 = EUR 1Singapore dollar . . . . . . . . . . . . . . . . . SGD 1.754873 = EUR 1Turkish lira . . . . . . . . . . . . . . . . . . . . . . TRY 2.515726 = EUR 1Taiwan dollar . . . . . . . . . . . . . . . . . . . . TWD 41.242574 = EUR 1U.S. dollar . . . . . . . . . . . . . . . . . . . . . USD 1.352590 = EUR 1Notes on the valuationThe Custodian shall determine the value with the participation of the investment company. The Custodian generally bases its valuation on external sources.If no trading prices are available, prices are determined with the aid of valuation models (derived market values) which are agreed between the Custodian and the investment companyand which are based as far as possible on market parameters. This procedure is subject to an ongoing monitoring process. The plausibility of price information from third parties is checkedthrough other pricing sources, model calculations or other suitable procedure.Investments reported in this report are not valued at derived market values.Footnotes3) These securities were completely or partly transferred under securities loans. The equivalent value of the lent securities is EUR 272 382.64.Transactions completed during the reporting period that no longer appear in the investment portfolioPurchases and sales of securities, investment fund units and promissory note loans (Schuldscheindarlehen); market classifications are as of the reporting dateDescriptionCount/currency(– / ’000)Purchases/additionsSales/disposalsDescriptionCount/currency(– / ’000)Purchases/additionsSales/disposalsSecurities traded on an exchangeEquitiesMacarthur Coal (AU000000MCC0) . . . . . . . . . . . . . . Count 130 000 130 000Centerra Gold (CA1520061021) . . . . . . . . . . . . . . . . Count 200 000 200 000Eastern Platinum (CA2768551038) . . . . . . . . . . . . . . Count 1 100 000 1 100 000Gammon Gold (CA36467T1066) . . . . . . . . . . . . . . . . Count 410 000 850 000Iamgold (CA4509131088) . . . . . . . . . . . . . . . . . . . . . Count 125 000 125 000NovaGold Resources (CA66987E2069) . . . . . . . . . . Count 330 000Actelion Reg. (CH0010532478) . . . . . . . . . . . . . . . . Count 25 000 25 000Bucher Industries Reg. (CH0002432174) . . . . . . . . . Count 7 000alstria office REIT (DE000A0LD2U1) . . . . . . . . . . . . Count 7 500 7 500Andritz (AT0000730007) . . . . . . . . . . . . . . . . . . . . . . Count 5 000 18 000ASML Holding (NL0006034001) . . . . . . . . . . . . . . . . Count 46 000 46 000Atos Origin (FR0000051732) . . . . . . . . . . . . . . . . . . Count 70 000 70 000Azimut Holding (IT0003261697) . . . . . . . . . . . . . . . . Count 277 000 277 000Banca Popolare di Milano (IT0000064482) . . . . . . . . Count 730 000 730 000CENTROTEC Sustainable (DE0005407506) . . . . . . . Count 39 000 79 000Demag Cranes (DE000DCAG010) . . . . . . . . . . . . . . Count 3 565 33 565Deutsche Wohnen (DE000A0HN5C6) . . . . . . . . . . . Count 93 140 93 140DEUTZ (DE0006305006) . . . . . . . . . . . . . . . . . . . . . . Count 300 000 300 000Gagfah (LU0269583422) . . . . . . . . . . . . . . . . . . . . . . Count 164 626 164 626Gamesa Corporacion Tecnologica (ES0143416115) . Count 253 030Grontmij (NL0000853034) . . . . . . . . . . . . . . . . . . . . Count 80 000HeidelbergCement (DE0006047004) . . . . . . . . . . . . Count 10 000 37 000Hochtief (DE0006070006) . . . . . . . . . . . . . . . . . . . . Count 23 400 23 400K+S (DE0007162000) . . . . . . . . . . . . . . . . . . . . . . . . Count 25 000 25 000Koninklijke DSM (NL0000009827) . . . . . . . . . . . . . . Count 13 500 13 500Landi Renzo (IT0004210289) . . . . . . . . . . . . . . . . . . Count 250 000 250 000Lenzing (AT0000644505) . . . . . . . . . . . . . . . . . . . . . Count 2 000 2 000PostNL (NL0009739416) . . . . . . . . . . . . . . . . . . . . . Count 80 000 80 000RHÖN-KLINIKUM (DE0007042301) . . . . . . . . . . . . . Count 155 000 155 000SBM Offshore (NL0000360618) . . . . . . . . . . . . . . . . Count 40 000 110 000TNT (NL0000009066) . . . . . . . . . . . . . . . . . . . . . . . . Count 90 000 90 000TNT Express (NL0009739424) . . . . . . . . . . . . . . . . . Count 45 000 45 000Ubisoft Entertainment (FR0000054470) . . . . . . . . . . Count 190 000Unione di Banche Italiane (IT0003487029) . . . . . . . . Count 320 000 320 000Vossloh (DE0007667107) . . . . . . . . . . . . . . . . . . . . . Count 4 000 4 000Afren (GB00B0672758) . . . . . . . . . . . . . . . . . . . . . . . Count 180 000 180 000African Barrick Gold (GB00B61D2N63) . . . . . . . . . . Count 150 000 150 000Balfour Beatty (GB0000961622) . . . . . . . . . . . . . . . . Count 300 000 300 000Cairn Energy (GB00B59MW615) . . . . . . . . . . . . . . . Count 105 000 105 000Hansen Transmissions International(BE0947727377) . . . . . . . . . . . . . . . . . . . . . . . . . . . . Count 2 121 940Lonmin (GB0031192486) . . . . . . . . . . . . . . . . . . . . . Count 75 000 75 000Promethean World (GB00B60B6S45) . . . . . . . . . . . Count 1 600 000 1 600 000Randgold Resources (GB00B01C3S32) . . . . . . . . . . Count 27 000 27 000TUI Travel (GB00B1Z7RQ77) . . . . . . . . . . . . . . . . . . Count 950 000 950 000Xchanging (GB00B1VK7X76) . . . . . . . . . . . . . . . . . . Count 450 000 2 400 000Beijing Capital Intern. Airport Co. Cl.H (new)(CNE100000221) . . . . . . . . . . . . . . . . . . . . . . . . . . . . Count 3 300 000 3 300 000China Communications Construction (new)(CNE1000002F5) . . . . . . . . . . . . . . . . . . . . . . . . . . . . Count 1 100 000 3 100 000China Railway Group (CNE1000007Z2) . . . . . . . . . . Count 2 800 000 5 200 000International Mining Machinery Holdings(KYG488581078) . . . . . . . . . . . . . . . . . . . . . . . . . . . . Count 2 200 000 2 200 00087
<strong>DWS</strong> Global Small/Mid CapDescriptionCount/currency(– / ’000)Purchases/additionsSales/disposalsDescriptionCount/currency(– / ’000)Purchases/additionsSales/disposalsDaiwa Securities Group (JP3502200003) . . . . . . . . . Count 600 000Disco Corp. (JP3548600000) . . . . . . . . . . . . . . . . . . Count 23 000Ibiden Co. (JP3148800000) . . . . . . . . . . . . . . . . . . . Count 60 000ITOCHU Corp. (JP3143600009) . . . . . . . . . . . . . . . . Count 325 000 325 000Kawasaki Kisen Kaisha (JP3223800008) . . . . . . . . . Count 150 000 550 000Mitsubishi Heavy Industries (JP3900000005) . . . . . Count 600 000Mitsui O.S.K. Lines (JP3362700001) . . . . . . . . . . . . Count 120 000 320 000Mizuho Financial Group (JP3885780001) . . . . . . . . . Count 1 050 000Nippon Yusen (JP3753000003) . . . . . . . . . . . . . . . . Count 450 000Nomura Holdings (JP3762600009) . . . . . . . . . . . . . . Count 450 000Panasonic Corp. (JP3866800000) . . . . . . . . . . . . . . . Count 250 000Shiseido Co. (JP3351600006) . . . . . . . . . . . . . . . . . . Count 70 000 110 000Stanley Electric Co. (JP3399400005) . . . . . . . . . . . . Count 60 000 140 000Sumitomo Corp. (JP3404600003) . . . . . . . . . . . . . . Count 235 000 235 000Suzuki Motor Corp. (JP3397200001) . . . . . . . . . . . . Count 20 000 80 000Toshiba Corp. (JP3592200004) . . . . . . . . . . . . . . . . . Count 500 000Toyoda Gosei Co. (JP3634200004) . . . . . . . . . . . . . . Count 30 000 110 000Yakult Honsha Co. (JP3931600005) . . . . . . . . . . . . . Count 35 000LG Philips LCD Co. (KR7034220004) . . . . . . . . . . . . Count 65 000 65 000Petroleum Geo-Services (new) (NO0010199151) . . Count 119 500 119 500Yara International (NO0010208051) . . . . . . . . . . . . . Count 45 000 45 000Svenska Cellulosa B (Free) (SE0000112724) . . . . . . Count 40 000 40 000TradeDoubler (SE0001552357) . . . . . . . . . . . . . . . . . Count 601 540Singapore Airport Terminal Services(SG1I52882764) . . . . . . . . . . . . . . . . . . . . . . . . . . . . Count 750 000 750 000AU Optronics Corp. (TW0002409000) . . . . . . . . . . . Count 1 500 000 1 500 000Wintek (TW0002384005) . . . . . . . . . . . . . . . . . . . . . Count 500 000 500 000A123 Systems (US03739T1088) . . . . . . . . . . . . . . . Count 150 000Acorda Therapeutics (US00484M1062) . . . . . . . . . . Count 75 000 75 000Advanced Energy Industries (US0079731008) . . . . . Count 55 000 255 000AGCO Corp. (US0010841023) . . . . . . . . . . . . . . . . . Count 37 000 37 000Allegheny Energy (US0173611064) . . . . . . . . . . . . . Count 80 000Alnylam Pharmaceuticals (US02043Q1076) . . . . . . . Count 85 000American Superconductor Corp. (US0301111086) . . Count 100 127 100 127Arch Coal (US0393801008) . . . . . . . . . . . . . . . . . . . Count 77 000 77 000Archer-Daniels-Midland Co. (US0394831020) . . . . . Count 35 000 95 000Bank of New York Mellon (US0640581007) . . . . . . . Count 30 000Brocade Communications Systems (new)(US1116213067) . . . . . . . . . . . . . . . . . . . . . . . . . . . . Count 189 000 189 000Cameron International (US13342B1052) . . . . . . . . . Count 15 000 15 000Chesapeake Energy Corp. (US1651671075) . . . . . . Count 45 000 250 000Cimarex Energy Co. (US1717981013) . . . . . . . . . . . Count 5 000 5 000CNinsure ADR (US18976M1036) . . . . . . . . . . . . . . . Count 347 000 347 000Dendreon Corp. (US24823Q1076) . . . . . . . . . . . . . . Count 18 000Energizer Holdings (US29266R1086) . . . . . . . . . . . . Count 15 000Ensco International ADR (US29358Q1094) . . . . . . . Count 22 000 22 000Feihe International (US31429Y1038) . . . . . . . . . . . . Count 170 000 170 000Gold Fields ADR (US38059T1060) . . . . . . . . . . . . . . Count 35 000 205 000GT Solar International (US3623E02092) . . . . . . . . . . Count 125 000 225 000Harmony Gold Mining ADR (US4132163001) . . . . . Count 170 000 580 000Helix Energy Solutions Group (US42330P1075) . . . . Count 158 000 158 000Hess (US42809H1077) . . . . . . . . . . . . . . . . . . . . . . . Count 60 000Hollysys Automation Technologies(VGG456671053) . . . . . . . . . . . . . . . . . . . . . . . . . . . Count 205 000 205 000Intrepid Potash (US46121Y1029) . . . . . . . . . . . . . . . Count 45 000 45 000Keycorp (US4932671088) . . . . . . . . . . . . . . . . . . . . . Count 180 000 180 000Lexmark International A (US5297711070) . . . . . . . . Count 75 000 75 000Longtop Financial Technologies ADR(US54318P1084) . . . . . . . . . . . . . . . . . . . . . . . . . . . . Count 85 000 85 000Micron Technology (US5951121038) . . . . . . . . . . . . Count 150 000Mindray Medical International ADR(US6026751007) . . . . . . . . . . . . . . . . . . . . . . . . . . . . Count 103 000 103 000Myriad Genetics (US62855J1043) . . . . . . . . . . . . . . Count 120 000Nalco Holding Co. (US62985Q1013) . . . . . . . . . . . . Count 65 000 65 000Nasdaq Stock Market (US6311031081) . . . . . . . . . . Count 180 000Natl Oilwell Varco (US6370711011) . . . . . . . . . . . . . Count 35 000Netease.Com ADR (US64110W1027) . . . . . . . . . . . Count 70 000 70 000Noble Reg. (CH0033347318) . . . . . . . . . . . . . . . . . . Count 36 000 36 000Novell (US6700061053) . . . . . . . . . . . . . . . . . . . . . . Count 80 000 448 200NYSE EURONEXT (US6294911010) . . . . . . . . . . . . . Count 35 000Oasis Petroleum (new) (US6742151086) . . . . . . . . . Count 40 000 40 000Onyx Pharmaceuticals (US6833991093) . . . . . . . . . Count 30 000Parker-Hannifin Corp. (US7010941042) . . . . . . . . . . Count 6 000 6 000Petrohawk Energy Corp. (US7164951060) . . . . . . . . Count 100 000 350 000Plains Exploration & Production Company(US7265051000) . . . . . . . . . . . . . . . . . . . . . . . . . . . . Count 80 000 80 000RTI International Metals (US74973W1071) . . . . . . . Count 60 000 60 000Seagate Technology (IE00B58JVZ52) . . . . . . . . . . . . Count 240 000State Street Corp. (US8574771031) . . . . . . . . . . . . . Count 24 000Symantec Corp. (US8715031089) . . . . . . . . . . . . . . Count 130 000Synutra International (US87164C1027) . . . . . . . . . . Count 80 000 150 000The Williams Cos. (US9694571004) . . . . . . . . . . . . . Count 42 111 42 111Titanium Metals Corp. (new) (US8883392073) . . . . Count 58 000 58 000Ultra Petroleum (CA9039141093) . . . . . . . . . . . . . . . Count 21 000 81 000United Therapeutics Corp.(Del.) (US91307C1027) . . Count 13 500 13 500VisionChina Media ADR (US92833U1034) . . . . . . . . Count 530 000 530 000Securities that are admitted or included in organized marketsEquitiesKOSE Corp. (JP3283650004) . . . . . . . . . . . . . . . . . . Count 70 000 70 000Unlisted securitiesEquitiesUnione di Banche Italiane Right (IT0004726615) . . . Count 260 000 260 000Derivatives (option premiums realized in opening transactions, or total optionstransactions; in the case of warrants, purchases and sales are shown)WarrantsWarrants on securitiesAdditionsDisposalsEquity warrantsMerrill Lynch WRT 12.01.16 Everonn Education(CWN5642Q1341) . . . . . . . . . . . . . . . . . . . . . . . . . . Count 110 000 110 000Merrill Lynch WRT 14.10.15 Sintex Industries(ANN5641R4637) . . . . . . . . . . . . . . . . . . . . . . . . . . . Count 800 000 800 000ML WRT 25.11.15 Quanta Computer(ANN5641R7523) . . . . . . . . . . . . . . . . . . . . . . . . . . . Count 750 000 750 000ML WRT 25.11.15 TXC (ANN5641R7606) . . . . . . . . Count 700 000 700 000ML WRT 30.07.15 Wistron (ANN5640V8799) . . . . . Count 1 600 000 1 600 000Futures contractsSecurities futuresValue (’000)Equity futuresContracts sold: EUR 21 026(Underlyings: Amazon.com, Antofagasta, Baidu, Caterpillar,salesforce.com)Equity index futuresContracts purchased: EUR 398 319(Underlyings: DAX (performance index), Dow Jones Euro STOXXBank, Dow Jones STOXX 600 Insurance Index, Euro Stoxx 50 DVPIndex, Euro STOXX 50 Price Euro, FTSE MIB Index, Hang SengChina Enterprises Index, Hang Seng Index, MDAX PerformanceIndex, Nikkei 225. Russell 2000 Index)Contracts sold: EUR 216 853(Underlyings: Euro STOXX 50 Price Euro, Istanbul Stock ExchangeNational 30 Index, MDAX Performance Index, Nasdaq 100 Index,Nikkei 225. Russell 2000 Index, S&P 500 Index)88
<strong>DWS</strong> Global Small/Mid CapDerivatives (option premiums realized in opening transactions, or total optionstransactions; in the case of warrants, purchases and sales are shown)Currency futuresValue (’000)Futures contracts to purchase currenciesEUR/CHF EUR 12 978EUR/GBP EUR 29 986EUR/HKD EUR 9 980EUR/JPY EUR 109 835EUR/USD EUR 113 878KRW/EUR EUR 64 000USD/AUD EUR 17 066USD/EUR EUR 5 617USD/CHF EUR 10 568USD/JPY EUR 71 107Securities loans (total transactions, at the value agreed at the closing of the loancontract)Value (’000)Perpetual EUR 50 592(Security description: A123 Systems, Actelion Reg., Alnylam Pharmaceuticals,Alpha Natural Resources, American Superconductor Corp., AxelSpringer Vink. Reg., Banca Popolare di Milano, Bauer, Capitaland,China Communications Construction (new), CNinsure ADR, DemagCranes, Feihe International, Gagfah, Gamesa CorporacionTecnologica, HeidelbergCement, Hollysys Automation Technologies,Lonking Holdings (new), Marine Harvest, Mindray MedicalInternational ADR, Pandora, Prysmian, SBM Offshore, SynutraInternational, Trina Solar (Sp. ADR), Ubisoft Entertainment, Unionedi Banche Italiane, Unione di Banche Italiane Right, VisionChinaMedia ADR, Wolters Kluwer, Xchanging, Yingli Green EnergyHolding Co.)Futures contracts to sell currenciesEUR/CAD EUR 11 000EUR/JPY EUR 32 998EUR/USD EUR 84 945USD/AUD EUR 16 114Option contractsSecurities optionsEquity optionsPut options purchased: EUR 51 800(Underlyings: SPDR Series Trust - S&P Retail ETF)Options on equity index derivativesOptions on equity indicesPut options purchased: EUR 782 286(Underlyings: DAX (performance index), Euro STOXX 50 Price Euro,Nasdaq 100 Index, S&P 500 Index)89
<strong>DWS</strong> Global Small/Mid CapStatement of income and expenses (incl. income adjustment)Performance of the investment fund 2010/2011for the period from October 1, 2010, through September 30, 2011I. Income1. Dividends from domestic issuers . . . . . . . . . . . . . . . . . . EUR 69 860.572. Dividends from foreign issuers(before withholding tax) . . . . . . . . . . . . . . . . . . . . . . . . . EUR 470 987.913. Interest from investments of liquid assets in Germany . EUR 17 812.264. Income from securities lendingand repurchase agreements . . . . . . . . . . . . . . . . . . . . . . EUR 69 175.34including:from securities lending . . . . . . . . .EUR 69 175.345. Deduction for foreign withholding tax . . . . . . . . . . . . . . EUR -1 229.216. Other income . . . . . . . . . . . . . . . . . . . . . . . . . . . . . . . . . EUR 52 139.59Total income . . . . . . . . . . . . . . . . . . . . . . . . . . . . . . . . . . . . EUR 678 746.46II. Expenses1. Interest on borrowings . . . . . . . . . . . . . . . . . . . . . . . . . . EUR -13 205.952. Management fee . . . . . . . . . . . . . . . . . . . . . . . . . . . . . . EUR -730 010.04including:All-in fee . . . . . . . . . . . . . . . . . . . .EUR -730 010.043. Other expenses . . . . . . . . . . . . . . . . . . . . . . . . . . . . . . . EUR -37 127.42including:Performance-based fee fromsecurities lending income . . . . . . .EUR -34 587.68Legal expenses . . . . . . . . . . . . . . .EUR -2 539.74Total expenses . . . . . . . . . . . . . . . . . . . . . . . . . . . . . . . . . . EUR -780 343.41III. Net investment income . . . . . . . . . . . . . . . . . . . . . . . . EUR -101 596.95IV. Sale transactionsRealized gains . . . . . . . . . . . . . . . . . . . . . . . . . . . . . . . . . . . . EUR 23 114 305.44Realized losses . . . . . . . . . . . . . . . . . . . . . . . . . . . . . . . . . . . EUR -33 094 409.33Capital gains/losses . . . . . . . . . . . . . . . . . . . . . . . . . . . . . . EUR -9 980 103.89V. Net gain/loss for the fiscal year . . . . . . . . . . . . . . . . . . EUR -10 081 700.84I. Value of the investment fund at the beginningof the fiscal year . . . . . . . . . . . . . . . . . . . . . . . . . . . . . . EUR 133 106 971.611. Previous year's distribution or tax abatement . . . . . . . . EUR -147 649.652. Net inflows . . . . . . . . . . . . . . . . . . . . . . . . . . . . . . . . . . . EUR -71 981 703.18a) Inflows from subscriptions . . . . . . . . . . . . . . . . . . . . EUR 151 501 218.20b) Outflows from redemptions . . . . . . . . . . . . . . . . . . . EUR -223 482 921.383. Income adjustment and reimbursed expenses . . . . . . . EUR -4 649 401.934. Net investment income . . . . . . . . . . . . . . . . . . . . . . . . . EUR -101 596.955. Realized gains . . . . . . . . . . . . . . . . . . . . . . . . . . . . . . . . . EUR 23 114 305.446. Realized losses . . . . . . . . . . . . . . . . . . . . . . . . . . . . . . . . EUR -33 094 409.337. Net change in unrealized appreciation/depreciation . . . . EUR -7 064 463.36II. Value of the investment fund atthe end of the fiscal year . . . . . . . . . . . . . . . . . . . . . . . EUR 39 182 052.65Distribution policy of the investment fundTotalPer unitI. Calculation of distribution1. Balance brought forwardfrom previous year . . . . . . . . . . . . . . . . . . EUR 7 692 101.62 6.832. Net gain/loss for the fiscal year . . . . . . . . EUR -10 081 700.84 -8.963. Transfer from the investment fund *) . . . EUR 2 389 599.22 2.13II. Total distribution . . . . . . . . . . . . . . . . . . EUR 0.00 0.00*) Due to the negative ordinary net return and the losses realized, a transfer from theinvestment fund was necessary.Changes in net assets and in the net asset value perunit over the last three yearsTotal expense ratio (in accordance with article 41 (2) of the InvGThe total expense ratio was 1.46% p.a. The TER expresses total expenses and fees(excluding transaction costs) as a percentage of the fund’s average net assets for a givenfiscal year.As well, the additional income from securities lending resulted in a performance-basedfee of 0.068% p.a. calculated on the fund’s average net assets.Information provided in accordance with article 41 (4) and (5) of the InvG (Costs and CostTransparency).Net assetsat the end ofthe fiscal year EURNet assetvalue perunit EUR2011 . . . . . . . . . . . . . . . . . . . . . . . . . . . . . . . . . . . . 39 182 052.65 34.812010 . . . . . . . . . . . . . . . . . . . . . . . . . . . . . . . . . . . . 133 106 971.61 45.562009 . . . . . . . . . . . . . . . . . . . . . . . . . . . . . . . . . . . . 111 322 844.66 41.062008 . . . . . . . . . . . . . . . . . . . . . . . . . . . . . . . . . . . . 72 060 186.58 36.06In the fiscal year from October 1, 2010, through September 30, 2011, the investmentcompany, <strong>DWS</strong> Investment GmbH, was not reimbursed for the fees and expenses paidby <strong>DWS</strong> <strong>DWS</strong> Global Small/Mid Cap to the Custodian and other third parties, except inthe form of financial information provided by brokers for research purposes.An all-in fee of 1.45% per year is payable to the investment company under the Terms ofContract. Of this annual fee, the investment company in turn pays up to 0.15% to theCustodian and up to 0.05% to other parties (for printing and publication costs, auditing andother items). Of its own portion of the all-in fee, the investment company pays more than10% in commissions to distributors of the fund; the specific percentage paid is based onthe balance of units distributed.Transaction costsThe transaction costs paid in the reporting period amounted to EUR 1 514 472.17.The transaction costs include all costs that were reported or settled separately for theaccount of the fund in the reporting period and are directly connected to the purchase orsale of assets.Transactions processed for the account of the fund’s assets via closely related companies (based on major holdings of the Deutsche Bank Group)The share of transactions conducted for the account of the investment fund’s assets via brokers that are closely related companies and persons (share of five percent and above), amountedto 5.81 percent of all transactions. The total volume was EUR 34 941 616.18.90
Independentauditor’s reportKPMG issued an unqualified auditor's report forthe full annual report in accordance with article 44 (5)of the German Investment Act. The translation of theauditor's report is as follows:To <strong>DWS</strong> Investment GmbH, Frankfurt/Main, GermanyIn accordance with article 44 (5) of the German Investment Act (Investmentgesetz;InvG), <strong>DWS</strong> Investment GmbH commissioned us to perform the audit of the annualreport of the investment fund <strong>DWS</strong> Global Small/Mid Cap for the fiscal year fromOctober 1, 2010, through September 30, 2011.Responsibility of the legal representativesThe preparation of the annual report according to the provisions of the InvG is theresponsibility of the legal representatives of the investment company.Responsibility of the auditorsOur responsibility is to express an opinion on the annual report based on our audit.We conducted our audit in accordance with article 44 (5) InvG and generally acceptedGerman standards for the audit of financial statements promulgated by the Institut derWirtschaftsprüfer (Institute of Public Auditors in Germany; IDW). Those standardsrequire that we plan and perform the audit such that misstatements materially affectingthe annual report are detected with reasonable assurance. Knowledge of themanagement of the investment fund and expectations as to possible misstatementsare taken into account in the determination of audit procedures. The effectiveness ofthe accounting-related internal control system and the evidence supporting thedisclosures in the annual report are examined primarily on a test basis within theframework of the audit. The audit includes assessing the accounting principles usedfor the annual report and significant estimates made by the legal representatives ofthe investment company. In our view, our audit provides a reasonably secure basis forour evaluation.Audit opinionOur audit has not led to any reservations.In our opinion, based on the findings of our audit, the annual report complies with thelegal requirements.Frankfurt/Main, December 20, 2011KPMG AGWirtschaftsprüfungsgesellschaftHornschuWirtschaftsprüferNeufWirtschaftsprüfer91
Investment CompanyCustodianManagement<strong>DWS</strong> Investment GmbHD-60612 Frankfurt/MainLiable equity capital as of December 31, 2010:EUR 117.3 millionSubscribed and paid-in capitalas of December 31, 2010: EUR 115 millionSupervisory BoardDr. Hugo BänzigerMember of the Management Board ofDeutsche Bank AG, Frankfurt/MainChairmanArne WittigDeutsche Bank AG, Frankfurt/MainVice-ChairmanMartin Edelmann (until June 30, 2011)Deutsche Bank AG,Frankfurt/MainDr. Roland Folz (since July 6, 2011)Deutsche Bank AG,Frankfurt/MainState Street Bank GmbHBrienner Straße 59D-80333 MünchenLiable equity capital as of December 31, 2010:EUR 1,327.30 millionSubscribed and paid-in capitalas of December 31, 2010: EUR 108 millionWolfgang Matis (since January 1, 2011)Managing Director of<strong>DWS</strong> Holding & Service GmbH, Frankfurt/MainChairman of the Board of Directors of<strong>DWS</strong> Investment S.A., LuxembourgHolger NaumannManaging Director of<strong>DWS</strong> Holding & Service GmbH, Frankfurt/MainDr. Asoka WöhrmannManaging Director of<strong>DWS</strong> Holding & Service GmbH, Frankfurt/MainManaging Director of<strong>DWS</strong> Finanz-Service GmbH, Frankfurt/MainIngo Gefeke (until February 14, 2011)Frankfurt/MainKlaus Kaldemorgen (until December 31, 2010)Managing Director of<strong>DWS</strong> Holding & Service GmbH, Frankfurt/MainManaging Director ofDeutsche Asset Management International GmbH,Frankfurt/MainDr. Stefan MarcinowskiMember of the Management Board ofBASF SE,LudwigshafenDr. Edgar MeisterFormer member of the Executive Board of theDeutsche Bundesbank,Frankfurt/MainAxel Schwarzer (until February 14, 2011)Frankfurt/MainShareholder of<strong>DWS</strong> Investment GmbH<strong>DWS</strong> Holding & Service GmbH,Frankfurt/MainFriedrich von MetzlerPartner in the banking firmB. Metzler seel. Sohn & Co. KGaA,Frankfurt/MainProf. Dr. jur. Dr. h. c. Reinfried PohlChairman of the Management Board ofDeutsche Vermögensberatung AG,Frankfurt/MainThomas RodermannDeutsche Bank AG,Frankfurt/MainChristian StrengerFrankfurt/MainAs of: October 31, 2011
<strong>DWS</strong> Investment GmbHD-60612 Frankfurt/MainTel.: +49 (0)1803 10 11 10 11Fax: +49 (0)1803 10 11 10 50www.dws.com