Panel de función renal Piccolo - Abaxis
Panel de función renal Piccolo - Abaxis
Panel de función renal Piccolo - Abaxis

Create successful ePaper yourself
Turn your PDF publications into a flip-book with our unique Google optimized e-Paper software.
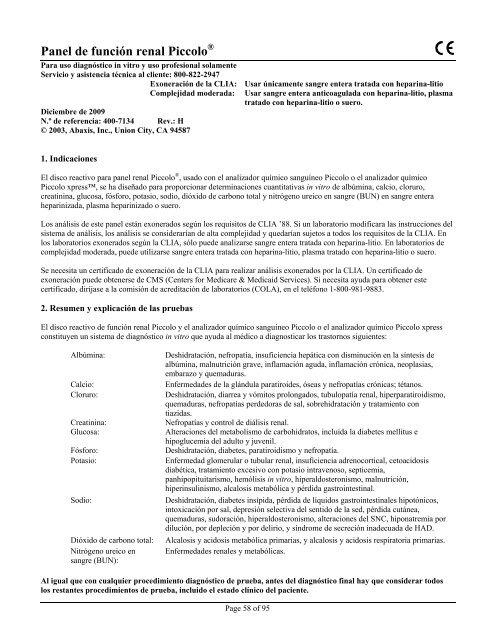
acopladas. 40,41 Sin embargo, los procedimientos <strong>de</strong> Berthelot catalizados son erráticos cuando se mi<strong>de</strong> el amoníaco. 42 Lasreacciones enzimáticas acopladas son rápidas, tienen una elevada especificidad para el amoníaco, y son las usadashabitualmente. Una <strong>de</strong> estas reacciones fue propuesta como posible método <strong>de</strong> referencia. 43En la reacción <strong>de</strong> acoplamiento <strong>de</strong> enzimas, la ureasa hidroliza la urea en amoníaco y dióxido <strong>de</strong> carbono. Tras la combinación<strong>de</strong>l amoníaco con α-cetoglutarato y la reducción <strong>de</strong> nicotinamida a<strong>de</strong>nina dinucleótido (NADH), la enzima glutamato<strong>de</strong>shidrogenasa (GLDH) oxida la NADH en NAD + .UreasaUrea + H 2 O NH 3 + CO 2GLDHNH 3 + α-cetoglutarato + NADH + H + L-Glutamato + H 2 O + NAD +El índice <strong>de</strong> cambio <strong>de</strong> la diferencia <strong>de</strong> absorbancia entre 340 nm y 405 nm se <strong>de</strong>be a la conversión <strong>de</strong> NADH en NAD + y esdirectamente proporcional a la cantidad <strong>de</strong> urea en la muestra.4. Principios <strong>de</strong> funcionamientoConsulte el Manual <strong>de</strong>l usuario <strong>de</strong>l analizador químico sanguíneo <strong>Piccolo</strong> o el analizador químico <strong>Piccolo</strong> xpress para obtenerinformación sobre los principios y limitaciones <strong>de</strong>l procedimiento.5. Descripción <strong>de</strong> los reactivosReactivosCada disco reactivo con panel <strong>renal</strong> <strong>Piccolo</strong> contiene soportes sólidos reactivos secos específicos para la prueba (<strong>de</strong>scritos acontinuación). Se incluye un reactivo seco <strong>de</strong> muestra <strong>de</strong> referencia (compuesto por amortiguador, surfactantes, excipientes yconservantes) en cada disco para usar en el cálculo <strong>de</strong> las concentraciones <strong>de</strong> albúmina (ALB), cloruro (CL - ), calcio (CA),glucosa (GLU), fósforo (PHOS), potasio (K+), sodio (NA+), dióxido <strong>de</strong> carbono total (tCO 2 ) y nitrógeno ureico en sangre(BUN). En el disco se incluye una muestra <strong>de</strong> referencia <strong>de</strong>dicada para calcular la concentración <strong>de</strong> creatinina (CRE). Cadadisco también contiene un diluyente que consta <strong>de</strong> surfactantes y estabilizantes.Tabla 1: ReactivosComponentesCantidad/DiscoN-Acetil cisteína 60 µgA<strong>de</strong>nosina 5'-difosfato 36 µgA<strong>de</strong>nosina 5'-trifosfato 22 µgΑcido α-cetoglutárico 19 µg4-Aminoantipirina clorhidrato 13 µgAmilasa0,036 UArsenazo III, sal sódica 1,7 µgAscorbato oxidasa (cucurbita spp.)0,3 UBrij 3 µgPúrpura <strong>de</strong> bromocresol, sal sódica 0,2 µgAcetato <strong>de</strong> calcio 25 µgÁcido cítrico, sal trisódica 567 µg2-cloro-4-nitrofenil-α-maltotriosida (CNPG3) 53 µgCreatina amidinohidrolasa (actinobacillus spp.)3 UCreatinina amidohidrolasa (pseudomonas spp.)1 UÁcido etilendiaminotetraacético (EDTA) 182 µgÁcido etilendiaminatetraacético (EDTA), sal disódica 15 µgÁcido etilenglicol-bis(β-aminoetil éter)-N,N,N’,N’-tetraacético (EGTA) 4 µgβ-Galactosidasa0,005 UGlucosa-1,6-difosfato 1 µgÁcido L-glutámico 9,2 µgGlutamato <strong>de</strong>shidrogenasa0,1 UPage 62 of 95
Tabla 2: Sustancias terapéuticas y exógenas evaluadasFactores <strong>de</strong> interferencia potencialesConcentración máxima analizada(mg/dL salvo don<strong>de</strong> se indiquen otras unida<strong>de</strong>s)Paracetamol 100Acetoacetato 102Ácido acetilsalicílico 50Ampicilina 30Ácido ascórbico 3Cafeína 10Cefalotina (Keflin) 400Cloranfenicol 100Cimetidina 16Dopamina 13Epinefrina 1Eritromicina 10Glutationa 30Hidroclorotiazida 7,5Ibuprofeno 50Isoniacida 4Cetoprofen 50L-dopa 5Lidocaína 1Lactato <strong>de</strong> litio 84Meticilina 100Metotrexato 0,5Metronidazol 5Nafcilina 1Nitrofurantoína 20Oxacilina 1Oxaloacetato 132Penicilina G 100Fenitoína (5,5-Difenilhidantoína) 3Prolina 4Rifampina 0,5Ácido salicílico 50Sulfadiazina 150Sulfanilamida 50Teofilina 20En la Tabla 3 pue<strong>de</strong> consultar una lista <strong>de</strong> los analitos en los que se observaron interferencias.Page 67 of 95
Tabla 3: Las sustancias siguientes mostraron un <strong>de</strong>svío superior al ±10% en el resultado para una muestra <strong>de</strong>ntro <strong>de</strong>los límites normales.Concentración a la que % Interferencia Ase produce > 10% observadala interferenciaAlbúminaAcetoacetato 102 18% dism.Ampicilina 30 12% dism.Cafeína 10 14% dism.Cloruro <strong>de</strong> calcio 20 17% dism.Cefalotina (Keflin) 400 13% aum.Ibuprofeno 50 28% aum.α-cetoglutarato 5 11% dism.Nitrofurantoína 20 13% dism.Prolina 4 12% aum.Sulfadiazina 10 14% dism.Sulfanilamida 50 12% dism.Teofilina 20 11% dism.CreatininaÁcido ascórbico 20 11% dism.Dopamina 19 80% dism.L-dopa 5 71% dism.Epinefrina 1 45% dism.Glutationa 30 13% dism.GlucosaOxaloacetato 132 11% dism.Piruvato 44 13% dism.FósforoNitrofurantoína 20 19% aum.Oxaloacetato 132 14% dism.PotasioPenicilina G 100 17% aum.Sulfadiazina 150 12% dism.SodioCefalotina 400 12% aum.Metotrexato 0,5 11% aum.Penicilina G 100 10% aum.Dióxido <strong>de</strong> carbono totalParacetamol 100 11% aum.Ácido ascórbico 20 12% dism.Cefalotina 400 13% aum.Cimetidina 16 19% dism.Eritromicina 10 21% dism.Lidocaína 1 23% aum.Metotrexato 0,5 80% dism.Nitrofurantoína 20 13% aum.Ácido salicílico 50 17% dism.Sulfadiazina 150 25% dism.A Dism.= disminución en la concentración <strong>de</strong>l sustrato especificado; Aum. = aumento en la concentración <strong>de</strong>l sustrato especificado• Para la prueba <strong>de</strong> cloruro, el bromuro a niveles tóxicos (≥ 15 mmol/L) pue<strong>de</strong> causar un efecto significativo (>10% <strong>de</strong>aumento) sobre el resultado <strong>de</strong>l cloruro. El yoduro a concentraciones muy altas (30 mmol/L, el nivel más elevado quePage 68 of 95
( 0,06 mmol/L); potasio 1,5 mmol/L; sodio 110 mmol/L; dióxido <strong>de</strong> carbono total 5 mmol/L y nitrógeno ureico en sangre2,0 mg/dL (0,7 mmol urea/L).PrecisiónLos estudios <strong>de</strong> precisión se realizaron aplicando las directrices <strong>de</strong> CLSI (antiguamente NCCLS) EP5-A, con modificacionesbasadas en CLSI (antiguamente NCCLS) EP18-P para equipos utilizados en unidad. 57,58 Los resultados <strong>de</strong> precisión intraserialy total fueron <strong>de</strong>terminados por niveles <strong>de</strong> prueba <strong>de</strong> materiales <strong>de</strong> control disponibles comercialmente. Los estudios utilizaronmúltiples instrumentos. Las pruebas <strong>de</strong> precisión para albúmina, calcio, creatinina, glucosa, sodio y nitrógeno ureico fueronrealizadas en un centro; las <strong>de</strong> potasio y dióxido <strong>de</strong> carbono total fueron realizadas en dos centros a lo largo <strong>de</strong> 20 días; las <strong>de</strong>cloruro y fósforo fueron realizadas en dos centros a lo largo <strong>de</strong> 5 días. Los resultados <strong>de</strong> los estudios <strong>de</strong> precisión se muestranen la Tabla 6.Tabla 6: PrecisiónAnalito Tamaño <strong>de</strong> la muestra Intraserial TotalAlbúmina (g/dL) N = 80Control 1Media 5,6 5,6DE 0,09 0,11% CV 1,7 2,1Control 2Media 3,7 3,7DE 0,07 0,11% CV 2,0 2,9Calcio (mg/dL) N = 80Control 1Media 8,6 8,6DE 0,21 0,25% CV 2,4 2,9Control 2Media 11,8 11,8DE 0,39 0,40% CV 3,3 3,4Cloruro (mmol/L) N = 160Control 1Media 97,8 97,8DE 1,63 1,74% CV 1,7 1,7Control 2Media 113,6 113,6DE 1,97 2,22% CV 1,7 2,0Creatinina (mg/dL) N = 80Control 1Media 1,1 1,1DE 0,14 0,14% CV 12,5 13,1Control 2Media 5,2 5,2DE 0,23 0,27% CV 4,4 5,2Glucosa (mg/dL) N = 80Control 1Media 66 66DE 0,76 1,03% CV 1,1 1,6Page 70 of 95
Tabla 6: Precisión (continuación)Analito Tamaño <strong>de</strong> la muestra Intraserial TotalControl 2Media 278 278DE 2,47 3,84% CV 0,9 1,4Fósforo (mg/dL) N = 80Control 1Media 3,1 3,1DE 0,12 0,14% CV 3,7 4,7Control 2Media 7,3 7,3DE 0,09 0,15% CV 1,3 2,0Potasio (mmol/L) N = 120Control 1Media 6,12 6,12DE 0,32 0,32% CV 5,2 5,7Control 2Media 4,10 4,10DE 0,24 0,26% CV 5,9 6,3Sodio (mmol/L) N = 80Control 1Media 143,5 143,5DE 2,28 2,28% CV 1,6 1,6Control 2Media 120,0 120,0DE 2,13 2,13% CV 1,8 1,8Dióxido <strong>de</strong> carbonototal (mmol/L) N = 120Control 1Media 21,4 21,4DE 2,29 2,29% CV 10,7 10,7Control 2Media 10,5 10,5DE 0,90 0,90% CV 8,6 8,6Nitrógeno ureico (mg/dL) N = 80Control 1Media 19 19DE 0,35 0,40% CV 1,9 2,1Control 2Media 65 65DE 1,06 1,18% CV 1,6 1,8Page 71 of 95
CorrelaciónLas muestras <strong>de</strong> suero fueron obtenidas y analizadas en el analizador químico sanguíneo <strong>Piccolo</strong> y mediante un método <strong>de</strong>comparación. Las muestras fueron seleccionadas para cumplir con los valores <strong>de</strong> distribución en las directrices CLSI(antiguamente NCCLS) EP9-A. 59Tabla 7: Correlación <strong>de</strong>l analizador químico sanguíneo <strong>Piccolo</strong> o el analizador químico <strong>Piccolo</strong> Xpress y un método <strong>de</strong>comparaciónCorrelación<strong>de</strong> correlaciónAlbúmina (g/dL) 0,854Pendiente Intersección VER N MuestraIntervaloMétodo <strong>de</strong>comparación0,8961,0010,877-0,3-0,10,220,212611001,1-5,31,5-5,0Paramax ®BeckmanCalcio (mg/dL) 0,980 0,98 -0,17 0,31 111 4,6-13,2 BeckmanCloruro (mmol/L) 0,978 0,982 -1,1 1,84 120 71-118 Vitros ® 950Creatinina (mg/dL) 0,993 0,926 0,0 0,15 260 0,4–14,7 Paramax ®Glucosa (mg/dL) 0,9870,9971,0090,943-2,81,23,894,692519172-42256-646Paramax ®BeckmanFósforo (mg/dL) 0,993 1,017 -0,2 0,236 90 0,8 – 11,7 Vitros ® 950Potasio (mmol/L) 0,969 0,863 0,6 0,14 58 2,0 – 6,8 RadiómetroKNA ® 2Sodio (mmol/L) 0,937 0,782 27,7 3,79 113 116 - 154 RadiómetroKNA ® 2Dióxido <strong>de</strong> carbonototal (mmol/L)Nitrógeno ureicoen sangre (mg/dL)0,947 0,903 2,0 0,84 60 6 – 39 Cobas ® Fara0,983 0,946 0,0 0,66 92 6 – 38 BeckmanResultados <strong>de</strong> un estudio con usuarios sin preparaciónSe llevó a cabo un estudio con “usuarios sin preparación”, en el que los participantes, únicamente con las instrucciones <strong>de</strong>lanálisis que se les proporcionaban, <strong>de</strong>bían analizar tres discos con muestras aleatorizadas a ciegas. Las muestras se prepararona base <strong>de</strong> mezclas <strong>de</strong> sueros con tres niveles para cada uno <strong>de</strong> los diez analitos, albúmina, calcio, cloruro, creatinina, glucosa,fósforo, potasio, sodio, dióxido <strong>de</strong> carbono total y nitrógeno ureico en sangre (BUN). Los participantes no tenían ningunaformación en la realización <strong>de</strong>l análisis o el instrumento. Se reclutaron en total 62 participantes <strong>de</strong> 3 centros, que constituíanuna población diversa (estudios, edad, sexo, etc.) a efectos <strong>de</strong>mográficos.En las tablas siguientes se muestra un resumen <strong>de</strong>l rendimiento <strong>de</strong> cada analito.AlbúminaNivel 1 Nivel 2 Nivel 3Número 62 62 62Concentración objetivo 3,1 3,5 4,2Valor medio3,0 3,5 4,2por <strong>Piccolo</strong> (g/dL)DE 0,08 0,09 0,07% CV 2,7 % 2,5 % 1,8 %Intervalo observado 2,9 – 3,2 3,3 – 3,7 4,0 – 4,4Calcio (CA)Nivel 1 Nivel 2 Nivel 3Número 62 62 62Concentración objetivo 8,1 10,5 13,2Valor medio8,03 10,52 13,1por <strong>Piccolo</strong> (mg/dL)DE 0,14 0,15 0,18% CV 1,7 % 1,4 % 1,4 %Intervalo observado 7,7 – 8,4 10,1 – 11,0 12,6 – 13,4Page 72 of 95
Cloruro (CL - )Nivel 1 Nivel 2 Nivel 3Número 62 62 62Concentración objetivo 93 105 115Valor medio94,6 106 115,5por <strong>Piccolo</strong> (mmol/L)DE 1,66 1,5 1,74% CV 1,8 1,4 1,5Intervalo observado 90 – 100 102 – 108 110 – 119Creatinina (CRE)Nivel 1 Nivel 2 Nivel 3Número 62 62 62Concentración objetivo 0,9 2,1 6,9Valor medio0,89 2,07 6,89por <strong>Piccolo</strong> (mg/dL)DE 0,10 0,10 0,11% CV 11,2 % 4,8 % 1,6 %Intervalo observado 0,7 – 1,2 1,8 – 2,3 6,5 – 7,2GlucosaNivel 1 Nivel 2 Nivel 3Número 62 62 62Concentración objetivo 96 131 363Valor medio95,2 130,3 365,8por <strong>Piccolo</strong> (mg/dL)DE 1,08 1,33 2,85% CV 1,1 % 1,0 % 0,8 %Intervalo observado 93 – 98 125 – 133 351 – 373Fósforo (PHOS)Nivel 1 Nivel 2 Nivel 3Número 62 62 62Concentración objetivo 2,2 4,2 7,3Valor medio2,2 4,2 7,3por <strong>Piccolo</strong> (mg/dL)DE 0,10 0,11 0,09% CV 4,5 2,6 1,2Intervalo observado 2,0 – 2,5 4,0 – 4,5 7,1 – 7,5Potasio (K + )Nivel 1 Nivel 2 Nivel 3Número 62 62 62Concentración objetivo 3,4 5,6 7,2Valor medio3,42 5,66 7,19por <strong>Piccolo</strong> (mmol/L)DE 0,11 0,14 0,14% CV 3,3 2,5 1,9Intervalo observado 3,2 – 3,7 5,2 – 5,9 6,7 – 7,5Page 73 of 95
Sodio (NA + )Nivel 1 Nivel 2 Nivel 3Número 62 62 62Concentración objetivo 122 141 158Valor medio122,1 140,8 157,5por <strong>Piccolo</strong> (mmol/L)DE 1,25 1,15 1,63% CV 1,0 0,8 1,0Intervalo observado 118 – 127 138 – 143 154 – 162Dióxido <strong>de</strong> carbono total (tCO 2 )Nivel 1 Nivel 2 Nivel 3Número 62 62 62Concentración objetivo 21 28 33Valor medio20,3 27,6 34,4por <strong>Piccolo</strong> (mmol/L)DE 1,03 1,26 1,27% CV 5,1 4,6 3,7Intervalo observado 18 – 23 23 – 30 32 – 38Nitrógeno ureico en sangre (BUN)Nivel 1 Nivel 2 Nivel 3Número 62 62 62Concentración objetivo 15 42 72Valor medio15,1 41,0 72,2por <strong>Piccolo</strong> (mg/dL)DE 0,35 1,0 1,3% CV 2,3 % 2,5 % 1,8 %Intervalo observado 14 – 16 37 – 43 68 – 7513. Bibliografía1. Howe PE. The use of sodium sulfate as the globulin precipitant in the <strong>de</strong>termination of proteins in blood. J Biol Chem1921; 49:93-07.2. Howe PE. The <strong>de</strong>termination of proteins in blood - a micro method. J Biol Chem 1921; 49:109-13.3. Wolfson WQ, et al. A rapid procedure for the estimation of total protein, true albumin, total globulin, alphaglobulin, beta globulin, and gamma globulin in 10 mL of serum. Am J Clin Pathol 1948; 18:723-30.4. Saifer A, Gerstenfeld S, Vacsler F. Photometric micro<strong>de</strong>termination of total serum globulins by means of a tryptophanreaction. Clin Chem 1961; 7:626-36.5. Saifer A, Marven T. The photometric micro<strong>de</strong>termination of serum total globulins with a tryptophan reaction: a modifiedprocedure. Clin Chem 1966; 12:414-17.6. Gendler S. Albumin. In: Clinical Chemistry: Theory, Analysis, and Correlation, 2 nd Ed. Kaplan LA, Pesce AJ, eds. StLouis: The C.V. Mosby Company. 1989: 1029-33.7. Webster D, et al. An assessment of the suitability of bromocresol green for the <strong>de</strong>termination of serum albumin. Clin Chim1974; 53:101-8.8. Lou<strong>de</strong>rback A, et al. A new dye-binding technic using bromcresol purple for <strong>de</strong>termination of albumin in serum. ClinChim 1978; 14:793-4. Abstract.9. Pinnell AE, BE Northam. New automated dye-binding method for serum albumin <strong>de</strong>termination with bromcresol purple.Clin Chem 1978; 24:80-86.10. Cali JP, et al. A reference method for the <strong>de</strong>termination of total calcium in serum. In: Selected Methods of ClinicalChemistry, GR Cooper, ed. Washington, DC: AACC Press. 1977; Vol 8:3-8.11. Kessler G, Wolfman M. An automated procedure for the simultaneous <strong>de</strong>termination of calcium and phosphorus. ClinChem 1964; 10:686-703.12. Michaylova V, et al. Photometric <strong>de</strong>termination of micro amounts of calcium with arsenazo III. Anal Chim Acta 1971;53:194-8.13. Scarpa A, et al. Metallochromic indicators of ionized calcium. Ann NY Acad Sci 1978; 307:86-112.Page 74 of 95
13. Bibliografía (continuación)14. Ono T, et al. A new enzymatic assay of chlori<strong>de</strong> in serum. Clin Chem 1988; 34:552-3.15. Knoll VE, Stamm D. Spezifische kreatininbestimmung im serum. Z Klin Chem Klin Biochem 1970; 8:582-7.16. Haeckel R. Simplified <strong>de</strong>terminations of the “true” creatinine concentration in serum and urine. J Clin Chem Clin Biochem1980; 18:385-394.17. Moss GA, Bondar RJL, Buzzelli DM. Kinetic enzymatic method for <strong>de</strong>termining serum creatinine. Clin Chem 1975;21:1422-6.18. Jaynes PK, Feld RD, Johnson GF. An enzymic, reaction-rate assay for serum creatinine with a centrifugal analyzer.Clin Chem 1982; 28:114-117.19. Fossati P, Prencipe L, Berti G. Enzymatic creatinine assay: a new colorimetric method based on hydrogen peroxi<strong>de</strong>measurement. Clin Chem 1983; 29:1494-6.20. Tabata M, et al. Direct Spectrophotometry of magnesium in serum after reaction with hexokinase and glucose-6-phophate<strong>de</strong>hydrogenase. Clin Chem 1985; 31: 703-5.21. Newman DJ, Price DP. Renal function and nitrogen metabolites. In: Tietz Textbook of Clinical Chemistry, 3 rd ed. BurtisCA, Ashwood ER, eds. Phila<strong>de</strong>lphia: WB Saun<strong>de</strong>rs Company. 1999: 1204-70.22. Folin O, Wu H. A system of blood analysis. J Biol Chem 1919; 38:81-110.23. Somogyi M. A reagent for the copper-iodometric <strong>de</strong>termination of very small amounts of sugar. J Biol Chem 1937;117:771-6.24. Nelson N. A photometric adaptation of the Somogyi method for the <strong>de</strong>termination of glucose. J Biol Chem 1944; 153:375-380.25. Kaplan LA. Glucose. In: Clinical Chemistry: Theory, Analysis, and Correlation, 2 nd ed. Kaplan LA, Pesce AJ, eds. StLouis: The C.V. Mosby Company. 1989: 850-6.26. Schultz DW, Passonneau JV, Lowry OH. An enzymic method for the measurement of inorganic phosphate <strong>de</strong>termination.Anal BioChem 1967; 19:300-14.27. Tedokon M, et al. Enzymatic assay of inorganic phosphate with use of sucrose phosphorylase and phosphoglucomutase.Clin Chem 1992; 38:512-5.28. Berry MN, et al. Enzymatic <strong>de</strong>termination of potassium in serum. Clin Chem. 1989; 35:817-820.29. Van Pelt J. Enzymatic <strong>de</strong>termination of sodium, potassium and chlori<strong>de</strong> in serum compared with <strong>de</strong>termination by flamephotometry, coulometry and ion selective electro<strong>de</strong>s. Clin Chem. 1994; 40:846-7.30. Hubl W, et al.. Enzymatic <strong>de</strong>termination of sodium, potassium and chlori<strong>de</strong> in abnormal (hemolyzed, icteric, lipemic,paraproteinemic, or uremic) serum samples compared with indirect <strong>de</strong>termination with ion selective electro<strong>de</strong>s. Clin Chem1994; 40:1528-1531.31. Helgerson RC, et al. Host-guest complexation. 50. Potassium and sodium ion-selective chromogenic ionophores. J AmerChem Soc 1989; 111:6339-50.32. Kumar A, et al. Chromogenic ionophere-based methods for spectrophotometric assay of sodium and potassium in serumand plasma. Clin Chem 1988; 34:1709-12.33. Berry MN, et al. Enzymatic <strong>de</strong>termination of sodium in serum. Clin Chem 1988; 34:2295-8.34. Skeggs LT Jr. An automatic method for the <strong>de</strong>termination of carbon dioxi<strong>de</strong> in blood plasma. Am J Clin Pathol 1960;33:181-185.35. Korzun WJ, Miller WG. Carbon dioxi<strong>de</strong>. In: Clinical Chemistry: Theory, Analysis, and Correlation, 2 nd ed. Kaplan LA,Pesce AJ, eds. St Louis: The C.V. Mosby Company. 1989: 869-872.36. Fales FW. Urea in serum, direct diacetyl monoxime method. In: Selected Methods of Clinical Chemistry, Vol 9. FaulknerWR and Meites S, eds. Washington, DC: AACC Press. 1982: 365-373.37. Van Slyke, et al. A permanent preparation of urease, and its use in the <strong>de</strong>termination of urea. J Biol Chem 1914; 19:211-228.38. Fawcett JK, et al. A rapid and precise method for the <strong>de</strong>termination of urea. J Clin Pathol 1960; 13:156-9.39. Chaney, et al. Urea and ammonia <strong>de</strong>terminations. Clin Chem 1962; 8:130-2.40. Talke H, et al. Enzymatische harnstoffbestimmung in blut and serum im optischen test nach Warburg. Klin Wochensch1965; 43:174-5.41. Hallett, et al. Reduced nicotinami<strong>de</strong> a<strong>de</strong>nine dinucleoti<strong>de</strong>-coupled reaction for emergency blood urea estimation. ClinChim Acta 1971; 35:33-7.42. Patton, et al. Spectrophotometric and kinetics investigation of the Berthelot reaction for the <strong>de</strong>termination of ammonia.Anal Chem 1977; 49:464-469.43. Sampson EJ, et al. A coupled-enzyme equilibrium method for the measuring urea in serum: optimization and evaluation ofthe AACC study group on urea candidate reference method. Clin Chem 1980; 26:816-826.44. Clinical and Laboratory Standards Institute (CLSI (formerly NCCLS)). Physician’s office laboratory gui<strong>de</strong>lines; tentativegui<strong>de</strong>line – 2 nd ed. NCCLS Document POL1-T2. Wayne, PA: NCCLS, 1992.45. Scott, M.G. Electrolytes and blood gases. In: Tietz Textbook of Clinical Chemistry, 3 rd ed. Burtis CA, Ashwood ER, eds.Phila<strong>de</strong>lphia: WB Saun<strong>de</strong>rs Company. 1999: 1058-9.Page 75 of 95
13. Bibliografía (continuación)46. Clinical and Laboratory Standards Institute (CLSI (formerly NCCLS)). Procedures for the handling and processing ofblood specimens; tentative standard. NCCLS Document H18-T. Wayne, PA: NCCLS, 1983.47. Overfield CV, et al. Glycosis: a re-evaluation of the effect on blood glucose. Clin Chim Acta 1972; 39:35-40.48. Rehak NN, Chiang BT. Storage of whole blood: effect of temperature on the measured concentration of analytes in serum.Clin Chem 1988; 34-2111-4.49. Scott, M.G. Electrolytes and blood gases. In: Tietz Textbook of Clinical Chemistry, 3 rd ed. Burtis CA, Ashwood ER, eds.Phila<strong>de</strong>lphia: WB Saun<strong>de</strong>rs Company. 1999: 1065-6.50. Clinical and Laboratory Standards Institute (CLSI (formerly NCCLS)). Interference testing in clinical chemistry; proposedgui<strong>de</strong>line. NCCLS Document EP7-P. Wayne, PA: NCCLS, 1986.51. Young DS. Effects of drugs on clinical laboratory tests, 3 rd ed. Washington, DC:AACC Press. 1990.52. Clinical and Laboratory Standards Institute (CLSI (formerly NCCLS)). How to <strong>de</strong>fine and <strong>de</strong>termine reference intervals inthe clinical laboratory; approved gui<strong>de</strong>line – 2 nd ed. NCCLS Document C28-A2. Wayne, PA: NCCLS, 2000.53. Lum G, Gambino S. Serum vs plasma <strong>de</strong>terminations in routine chemistry. Clin Chem 1972; 18(7);Abstr 134;710.54. Lum G, Gambino S. A comparison of serum vs hepirinized plasma for routine chemistry tests. Am J Clin Pathol 1974:61(1);108-13.55. Carothers J, Kurtz N, Lehmann J, Jr. Error introduced by specimen handling before <strong>de</strong>termination of inorganic phosphateconcentrations in plasma and serum. Clin Chem 1976: 22(11);1909-12.56. La<strong>de</strong>nson J, et al. Serum vs heparinized plasma for routine chemistry tests. Am J Clin Path 1974: 62(4);545-52.57. Clinical and Laboratory Standards Institute (CLSI (formerly NCCLS)). Evaluation of precision performance of clinicalchemistry <strong>de</strong>vices; approved gui<strong>de</strong>line. NCCLS Document EP5-A. Wayne, PA: NCCLS, 1999.58. Clinical and Laboratory Standards Institute (CLSI, formerly NCCLS). Quality management for unit-use testing; proposedgui<strong>de</strong>line. NCCLS Document EP18-P. Wayne, PA: NCCLS, 1999.59. Clinical and Laboratory Standards Institute. (CLSI (formerly NCCLS)). Method comparison and bias estimation usingpatient samples; approved gui<strong>de</strong>line. NCCLS Document EP9-A. Wayne, PA: NCCLS, 1995Page 76 of 95