

INFORME DE GESTIÓN Y RESULTADOS FBU SEGUNDO SEMESTRE 2018 F

You also want an ePaper? Increase the reach of your titles
YUMPU automatically turns print PDFs into web optimized ePapers that Google loves.
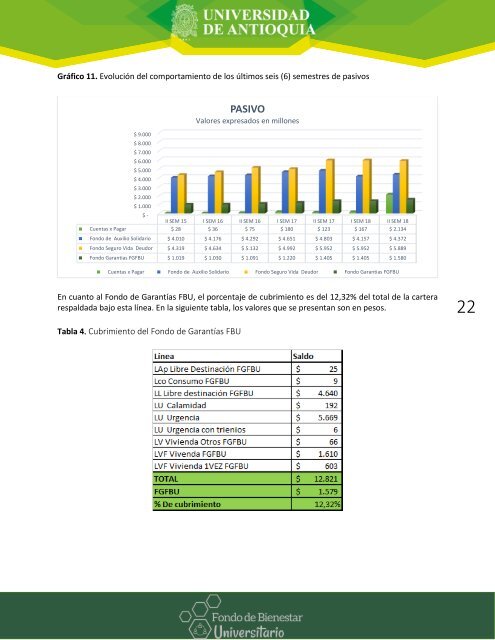
Gráfico 11. Evolución del comportamiento de los últimos seis (6) semestres de pasivos<br />
$ 9.000<br />
$ 8.000<br />
$ 7.000<br />
$ 6.000<br />
$ 5.000<br />
$ 4.000<br />
$ 3.000<br />
$ 2.000<br />
$ 1.000<br />
PASIVO<br />
Valores expresados en millones<br />
$ -<br />
II SEM 15 I SEM 16 II SEM 16 I SEM 17 II SEM 17 I SEM 18 II SEM 18<br />
Cuentas x Pagar $ 28 $ 36 $ 75 $ 180 $ 123 $ 167 $ 2.134<br />
Fondo de Auxilio Solidario $ 4.010 $ 4.176 $ 4.292 $ 4.651 $ 4.803 $ 4.157 $ 4.372<br />
Fondo Seguro Vida Deudor $ 4.319 $ 4.634 $ 5.132 $ 4.992 $ 5.952 $ 5.952 $ 5.889<br />
Fondo Garantias FG<strong>FBU</strong> $ 1.019 $ 1.030 $ 1.091 $ 1.220 $ 1.405 $ 1.405 $ 1.580<br />
Cuentas x Pagar Fondo de Auxilio Solidario Fondo Seguro Vida Deudor Fondo Garantias FG<strong>FBU</strong><br />
En cuanto al Fondo de Garantías <strong>FBU</strong>, el porcentaje de cubrimiento es del 12,32% del total de la cartera<br />
respaldada bajo esta línea. En la siguiente tabla, los valores que se presentan son en pesos.<br />
Tabla 4. Cubrimiento del Fondo de Garantías <strong>FBU</strong><br />
22