Rapport d'activité 2007 - pdf - Anru
Rapport d'activité 2007 - pdf - Anru
Rapport d'activité 2007 - pdf - Anru

Create successful ePaper yourself
Turn your PDF publications into a flip-book with our unique Google optimized e-Paper software.
Cadres<br />
Sup.<br />
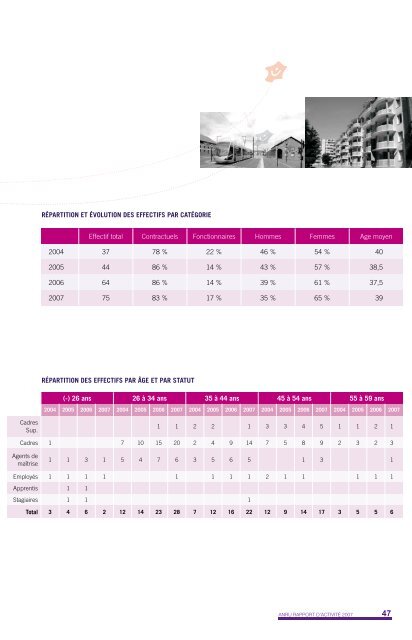
RÉPARTITION ET ÉVOLUTION DES EFFECTIFS PAR CATÉGORIE<br />
Effectif total Contractuels Fonctionnaires Hommes Femmes Age moyen<br />
2004 37 78 % 22 % 46 % 54 % 40<br />
2005 44 86 % 14 % 43 % 57 % 38,5<br />
2006 64 86 % 14 % 39 % 61 % 37,5<br />
<strong>2007</strong> 75 83 % 17 % 35 % 65 % 39<br />
RÉPARTITION DES EFFECTIFS PAR ÂGE ET PAR STATUT<br />
(-) 26 ans 26 à 34 ans 35 à 44 ans 45 à 54 ans 55 à 59 ans<br />
2004 2005 2006 <strong>2007</strong> 2004 2005 2006 <strong>2007</strong> 2004 2005 2006 <strong>2007</strong> 2004 2005 2006 <strong>2007</strong> 2004 2005 2006 <strong>2007</strong><br />
1 1 2 2 1 3 3 4 5 1 1 2 1<br />
Cadres 1 7 10 15 20 2 4 9 14 7 5 8 9 2 3 2 3<br />
Agents de<br />
maîtrise<br />
1 1 3 1 5 4 7 6 3 5 6 5 1 3 1<br />
Employés 1 1 1 1 1 1 1 1 2 1 1 1 1 1<br />
Apprentis 1 1<br />
Stagiaires 1 1 1<br />
Total 3 4 6 2 12 14 23 28 7 12 16 22 12 9 14 17 3 5 5 6<br />
ANRU RAPPORT D’ACTIVITÉ <strong>2007</strong><br />
47