illustration - laboratoire PROTEE
illustration - laboratoire PROTEE
illustration - laboratoire PROTEE

You also want an ePaper? Increase the reach of your titles
YUMPU automatically turns print PDFs into web optimized ePapers that Google loves.
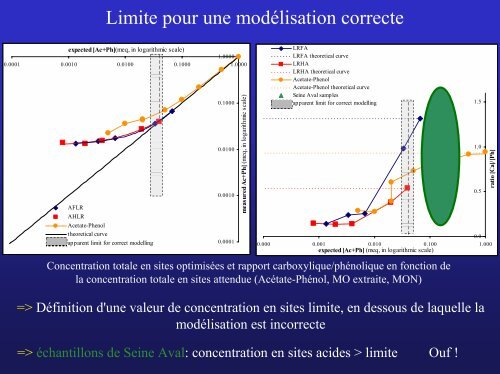
Limite pour une modélisation correcte<br />
expected [Ac+Ph](meq, in logarithmic scale)<br />
0.0001 0.0010 0.0100 0.1000<br />
1.0000<br />
1.0000<br />
AFLR<br />
AHLR<br />
Acetate-Phenol<br />
theoretical curve<br />
apparent limit for correct modelling<br />
0.1000<br />
0.0100<br />
0.0010<br />
0.0001<br />
measured Ac+Ph] (meq, in logarithmic scale)<br />
LRFA<br />
LRFA theoretical curve<br />
LRHA<br />
LRHA theoretical curve<br />
Acetate-Phenol<br />
Acetate-Phenol theoretical curve<br />
Seine Aval samples<br />
apparent limit for correct modelling<br />
0.000 0.001 0.010 0.100<br />
expected [Ac+Ph] (meq, in logarithmic scale)<br />
0.0<br />
1.000<br />
Concentration totale en sites optimisées et rapport carboxylique/phénolique en fonction de<br />
la concentration totale en sites attendue (Acétate-Phénol, MO extraite, MON)<br />
=> Définition d'une valeur de concentration en sites limite, en dessous de laquelle la<br />
modélisation est incorrecte<br />
=> échantillons de Seine Aval: concentration en sites acides > limite Ouf !<br />
1.5<br />
1.0<br />
0.5<br />
ratio [Ca]/[Ph]