FR - Eurosfaire
FR - Eurosfaire
FR - Eurosfaire
You also want an ePaper? Increase the reach of your titles
YUMPU automatically turns print PDFs into web optimized ePapers that Google loves.
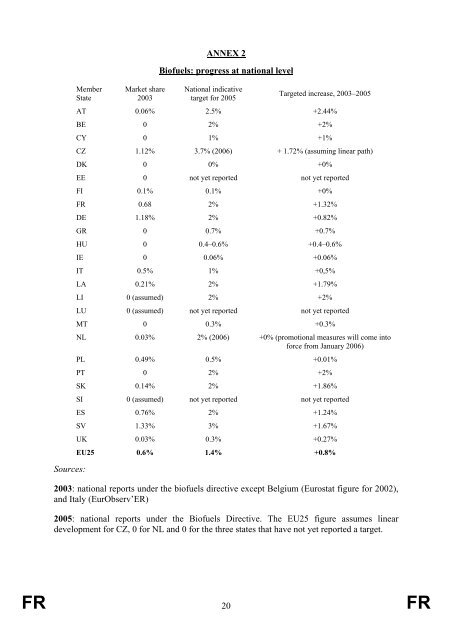
Sources:<br />
Member<br />
State<br />
Market share<br />
2003<br />
ANNEX 2<br />
Biofuels: progress at national level<br />
National indicative<br />
target for 2005<br />
Targeted increase, 2003–2005<br />
AT 0.06% 2.5% +2.44%<br />
BE 0 2% +2%<br />
CY 0 1% +1%<br />
CZ 1.12% 3.7% (2006) + 1.72% (assuming linear path)<br />
DK 0 0% +0%<br />
EE 0 not yet reported not yet reported<br />
FI 0.1% 0.1% +0%<br />
<strong>FR</strong> 0.68 2% +1.32%<br />
DE 1.18% 2% +0.82%<br />
GR 0 0.7% +0.7%<br />
HU 0 0.4–0.6% +0.4–0.6%<br />
IE 0 0.06% +0.06%<br />
IT 0.5% 1% +0,5%<br />
LA 0.21% 2% +1.79%<br />
LI 0 (assumed) 2% +2%<br />
LU 0 (assumed) not yet reported not yet reported<br />
MT 0 0.3% +0.3%<br />
NL 0.03% 2% (2006) +0% (promotional measures will come into<br />
force from January 2006)<br />
PL 0.49% 0.5% +0.01%<br />
PT 0 2% +2%<br />
SK 0.14% 2% +1.86%<br />
SI 0 (assumed) not yet reported not yet reported<br />
ES 0.76% 2% +1.24%<br />
SV 1.33% 3% +1.67%<br />
UK 0.03% 0.3% +0.27%<br />
EU25 0.6% 1.4% +0.8%<br />
2003: national reports under the biofuels directive except Belgium (Eurostat figure for 2002),<br />
and Italy (EurObserv’ER)<br />
2005: national reports under the Biofuels Directive. The EU25 figure assumes linear<br />
development for CZ, 0 for NL and 0 for the three states that have not yet reported a target.<br />
<strong>FR</strong> 20 <strong>FR</strong>


