Télécharger l'analyse financière de FINACORP relative à l ... - Tustex
Télécharger l'analyse financière de FINACORP relative à l ... - Tustex
Télécharger l'analyse financière de FINACORP relative à l ... - Tustex

You also want an ePaper? Increase the reach of your titles
YUMPU automatically turns print PDFs into web optimized ePapers that Google loves.
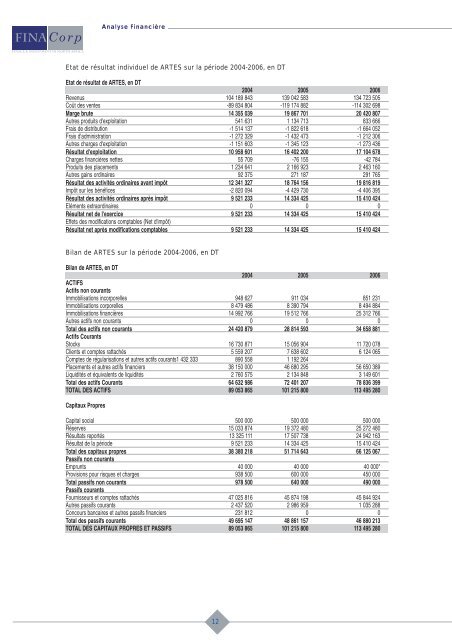
Analyse Financière<br />
Etat <strong>de</strong> résultat individuel <strong>de</strong> ARTES sur la pério<strong>de</strong> 2004-2006, en DT<br />
Etat <strong>de</strong> résultat <strong>de</strong> ARTES, en DT<br />
2004 2005 2006<br />
Revenus 104 189 843 139 042 583 134 723 505<br />
Coût <strong>de</strong>s ventes -89 834 804 -119 174 882 -114 302 698<br />
Marge brute 14 355 039 19 867 701 20 420 807<br />
Autres produits d'exploitation 541 631 1 134 713 833 666<br />
Frais <strong>de</strong> distribution -1 514 137 -1 822 618 -1 664 052<br />
Frais d'administration -1 272 329 -1 432 473 -1 212 306<br />
Autres charges d'exploitation -1 151 603 -1 345 123 -1 273 436<br />
Résultat d'exploitation 10 958 601 16 402 200 17 104 678<br />
Charges financières nettes 55 709 -76 155 -42 784<br />
Produits <strong>de</strong>s placements 1 234 641 2 166 923 2 463 160<br />
Autres gains ordinaires 92 375 271 187 291 765<br />
Résultat <strong>de</strong>s activités ordinaires avant impôt 12 341 327 18 764 156 19 816 819<br />
Impôt sur les bénéfices -2 820 094 -4 429 730 -4 406 395<br />
Résultat <strong>de</strong>s activités ordinaires après impôt 9 521 233 14 334 425 15 410 424<br />
Eléments extraordinaires 0 0 0<br />
Résultat net <strong>de</strong> l'exercice 9 521 233 14 334 425 15 410 424<br />
Effets <strong>de</strong>s modifications comptables (Net d'impôt)<br />
Résultat net après modifications comptables 9 521 233 14 334 425 15 410 424<br />
Bilan <strong>de</strong> ARTES sur la pério<strong>de</strong> 2004-2006, en DT<br />
Bilan <strong>de</strong> ARTES, en DT<br />
2004 2005 2006<br />
ACTIFS<br />
Actifs non courants<br />
Immobilisations incorporelles 948 627 911 034 851 231<br />
Immobilisations corporelles 8 479 486 8 390 794 8 494 884<br />
Immobilisations financières 14 992 766 19 512 766 25 312 766<br />
Autres actifs non courants 0 0 0<br />
Total <strong>de</strong>s actifs non courants 24 420 879 28 814 593 34 658 881<br />
Actifs Courants<br />
Stocks 16 730 871 15 056 904 11 720 078<br />
Clients et comptes rattachés 5 559 207 7 638 602 6 124 065<br />
Comptes <strong>de</strong> régularisations et autres actifs courants1 432 333 890 558 1 192 264<br />
Placements et autres actifs financiers 38 150 000 46 680 295 56 650 389<br />
Liquidités et équivalents <strong>de</strong> liquidités 2 760 575 2 134 848 3 149 601<br />
Total <strong>de</strong>s actifs Courants 64 632 986 72 401 207 78 836 399<br />
TOTAL DES ACTIFS 89 053 865 101 215 800 113 495 280<br />
Capitaux Propres<br />
Capital social 500 000 500 000 500 000<br />
Réserves 15 033 874 19 372 480 25 272 480<br />
Résultats reportés 13 325 111 17 507 738 24 942 163<br />
Résultat <strong>de</strong> la pério<strong>de</strong> 9 521 233 14 334 425 15 410 424<br />
Total <strong>de</strong>s capitaux propres 38 380 218 51 714 643 66 125 067<br />
Passifs non courants<br />
Emprunts 40 000 40 000 40 000*<br />
Provisions pour risques et charges 938 500 600 000 450 000<br />
Total passifs non courants 978 500 640 000 490 000<br />
Passifs courants<br />
Fournisseurs et comptes rattachés 47 025 816 45 874 198 45 844 924<br />
Autres passifs courants 2 437 520 2 986 959 1 035 288<br />
Concours bancaires et autres passifs financiers 231 812 0 0<br />
Total <strong>de</strong>s passifs courants 49 695 147 48 861 157 46 880 213<br />
TOTAL DES CAPITAUX PROPRES ET PASSIFS 89 053 865 101 215 800 113 495 280<br />
12