

Edisi Maret 2009 - Badan Pusat Statistik
Edisi Maret 2009 - Badan Pusat Statistik
Edisi Maret 2009 - Badan Pusat Statistik

Create successful ePaper yourself
Turn your PDF publications into a flip-book with our unique Google optimized e-Paper software.
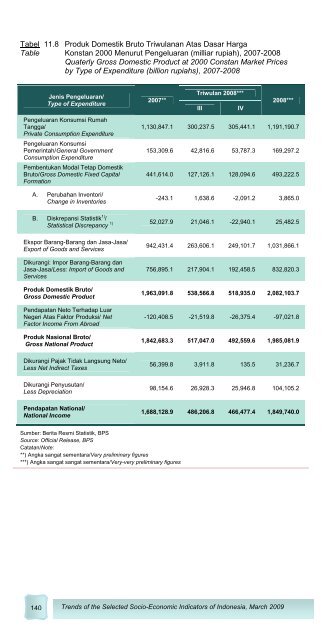
Tabel 11.8 Produk Domestik Bruto Triwulanan Atas Dasar Harga<br />
Table Konstan 2000 Menurut Pengeluaran (milliar rupiah), 2007-2008<br />
Quaterly Gross Domestic Product at 2000 Constan Market Prices<br />
by Type of Expenditure (billion rupiahs), 2007-2008<br />
Jenis Pengeluaran/<br />
Type of Expenditure<br />
Pengeluaran Konsumsi Rumah<br />
Tangga/<br />
Private Consumption Expenditure<br />
Pengeluaran Konsumsi<br />
Pemerintah/General Government<br />
Consumption Expenditure<br />
Pembentukan Modal Tetap Domestik<br />
Bruto/Gross Domestic Fixed Capital<br />
Formation<br />
A. Perubahan Inventori/<br />
Change in Inventories<br />
Triwulan 2008***<br />
2007**<br />
2008***<br />
III<br />
IV<br />
1,130,847.1 300,237.5 305,441.1 1,191,190.7<br />
153,309.6 42,816.6 53,787.3 169,297.2<br />
441,614.0 127,126.1 128,094.6 493,222.5<br />
-243.1 1,638.6 -2,091.2 3,865.0<br />
B. Diskrepansi <strong>Statistik</strong> 1) /<br />
1) 52,027.9 21,046.1 -22,940.1 25,482.5<br />
Statistical Discrepancy<br />
Ekspor Barang-Barang dan Jasa-Jasa/<br />
Export of Goods and Services<br />
Dikurangi: Impor Barang-Barang dan<br />
Jasa-Jasa/Less: Import of Goods and<br />
Services<br />
Produk Domestik Bruto/<br />
Gross Domestic Product<br />
Pendapatan Neto Terhadap Luar<br />
Negeri Atas Faktor Produksi/ Net<br />
Factor Income From Abroad<br />
Produk Nasional Broto/<br />
Gross National Product<br />
942,431.4 263,606.1 249,101.7 1,031,866.1<br />
756,895.1 217,904.1 192,458.5 832,820.3<br />
1,963,091.8 538,566.8 518,935.0 2,082,103.7<br />
-120,408.5 -21,519.8 -26,375.4 -97,021.8<br />
1,842,683.3 517,047.0 492,559.6 1,985,081.9<br />
Dikurangi Pajak Tidak Langsung Neto/<br />
Less Net Indirect Taxes<br />
56,399.8 3,911.8 135.5 31,236.7<br />
Dikurangi Penyusutan/<br />
Less Depreciation<br />
98,154.6 26,928.3 25,946.8 104,105.2<br />
Pendapatan National/<br />
National Income<br />
1,688,128.9 486,206.8 466,477.4 1,849,740.0<br />
Sumber: Berita Resmi <strong>Statistik</strong>, BPS<br />
Source: Official Release, BPS<br />
Catatan/Note:<br />
**) Angka sangat sementara/Very preliminary figures<br />
***) Angka sangat sangat sementara/Very-very preliminary figures<br />
140 Trends of the Selected Socio-Economic Indicators of Indonesia, March <strong>2009</strong>


