

Edisi Maret 2009 - Badan Pusat Statistik
Edisi Maret 2009 - Badan Pusat Statistik
Edisi Maret 2009 - Badan Pusat Statistik

You also want an ePaper? Increase the reach of your titles
YUMPU automatically turns print PDFs into web optimized ePapers that Google loves.
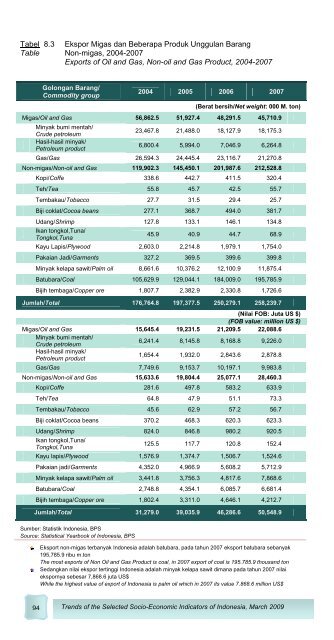
Tabel 8.3 Ekspor Migas dan Beberapa Produk Unggulan Barang<br />
Table Non-migas, 2004-2007<br />
Exports of Oil and Gas, Non-oil and Gas Product, 2004-2007<br />
Golongan Barang/<br />
Commodity group<br />
2004 2005 2006 2007<br />
(Berat bersih/Net weight: 000 M. ton)<br />
Migas/Oil and Gas 56,862.5 51,927.4 48,291.5 45,710.9<br />
Minyak bumi mentah/<br />
Crude petroleum<br />
23,467.8 21,488.0 18,127.9 18,175.3<br />
Hasil-hasil minyak/<br />
Petroleum product<br />
6,800.4 5,994.0 7,046.9 6,264.8<br />
Gas/Gas 26,594.3 24,445.4 23,116.7 21,270.8<br />
Non-migas/Non-oil and Gas 119,902.3 145,450.1 201,987.6 212,528.8<br />
Kopi/Coffe 338.6 442.7 411.5 320.4<br />
Teh/Tea 55.8 45.7 42.5 55.7<br />
Tembakau/Tobacco 27.7 31.5 29.4 25.7<br />
Biji coklat/Cocoa beans 277.1 368.7 494.0 381.7<br />
Udang/Shrimp 127.8 133.1 146.1 134.8<br />
Ikan tongkol,Tuna/<br />
Tongkol,Tuna<br />
45.9 40.9 44.7 68.9<br />
Kayu Lapis/Plywood 2,603.0 2,214.8 1,979.1 1,754.0<br />
Pakaian Jadi/Garments 327.2 369.5 399.6 399.8<br />
Minyak kelapa sawit/Palm oil 8,661.6 10,376.2 12,100.9 11,875.4<br />
Batubara/Coal 105,629.9 129,044.1 184,009.0 195,785.9<br />
Bijih tembaga/Copper ore 1,807.7 2,382.9 2,330.8 1,726.6<br />
Jumlah/Total 176,764.8 197,377.5 250,279.1 258,239.7<br />
(Nilai FOB: Juta US $)<br />
(FOB value: million US $)<br />
Migas/Oil and Gas 15,645.4 19,231.5 21,209.5 22,088.6<br />
Minyak bumi mentah/<br />
Crude petroleum<br />
6,241.4 8,145.8 8,168.8 9,226.0<br />
Hasil-hasil minyak/<br />
Petroleum product<br />
1,654.4 1,932.0 2,843.6 2,878.8<br />
Gas/Gas 7,749.6 9,153.7 10,197.1 9,983.8<br />
Non-migas/Non-oil and Gas 15,633.6 19,804.4 25,077.1 28,460.3<br />
Kopi/Coffe 281.6 497.8 583.2 633.9<br />
Teh/Tea 64.8 47.9 51.1 73.3<br />
Tembakau/Tobacco 45.6 62.9 57.2 56.7<br />
Biji coklat/Cocoa beans 370.2 468.3 620.3 623.3<br />
Udang/Shrimp 824.0 846.8 980.2 920.5<br />
Ikan tongkol,Tuna/<br />
Tongkol,Tuna<br />
125.5 117.7 120.8 152.4<br />
Kayu lapis/Plywood 1,576.9 1,374.7 1,506.7 1,524.6<br />
Pakaian jadi/Garments 4,352.0 4,966.9 5,608.2 5,712.9<br />
Minyak kelapa sawit/Palm oil 3,441.8 3,756.3 4,817.6 7,868.6<br />
Batubara/Coal 2,748.8 4,354.1 6,085.7 6,681.4<br />
Bijih tembaga/Copper ore 1,802.4 3,311.0 4,646.1 4,212.7<br />
Jumlah/Total 31,279.0 39,035.9 46,286.6 50,548.9<br />
Sumber: <strong>Statistik</strong> Indonesia, BPS<br />
Source: Statistical Yearbook of Indonesia, BPS<br />
Eksport non-migas terbanyak Indonesia adalah batubara, pada tahun 2007 eksport batubara sebanyak<br />
195,785.9 ribu m.ton<br />
The most exports of Non Oil and Gas Product is coal, in 2007 export of coal is 195.785.9 thousand ton<br />
Sedangkan nilai ekspor tertinggi Indonesia adalah minyak kelapa sawit dimana pada tahun 2007 nilai<br />
ekspornya sebesar 7,868.6 juta US$<br />
While the highest value of export of Indonesia is palm oil which in 2007 its value 7.868.6 million US$<br />
94 Trends of the Selected Socio-Economic Indicators of Indonesia, March <strong>2009</strong>


