Population by caste/ethnic groups and sex for Nepal 2001
Population by caste/ethnic groups and sex for Nepal 2001
Population by caste/ethnic groups and sex for Nepal 2001

You also want an ePaper? Increase the reach of your titles
YUMPU automatically turns print PDFs into web optimized ePapers that Google loves.
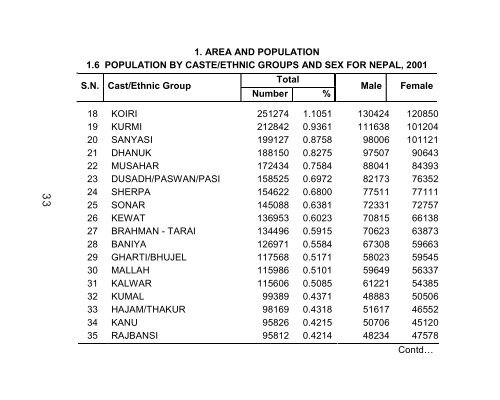
331. AREA AND POPULATION1.6 POPULATION BY CASTE/ETHNIC GROUPS AND SEX FOR NEPAL, <strong>2001</strong>S.N. Cast/Ethnic GroupTotalNumber %MaleFemale18NEPALKOIRI22736934251274100 11359378 113775561.1051 130424 12085019 KURMI 212842 0.9361 111638 10120420 SANYASI 199127 0.8758 98006 10112121 DHANUK 188150 0.8275 97507 9064322 MUSAHAR 172434 0.7584 88041 8439323 DUSADH/PASWAN/PASI 158525 0.6972 82173 7635224 SHERPA 154622 0.6800 77511 7711125 SONAR 145088 0.6381 72331 7275726 KEWAT 136953 0.6023 70815 6613827 BRAHMAN - TARAI 134496 0.5915 70623 6387328 BANIYA 126971 0.5584 67308 5966329 GHARTI/BHUJEL 117568 0.5171 58023 5954530 MALLAH 115986 0.5101 59649 5633731 KALWAR 115606 0.5085 61221 5438532 KUMAL 99389 0.4371 48883 5050633 HAJAM/THAKUR 98169 0.4318 51617 4655234 KANU 95826 0.4215 50706 4512035 RAJBANSI 95812 0.4214 48234 47578Contd…