

Small Area Estimation of Poverty
Small Area Estimation of Poverty
Small Area Estimation of Poverty
- No tags were found...

Create successful ePaper yourself
Turn your PDF publications into a flip-book with our unique Google optimized e-Paper software.
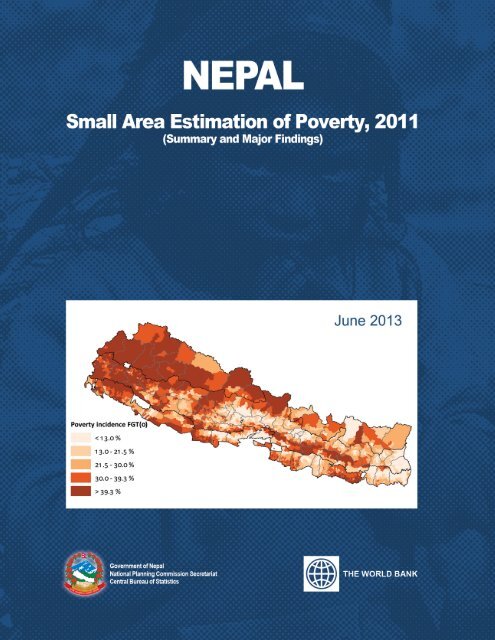
NEPAL<strong>Small</strong> <strong>Area</strong> <strong>Estimation</strong> <strong>of</strong> <strong>Poverty</strong>, 2011(Summary and Major Findings)WB DECCT 201 3-06<strong>Poverty</strong> incidence FGT(0)< 13.0 %13.0 - 21.5 %21 .5 - 30.0 %30.0 - 39.3 %> 39.3 %June 2013Government <strong>of</strong> NepalNational Planning Commission SecretariatCentral Bureau <strong>of</strong> StatisticsTHE WORLD BANK
Preface and AcknowledgementsThis report is a collaborative effort <strong>of</strong> Government<strong>of</strong> Nepal-Central Bureau <strong>of</strong> Statistics (CBS), and TheWorld Bank Group. It presents the result <strong>of</strong> small areaestimation techniques to further improve and extendthe sample survey estimates <strong>of</strong> poverty. The NepalLiving Standard Survey III presented the estimates<strong>of</strong> poverty for 12 analytical domains only. However,the demand for poverty estimates for administrativeregions smaller than an analytical domain is increasingbut implementing a sample survey which providesestimates at this great detail is prohibitively expensive.In this context, an advanced and cost effective statisticaltechnique called <strong>Small</strong> <strong>Area</strong> <strong>Estimation</strong> (SAE) provedto be a boon for Nepal. This method gives estimates<strong>of</strong> poverty for smaller areas by mixing the results <strong>of</strong>latest results <strong>of</strong> living standard survey and PopulationCensus.The CBS and its development partners (The WorldBank and the World Food Program) published ilakalevel poverty maps in 2006 using the SAE techniquecombining NLSS 2003-04, NDHS 2001 and Census2001. Village Development Committee (VDC) levelpoverty estimates are highly demanded by planners,researchers and development partners. This reportpresents the poverty estimates at subilaka level(target area) using SAE technique. The report containspoverty incidence (p0 or FGT0), poverty gap (p1or FGT1) and squared poverty gap (p2 or FGT2) foreach <strong>of</strong> 75 districts, 976 Ilakas and 2344 target areasincluding all municipalities individually. Though allVDC level poverty estimates are not produced because<strong>of</strong> imprecise nature <strong>of</strong> such estimates with smallsample number <strong>of</strong> households inhabiting same VDC,confidence intervals are provided for all 3973 VDCsand municipalities.From the World Bank, the general direction wasprovided by Vinaya Swaroop, Sector Manager andTahseen Sayed, country Manager, Nepal. PeterLanjouw, Marleen Marra, Prem Sangrula and SrinivasanThirumalai (Task Team Leader) worked with a team <strong>of</strong>CBS staff.CBS staff from the Household Survey, Population, Dataprocessing & GIS and Prices sections worked togetherto produce the report under the general guidance<strong>of</strong> Bikas Bista, Deputy Director General <strong>of</strong> CBS. Thecore team <strong>of</strong> CBS staff comprised <strong>of</strong> Dilli Raj Joshi,Devendra Karanjit, Jay Kumar Sharma and GyanendraBajracharya (Directors), Dinesh Bhattarai, Lok BahadurKhatri, Bed Prasad Dhakal, Binod Saran Acharya, BikasMalla, and Tulsi Paudel (Statistics Officers).GIS help for creation <strong>of</strong> new shapes and visualizationwas ably provided by Brian Blankespoor (The WorldBank). Chris Gerrard, and Minh Cong Nguyen(The World Bank) helped immensely with Tableaucustomization for developing the online query tool. Theteam would like to thank peer reviewers Pr<strong>of</strong>essor ChrisElbers, Pr<strong>of</strong>essor Pushkar Bajracharya, T.S. Bastola andMaria Eugenia Genoni. Also, the team would like tothank the participants <strong>of</strong> the review meeting held at theNational Planning Commission and a meeting attendedby researchers and policy makers in Nepal.The full report and the online query and visualizationtool can be accessed from the website <strong>of</strong> the CBS athttp://www.cbs.gov.np. Also, the entire report and<strong>of</strong>fline query tool is available in the CD attached withthis book.Uttam Narayan MallaDirector GeneralCentral Bureau <strong>of</strong> Statisticsiii
Table <strong>of</strong> ContentsPrefaceiiiTable <strong>of</strong> ContentsivExecutive Summaryv1. Introduction 12. Methodology 22.1 <strong>Small</strong>-area estimation ELL method 22.2 A note <strong>of</strong> caution 33. Data sources and description 43.1 NLSS III and 2011 Population Census 43.2 Common and comparable variables 43.3 Definition <strong>of</strong> “target area” 5Table 1: <strong>Estimation</strong> levels and population size 64. Results 74.1 Strata-level results in comparison with NLSS III 7Table 2: Predicted poverty rates on the target level - by stratum and in comparisonto NLSS III poverty rates 74.2. District, ilaka, and target-level results 8Table 3: Summary statistics <strong>of</strong> predicted poverty rates 94.3 Maps 95. How reliable are these maps? 135.1 Tests for over-fitting 13Table 4: Over-fitting test comparing observed and predicted FGT(0)in a subsample <strong>of</strong> the NLSS III survey 135.2 Breakdown <strong>of</strong> standard errors 146. Conclusions and suggestions for follow-up work 15References 16Appendix : Tables with small area estimations <strong>of</strong> poverty at thelevel <strong>of</strong> the district, target level (Municipality) ilaka, target-level(FGT0>0.505, and VDC. 17A 1: SAE <strong>Poverty</strong> Rates at the District level; Average and Standard Error 17A 2: SAE <strong>Poverty</strong> Rates at the Target level (Municipality);Average and Standard Error 19A 3: SAE <strong>Poverty</strong> Rates at the Ilaka level; Average and Standard Error 20A 4: SAE <strong>Poverty</strong> Rates at the “Target <strong>Area</strong>” having FGT0 > 0.505; Average and Standard Error 41A5 : SAE <strong>of</strong> target areas( having number <strong>of</strong> poor > 10,000) 45FiguresFigure 1: Belts and district boundaries <strong>of</strong> Nepal 5Figure 2: <strong>Poverty</strong> incidence on district level 10Figure 3: Number <strong>of</strong> poor (FGT(0)) on district level 10Figure 4: <strong>Poverty</strong> incidence on the ilaka level 11Figure 5: Number <strong>of</strong> poor (FGT(0)) on the ilaka level 11Figure 6: <strong>Poverty</strong> incidence on target-area level 12Figure 7: Number <strong>of</strong> poor (FGT(0)) on target-area level 12Figure 8: Standard error <strong>of</strong> FGT(0) by target area size (number <strong>of</strong> households) 14iv
Executive SummaryNepal <strong>Small</strong> <strong>Area</strong> <strong>Estimation</strong> <strong>of</strong> <strong>Poverty</strong> 2011<strong>Small</strong> area estimates <strong>of</strong> poverty have become usefultool in targeting poverty reduction by geographicareas. By now, more than 60 countries have smallarea estimates <strong>of</strong> poverty (“poverty maps”). ForNepal, this is the second poverty map producedafter a gap <strong>of</strong> seven years in collaboration with theCentral Bureau <strong>of</strong> Statistics, Nepal. Visualized ongeographical map, small area estimates can conveyto audiences <strong>of</strong> all literacy levels the scale anddistribution <strong>of</strong> poverty not possible by tabular data.Further, poverty maps can be super-imposed onspatial variables such as climate or infrastructure toanalyze spatial determinants <strong>of</strong> poverty.<strong>Small</strong> area estimates improve the accuracy anddisaggregate spatially the poverty estimates madefrom survey data. The Nepal Living StandardsSurvey is representative at the level <strong>of</strong> 12 broadstrata, but district development committees inparticular value information at a lower level suchas the VDC, Municipalities – some 3970 <strong>of</strong> them.While the NLSS III includes too few observations toproduce estimates at district level or lower.The small area estimates in this report are basedmainly on most recent information from NepalLiving Standards Survey 2010-11 and Nepal Census2011. Auxiliary data sources include VDC-level GISinformation obtained from the Vulnerability Analysisand Mapping unit <strong>of</strong> World Food Program Nepal.Variables are: mean elevation in kilometers, meanslope in percentage, height range, standard deviation<strong>of</strong> height, population density in inhabitants per squarekilometer, distance to the district headquarters,length <strong>of</strong> road in kilometers (by ilaka), length <strong>of</strong>road in kilometers per thousand inhabitants (byilaka), length <strong>of</strong> rivers in kilometers. An improvedaccessibility measure called “Kosh” (measures howmany hours it takes for a normal person to walk fromthe VDC to the district headquarters) available withthe Election Commission was also used to enrich theestimates.Besides using more recent data and improvements inmethodology, the small area estimates in this reportremedy an important limitation <strong>of</strong> the poverty map<strong>of</strong> 2006 by providing estimates as close as the VDC/Municipality level. Though the previous poverty mapprovided estimates for 967 ilakas, for developmentplanning proposes, estimates at even finer geographiclevels would have been more useful. This exercise <strong>of</strong>small area estimation <strong>of</strong> poverty provides statisticallyreliable poverty measures for 2344 VDCs or groups <strong>of</strong>VDCs <strong>of</strong> Nepal. When statistical reliability is doubtfulto estimate VDC level poverty, similar VDCs have beencombined to generate reliable poverty estimates for theselect aggregate <strong>of</strong> similar VDCs inside a given ilaka.For all the VDCs, even for those precise estimates cannotbe made, confidence bands for poverty estimates areprovided..The main report presents 2010/11 small-area estimatesand maps for Nepal at the 75 district, 967 ilaka and 2344“target area” level, <strong>of</strong> poverty incidence, poverty gap,and poverty severity.The report also provides maps <strong>of</strong>the number <strong>of</strong> poor and their average consumption.However, this “Sumary and Major Findings” containsestimates <strong>of</strong> 75 districts and 976 ilakas. In addition,out <strong>of</strong> 2344 target areas, it includes the estimates <strong>of</strong> 58municipalities and VDCs having poverty incidencegreater than 50 percent.The findings confirm the spatial distribution <strong>of</strong> povertyin Nepal. <strong>Poverty</strong> - both as a rate and headcount - ishigh in the hilly areas <strong>of</strong> Far West and parts <strong>of</strong> Mid-West. The percentage <strong>of</strong> poor varies from negligible inparts <strong>of</strong> Kathmandu to 75 percent in parts <strong>of</strong> Gorkhadistrict. A comparison with the poverty map <strong>of</strong> 2006shows that though prosperity is spreading in Nepal,it has a hard time moving West and climbing Hills.<strong>Poverty</strong> concentration in the East and Central hasdeclined while it increased in the rest. Nearly halfthe small areas have poverty higher than the nationalaverage <strong>of</strong> 25.2 percent and contain two-thirds <strong>of</strong> thepoor in Nepal.v
The character <strong>of</strong> the spatial distribution <strong>of</strong> povertyin Nepal is not new but the estimates at 2344 smallareas along with their standard errors should help inbetter design <strong>of</strong> development interventions. While itis straight forward to target development activities inareas with extreme poverty, in areas where povertyis not distinctly different, randomized experimentdesigns can be used to pick appropriate interventionsthat are most effective.The poverty maps could usefully be expanded to otherindicators <strong>of</strong> welfare such as nutrition and food securitylike in 2006. Detailed spatial distribution <strong>of</strong> poverty<strong>of</strong>fers an opportunity to explore further the causes <strong>of</strong>poverty trends in Nepal. When combined with thespatial distribution <strong>of</strong> correlates <strong>of</strong> poverty such asaccess to roads, schools and health facilities, and othervariable <strong>of</strong> economic geography, one can further ourunderstanding <strong>of</strong> the persistence <strong>of</strong> pockets <strong>of</strong> povertyin Nepal.vi
1. IntroductionKnowledge <strong>of</strong> living standards at the level <strong>of</strong> towns,cities, districts, or other sub-national localities canhelp to inform decision making on a variety <strong>of</strong> issues.Notably, poverty reduction efforts can benefit frominformation on welfare outcomes at the level <strong>of</strong> the mostdisaggregated administrative jurisdictions. <strong>Poverty</strong>indicators, such as the headcount rate, estimated at thenational or urban/rural level, are unable to captureimportant differences between small areas such asdistricts, Village Development Committees (VDC)or municipalities. In the case <strong>of</strong> Nepal, the nationallyrepresentative Nepal Living Standards Survey isrepresentative at the level <strong>of</strong> 14 broad strata, butdistrict development committees in particular valueinformation at a lower level such as the VDC. Whilethe NLSS III includes too few observations to produceestimates at district level or lower, there does exist aPopulation Census for Nepal, covering the entireNepali population. Unfortunately, the Census does notcollect the detailed expenditure information neededto estimate reliable and readily interpretable povertymeasures.<strong>Small</strong>-area estimation is a statistical technique thatimproves accuracy <strong>of</strong> direct survey estimates <strong>of</strong> welfarefor small areas by combining survey data with othersources such as the population census (see for instanceGhosh and Rao, 1994, Rao, 2003). This method has beenadapted to the generation <strong>of</strong> small-area estimations <strong>of</strong>poverty by Elbers, Lanjouw and Lanjouw (2002, 2003, -henceforth ELL). The ELL method combines householdsurvey data and census data at the unit record level,making it possible to estimate reliable poverty indicatorsat local level. To date this method has been applied inmore than 60 countries with as objective informingpolicy-makers <strong>of</strong> the spatial pattern <strong>of</strong> poverty andother welfare indicators in their respective countries(see Bedietal., 2007 for a review <strong>of</strong> applications). In2006, Nepal’s Central Bureau <strong>of</strong> Statistics, The WorldFood Program, and The World Bank, worked togetherto produce a poverty map for Nepal using the 2003/04NLSS, the 2001 Nepal Demographic and Health Surveyand the 2001 Population Census (CBS et al, 2006). Thepresent report updates the 2006 results for Nepalin three ways. First, it uses the recently published2010/11 round <strong>of</strong> the NLSS and 2011 PopulationCensus in order to produce an updated description <strong>of</strong>the spatial patterns <strong>of</strong> poverty. Second, it incorporatesnew methodological refinements aimed at improvingmodeling <strong>of</strong> the standard error (as detailed in themethodology section below). Third, in an effort toimprove practical usability <strong>of</strong> the results, estimatesare produced at the sub-ilaka or VDC level - wherepossible - instead <strong>of</strong> sticking with the ilaka level thatwas used in 2006.By combining small-area estimates with GISinformation, the resulting “poverty maps” can beused to highlight detailed geographical variationswith high resolution. Maps can be powerful tools forconvening complex messages in a visual format forboth technical and non-technical users 1 . This reportpresents 2010/11 small-area estimates and maps forNepal at the district, ilaka and “target area” level, <strong>of</strong>poverty incidence, poverty gap, and poverty severity(interchangeably referred to as FGT (0), FGT (1) andFGT (2) as per standard notation referring to Foster,Greer, and Thorbecke; 1984). The report also providesmaps <strong>of</strong> the number <strong>of</strong> poor and their averageconsumption. As the newly introduced target areasare generally smaller than conventional aggregationlevels, special attention is devoted to investigating theprecision <strong>of</strong> the point estimates and to interpretation<strong>of</strong> the results.1 “<strong>Poverty</strong> mapping” can be extended to allow for deeper understanding <strong>of</strong> correlates <strong>of</strong> poverty at the disaggregated level. For example; maps can display poverty incidencetogether with non-farm employment, or incidence <strong>of</strong> disease or school enrollment or level <strong>of</strong> education and so on. Spatial representation <strong>of</strong> school locations, infrastructure,health posts etc., can therefore complement regression analysis to help us understand the influence <strong>of</strong> these covariates and their interaction with poverty..NEPAL <strong>Small</strong> <strong>Area</strong> <strong>Estimation</strong> <strong>of</strong> <strong>Poverty</strong>, 2011, Summary and Major Findings 1
2. Methodology2.1 <strong>Small</strong>-area estimation ELL methodTo exploit the detailed expenditure information <strong>of</strong> theNLSS III household survey and the entire populationcoverage in the Census, we apply the small areaestimation method developed by Elbers, Lanjouw andLanjouw (Henceforth, ELL; 2002, 2003). The exerciseinvolves three broad steps. First, it requires selectinga set <strong>of</strong> variables that are common to the householdsurvey and the Population Census. Common variablesinclude household characteristics <strong>of</strong> education, housingquality, durables, ethnicity, etc. Besides being common,it must be established that these variables are statisticallyindistinguishable and similarly framed. Surprisingly,many common variables between the NLSS III surveyand the 2011 Population Census have been foundto have different means, which will be discussed inmore detail in section 3. In addition, GIS informationat the VDC level and household variables’ area meansare calculated from the census and merged with thesurvey. Adding area means, calculated the target levelat which poverty is to be estimated, or below, helps toexplain location effects and has been shown to improveestimates markedly (Elbers et al., 2002).Second, observed expenditure in the survey is regressedon selected common variables as follows:ln(y ch)= X chβ+u ch, (1)where ln(y ch) is log <strong>of</strong> per capita expenditure <strong>of</strong>household h in cluster c, the vector <strong>of</strong> selectedexplanatory variables, the vector <strong>of</strong> regressioncoefficients, and u_ch is the vector <strong>of</strong> disturbances. Thesubscript ch refers to household h living in cluster c,the VDC in this case. For the analysis in this report,this expenditure modeling (or, “beta model”) is donefor three regions separately: Central & Eastern regions,Western region, and Midwestern & Farwestern regions.We thus allow for variation in the relationship betweenexpenditure and the selected variables among thesethree broad areas. As the level <strong>of</strong> aggregation at thetarget level is particularly low, this course <strong>of</strong> actionhelps to reduce standard errors on poverty estimatesand thus to improve precision. In addition, estimatingthree separate models also helps to confront this abovementionedconcern with non-comparable variables,across the survey and census. This is because at theregion level, comparability across the two data sourcesis better. Estimating separate models thus providesmore space to include meaningful covariates <strong>of</strong>expenditure into (1) 2 . Consumption models includevariables that are selected on the basis <strong>of</strong> beingcommon and comparable, and being meaningful andstatistically significant at least the 5% level.<strong>Estimation</strong> <strong>of</strong> (1) by simple OLS gives estimatedresiduals û ch(that are estimates <strong>of</strong> overall residuals û ch).These residuals are broken down into two components:a cluster specific random effect and an uncorrelatedhousehold error term:û ch= η̂ + ε , (2)c chwhere η ĉis the cluster-specific random effect, calculatedby simply taking within-cluster means <strong>of</strong> the totalestimated residual, and ε chis the resulting householdspecificrandom effect. It is worth noting one critique<strong>of</strong> the ELL methodology that argues that the level <strong>of</strong>precision <strong>of</strong> the results could be overstated if the errorstructure is misspecified. In particular, if standarderrors are correlated at a level higher than the cluster,but autocorrelation is modeled at the cluster level,then calculated standard errors could be smaller thanjustified (Banerjee et al., 2006; Tarozzi and Deaton, 2009).However, the ELL method doesn’t insist on modelingautocorrelation at the cluster level, (Elbers et al., 2008),and that careful incorporation <strong>of</strong> area-level means canhelp to ensure that the location effect is small. A recentpaper using Brazilian census data to validate the ELLmethod, finds that associated standard errors can beboth realistic and sufficiently narrow to yield usableestimates. (Elbers et al, 2008). In general, the bettermodel (1) is at capturing location effects, the smallerthe potential for underestimating standard errors. Inthis paper we model the location effect at the clusterlevel which is (mostly) below the level at which thepoverty rates are estimated. However, we apply thelocation effect at the target level in our simulations 3 . Webasically assume that the observed correlation <strong>of</strong> thedeviation in predicted expenditure at the level <strong>of</strong> theVDC applies in its entirety across all households at thehigher level (target area, ilaka, or district). As argued byElbers et al (2008), this is a quite conservative approachas, in all likelihood, only a fraction <strong>of</strong> the correlation2 We also fitted one national model to the data for comparison, and find that the point estimates <strong>of</strong> poverty incidence are highly correlated (correlation <strong>of</strong> about 0.9) .However, the results <strong>of</strong> the national model are somewhat less precise.3 We say “mostly” as some VDC’s are equal to the “target level” if they are large enough.2 NEPAL <strong>Small</strong> <strong>Area</strong> <strong>Estimation</strong> <strong>of</strong> <strong>Poverty</strong>, 2011, Summary and Major Findings
etween households in the VDC applies to this higherlevel. As a result we can thus be fairly confident thatthe standard errors in this paper are not overstating theprecision <strong>of</strong> our estimates.To allow for heteroskedasticity in the household errorcomponent, a model <strong>of</strong> the variance <strong>of</strong> εε chconditional onselected variables can be applied. Such a model (“alphamodel”) is used for the Central/Eastern and Westernregions but not for the Mid/Farwestern region 4 . TablesA5-A9 in Appendix I (<strong>of</strong> the main document) presentthe three beta models and the two alpha models.Third, expenditure <strong>of</strong> a household in the Census ispredicted as follows:ln̂ (y ch)=X T β̂ + η̂ , (3)ch c+ε̂(ch)where β̂ , η , ε̂(ch) , and denote the estimates for β, η ,ĉ cand ε (ch). Point estimates as well as standard errors <strong>of</strong>the welfare indicators are calculated by Monte-Carlosimulations. In each simulation, a set <strong>of</strong> values β̂ andare drawn from their estimated distributions, andε̂(ch)an estimate <strong>of</strong> expenditure and the poverty rates areobtained.Originally, the ELL method also draws location errorsfrom their estimated unconditional distributions. Forthose target population for which sampled data happento be available, this approach does not make optimaluse <strong>of</strong> available information. An approach proposedby Molina and Rao (2010) combines the simulationbasedapproach with what is referred to as EmpiricalBest, which uses the observed distribution <strong>of</strong> locationerror in the sampled data. With the adjustment that thedistribution functions <strong>of</strong> the errors are estimated nonparametrically,this approach has been implementedin the PovMap s<strong>of</strong>tware. The estimations in this reportuse the Empirical Best option – thus drawing errorsfrom their estimated distributions for all areas that arenot represented in the NLSS3 while drawing from theirobserved distributions for those that are sampled.For all three regional models, and in each simulation,ln̂ (y ch) is trimmed at the observed minimum andaximum values in the Survey. Subsequently, theaverage point estimate and standard deviation <strong>of</strong>500 simulations <strong>of</strong> (3) is calculated. Finally, predictedexpenditure and poverty for all households in theCensus is aggregated to generate VDC-, target area-,ilaka-, and district-level estimates. For the calculation<strong>of</strong> poverty indices we apply a poverty line <strong>of</strong> 19,261Nepali Rupees per person/year.2.2 A note <strong>of</strong> cautionWhile the practice <strong>of</strong> estimating the consumption model(1) on three separate regions, instead <strong>of</strong> estimatingone model for the whole <strong>of</strong> Nepal, creates the benefit<strong>of</strong> potentially capturing the relationship betweenexpenditure and the observables more closely it alsomakes the results more prone to over-fitting. In general,adding more explanatory variables and reducing thenumber <strong>of</strong> observations in the consumption model willlikely improve the apparent fit <strong>of</strong> the model measuredby R2. However, the larger the number <strong>of</strong> explanatoryvariables relative to the number <strong>of</strong> observations inthe sample, the larger the uncertainty associated withthem. It is therefore important to carefully examinethe fit <strong>of</strong> the models. This is done by taking a 50%random subsample <strong>of</strong> each survey region; treating onehalf (“subsample 1”) as the household survey and theother half (“subsample 2”) as the census. Using thesedatasets while repeating steps 2 and 3 outlined above,we can then compare the predicted poverty incidence insubsample 2 against the actual poverty incidence that isobserved. Since the households in subsample 2 are notincluded in the sample on which the model is calibrated,being able to predict poverty accurately suggest that theconsumption model is not too specific. A second wayin which we ascertained that the consumption modelis general enough that our final consumption modelsinclude only variables that are statistically significantat the 5% level on this random 50% subsample <strong>of</strong> theregions.Another thing to keep in mind is the usability-certaintytrade-<strong>of</strong>f. Introducing a lower level <strong>of</strong> aggregationthan that has been used before makes these maps andestimates more attractive to use for anti-poverty policymakingin Nepal. However, this comes at the cost <strong>of</strong>precision in the estimates. The fewer the households inthe area, the higher the standard error typically is, andthe less precise the point estimates. Especially whenranking target areas in terms <strong>of</strong> poverty rates, the useris strongly advised to take the reported standard errorinto account.4. Alpha models can reduce the influence <strong>of</strong> large residuals, thereby potentially improving small-area results. Typically their explanatory power is low, as we also find for our alphamodels; Central/Eastern R2=0.023, Western R2=0.035. For Mid/Farwestern, adding the alpha model causes point estimates to change only marginally while reducing averageprecision.NEPAL <strong>Small</strong> <strong>Area</strong> <strong>Estimation</strong> <strong>of</strong> <strong>Poverty</strong>, 2011, Summary and Major Findings 3
3. Data sources and description3.1 NLSS3 and 2010/11 Population CensusThe Nepal Living Standards Survey 2010/11 (henceforth- NLSS III) is the third round <strong>of</strong> its kind conducted inNepal (the first having been fielded in 1995/96) andfollows the general structure <strong>of</strong> the World Bank’s LivingStandard Measurement Study (LSMS) surveys. It isan integrated survey covering a wide range <strong>of</strong> topicsranging from consumption expenditure to agriculturalproduction, education and remittances. It is based onthe 2000 Population Census sample frame. In the firstsampling stage, 800 Primary Sampling Units that areidentical to those in the 2007/08 National Labor ForceSurvey are selected. They fall into six strata 5 . In thesecond-stage, 500 <strong>of</strong> these PSU’s were selected with anexplicit sub-stratification that culminates in the 14 strata<strong>of</strong> the NLSS III 6 . This selection was done proportionalto size - using the number <strong>of</strong> households as a measure<strong>of</strong> size. Finally, 12 households per PSU were selectedrandomly 7 . Sampling weights have been calculated asthe inverse <strong>of</strong> the primary sampling unit’s probability<strong>of</strong> being selected. Note that the probability <strong>of</strong> beingselected, and thus the sampling weight, is based onthe sample frame <strong>of</strong> the 2000 Population Census aswell as forecasts <strong>of</strong> the population size in 2010/11.NLSS3 finally includes 5,988 households and 28,474individuals.The second data source used to produce small-areaestimates <strong>of</strong> welfare is the Nepal Population Census2011. The National Planning Commission and CentralBureau <strong>of</strong> Statistics were very supportive to providecensus data at unit level for all common variableswith the NLSS III. The number <strong>of</strong> non-institutionalhouseholds is 5,423,297. After dropping those that hada missing level <strong>of</strong> education <strong>of</strong> the household head, weend up with a dataset <strong>of</strong> 5,337,972 households.Auxiliary data sources include VDC-level GISinformation obtained from the Vulnerability Analysisand Mapping unit <strong>of</strong> World Food Program Nepal.Variables are: mean elevation in kilometers, meanslope in percentage, height range, standard deviation<strong>of</strong> height, population density in inhabitants per squarekilometer, distance to the district headquarters, length<strong>of</strong> road in kilometers (by ilaka), length <strong>of</strong> road inkilometers per thousand inhabitants (by ilaka), length<strong>of</strong> rivers in kilometers (a more detailed description canbe found in CBS et al, 2006). This information dates backto 2006, but since most variables don’t change (rapidly)over time they are still useful for the analysis in thisreport. However, as we expect that accessibility is aparticularly important indicator for welfare, we addedanother variable called “Kosh”. The CBS prepared thisvariable at the VDC level, and it measures how manyhours it takes for a normal person to walk from theVDC to the district headquarters.3.2 Common and comparable variablesTable A1 in Appendix I (<strong>of</strong> the main document)presents the mean, minimum, maximum, and standarddeviation <strong>of</strong> common variables between the survey andthe census. As the census enumeration was done in June2011 closely on the heels <strong>of</strong> the survey (February 2010 toFebruary 2011), one would expect very little variationbetween both data sources. Yet, we find that for a number<strong>of</strong> household-level variables the census mean does notlie within two standard errors <strong>of</strong> the survey, i.e. they arestatistically different. One potential explanation for thisis that the Census is conducted four months after theSurvey, a time lapse <strong>of</strong> 10 months from the mid-point <strong>of</strong>theone year survey period and the census date. If overthe span <strong>of</strong> that short period the Nepali population hasbecome better <strong>of</strong>f in terms <strong>of</strong> some major indicators,such as the construction material <strong>of</strong> their homes orthe level <strong>of</strong> education <strong>of</strong> the household head, then thiscould be a reasonable explanation. Alternatively, thedifference could be attributed to misrepresentation<strong>of</strong> the population in the NLSS III household survey.Population weights convert the survey sample to strataleveland nationally representative numbers, but theyare based on a forecast <strong>of</strong> the 2010 population made in2001. However, even after adjusting the weights basedon the actual 2011 Census population, the survey andcensus means <strong>of</strong> the majority <strong>of</strong> the common variablesstill don’t line up. Alongside these household-levelvariables, Census means on the level <strong>of</strong> the ward and5 These 5 strata are: Mountains; Urban Kathmandu, Other urban in hills, Other urban in terai, Rural hills, Rural terai6 These 14 strata are: Mountains, Urban Kathmandu, Other urban in hills, Rural eastern hills, Rural central hills, Rural western hills, Rural midwestern hills, Ruralfarwestern hills, Urban terai, Rural east terai, Rural central terai, Rural western terai, Rural midwestern terai, Rural farwestern terai.7 For more details on sample design see NLSS III Statistical Report, volume 1, Central Bureau <strong>of</strong> Statistics.4 NEPAL <strong>Small</strong> <strong>Area</strong> <strong>Estimation</strong> <strong>of</strong> <strong>Poverty</strong>, 2011, Summary and Major Findings
the VDC are calculated and added to the commonand comparable variable pool from which to select themodels. Even those variables that are incomparable onthe household level are comparable at higher levels,such as VDC, and could thus be added.As comparability <strong>of</strong> the survey and census variablesis a strong requirement for the small-area estimationmethodology to provide accurate results, this issue posesa challenge 8 . For the analysis in this report, we takethe conservative approach to limit the set <strong>of</strong> candidatevariables to those that are strictly comparable betweensurvey and census in the regions we are working with.Tables A2-A4 in Appendix I (<strong>of</strong> the main document)present the statistics for the variables that were selectedinto the three regional consumption models.3.3 Definition <strong>of</strong> “target area”Besides the five regions that are already introduced(East, Central, Midwest, West and Farwest), Nepalis divided into three ecological zones that run fromeast to west and that are defined by their altitude;Mountains, Hills, and Terai. Terai areas, or plains, arebelow 610 meters above sea level. They are generallythe most fertile and run alongside the southern border.The Hills are between 610 and 4,887 meters high, andinclude also Kathmandu and the touristic hotspot <strong>of</strong>Pokhara. Mountains are most sparsely populated andinclude all areas above 4,887 meters; obviously withmuch harder living conditions and lower levels <strong>of</strong>infrastructure. The country is divided into 75 districtsthat range in population between 5,819 (Manang) and1,688,131 (Kathmandu). The map in Figure 1 shows thedistrict boundaries and the three ecological belts in thecountry.Each district is divided into between 9 and 20 ilakas,which are collections <strong>of</strong> VDC’s and municipalitieswhich are respectively represented in the districtdevelopment committee. Ilaka’s are <strong>of</strong>ficiallyrecognized by the Ministry <strong>of</strong> Local Development. The2006 poverty maps are produced at the Ilaka level 9 .As indicated before, the Central Bureau <strong>of</strong> Statistics iswith technical support from the World Bank, making aneffort to produce small-area estimates at an as detailed aspossible level <strong>of</strong> geographic disaggregations. The mainFigure 1- Belts and district boundaries <strong>of</strong> Nepal7273TERAI6675686774HILLMOUNTAINTERAI65MOUNTAIN63706462694260615441715943554053 45583744HILL5752 46395638514750 49 4835353629302823272631 25 24 212034 3332 19181722121611MOUNTAIN13 107146159 185TERAI234World Bank 201 3 DECCTNational park8 . It is beyond the scope <strong>of</strong> this report to attempt to discover the cause <strong>of</strong> the disagreement between variables in the household survey and population census. But clearly this isan issue <strong>of</strong> concern.9. However, they redifined the original ilaka’s to be the rural part <strong>of</strong> existing ilaka’s only (927), and added each <strong>of</strong> the 58 urban municipalities as a new ilaka, resulting in a total<strong>of</strong> 976 new ilaka’s. For the ease <strong>of</strong> comparison, we adopt the same definition <strong>of</strong> ilaka in this report.NEPAL <strong>Small</strong> <strong>Area</strong> <strong>Estimation</strong> <strong>of</strong> <strong>Poverty</strong>, 2011, Summary and Major Findings 5
eason for this is to improve usability <strong>of</strong> the maps andpoverty estimates, for instance by district developmentcommittees that want to allocate social assistance. Whatresulted is what we call “target area”. For mountainareas, which are sparsely populated, this target areais equivalent to the ilaka. None <strong>of</strong> the mountain areashave sub-ilaka target areas. For all VDC’s in hills andterai, a more hands-on approach is adopted. First, if aVDC is sufficiently large and thus a precise estimate <strong>of</strong>poverty can be produced, the target area is equivalentto just that one VDC. This approach is adopted for allmunicipalities, for instance. Second, other VDC’s arecombined on the basis <strong>of</strong> three criteria: 1) VDC’s areadjacent, 2) VDC’s are similar in term <strong>of</strong> characteristics,and 3) the resulting target areas are reasonably large 10 .The distribution <strong>of</strong> the resulting target areas, as wellas that <strong>of</strong> districts, ilaka’s, and VDC’s, is outlined inTable 1. As per the way target areas are defined, thetable shows that in mountain areas, their size is equalto those <strong>of</strong> ilaka’s and that in hill and terai areas theiraverage size lies between that <strong>of</strong> ilaka and VDC. TableA II 5 in the Appendix II (<strong>of</strong> the main document) canbe used as a reference to look up which VDC’s fall intowhich target areaTable 1: <strong>Estimation</strong> levels and population sizeVDC/MUN-levelpopulation size <strong>of</strong> area# areas Mean Std. Dev. Min MaxWhole country 3,973 6,593 18,276 71 973,559Terai 1,394 9,467 11,654 868 200,596Hill 2,033 5,522 23,420 426 973,559Mountains 545 3,238 2,183 71 26,219Target area-levelWhole country 2,344 11,172 23,771 257 973,559Terai 896 14,729 14,492 1,766 200,596Hill 1,289 8,708 29,337 917 973,559Mountains 159 11,096 7,243 257 30,460Ilaka-levelWhole country 976 26,830 36,817 257 973,559Terai 325 40,607 20,639 4,623 200,596Hill 492 22,815 46,602 2,721 973,559Mountains 159 11,096 7,243 257 30,460District-levelWhole country 75 349,153 278,577 5,827 1,688,131Terai 20 659,868 138,681 422,695 958,579Hill 39 287,817 246,099 100,805 1,688,131Mountains 16 110,264 75,367 5,819 285,652Source: 2011 Population Census10. Similarity is judged by a crude estimate <strong>of</strong> FGT(0), as that is the “best guess” <strong>of</strong> the VDC’s level <strong>of</strong> welfare given the variable matrix this prediction is based on. It thusincorporates information on education levels, quality <strong>of</strong> the house, ownership <strong>of</strong> durables, GIS information such as average altitude and mean slope <strong>of</strong> the VDC, districtcharacteristics, etc. “Reasonably large” replaced the original goal <strong>of</strong> aiming for target areas <strong>of</strong> at least 5,000 households when this <strong>of</strong>ten proved to be contrast with theother criteria and with CBS’ aim to produce estimates for disaggregated sub-ilaka areas.6 NEPAL <strong>Small</strong> <strong>Area</strong> <strong>Estimation</strong> <strong>of</strong> <strong>Poverty</strong>, 2011, Summary and Major Findings
4. Results4.1 Strata-level results in comparison with NLSS3To get a general idea <strong>of</strong> the larger welfare trends, as wellas to judge the accuracy <strong>of</strong> our prediction models, we firstcompare the small-area estimations against the povertyincidence directly observed from NLSS3 at the strata level.This is the lowest level at which the household survey isrepresentative. Strata-level poverty rates are presentedin Table 2. The Z-value can be used to assess whetherthe predicted measure <strong>of</strong> poverty incidence FGT(0) iswithin two standard errors from the observed FGT(0) inthe NLSS3 11 . These Z-scores indicate that the small-areaestimations <strong>of</strong> poverty incidence based on our regionalmodels are generally within two standard errors <strong>of</strong> thepoverty incidence rates in the survey. However, two out<strong>of</strong> the 15 results fall outside the confidence interval <strong>of</strong> twostandard errors. <strong>Poverty</strong> incidence in rural central hilland rural western hill are predicted to be respectively17.4% and 20.2% compared to direct estimates from thesurvey <strong>of</strong> respectively 29.4% and 28%. Another thing tobe noted from the table is that the three regional modelsseem to do similarly well in predicting poverty. <strong>Poverty</strong>for Nepal as a whole lies well within the 2 standard errorbounds. It also reflects the trend <strong>of</strong> a poverty rate thatis decreasing over time: the country’s headcount ratecontinues its steady decline from 60 % in 1995/96, to49 % in 2003/04, to 25% in 2010/11, using comparableconcepts <strong>of</strong> consumption (monthly recall) and povertylines.The small area estimations <strong>of</strong> poverty, though generallywithin the confidence interval, are for the majority <strong>of</strong>strata somewhat lower than the direct estimates from thehousehold survey. This could be related to an issue notedearlier - census means <strong>of</strong> common variables being mostly‘better <strong>of</strong>f’ than population-weighted survey means.Table 2: Predicted poverty rates on the target level - by stratum and in comparison to NLSS3 poverty ratesObserved poverty rates NLSS IIIPredicted poverty rates at the target level# households FGT(0) # households FGT(0) FGT(1) FGT(2)Z-ValueMountain Mean 408 0.423 363,698 0.398 0.104 0.039 -0.552S.E. mean 0.043 0.014 0.005 0.002Urban-Kathmandu Mean 864 0.115 273,733 0.110 0.022 0.007 -0.307S.E. mean 0.015 0.005 0.002 0.001Urban-Hill Mean 480 0.087 335,015 0.104 0.023 0.008 0.613S.E. mean 0.021 0.019 0.005 0.002Rural-Hill-Eastern Mean 384 0.159 318,511 0.186 0.037 0.011 0.860S.E. mean 0.030 0.008 0.002 0.001Rural-Hill-Central Mean 480 0.294 598,323 0.174 0.040 0.013 -2.279S.E. mean 0.052 0.009 0.003 0.001Rural-Hill-Western Mean 480 0.280 542,632 0.202 0.047 0.016 -2.125S.E. mean 0.036 0.006 0.002 0.001Rural-Hill-Midwestern Mean 336 0.316 315,318 0.315 0.074 0.025 -0.034S.E. mean 0.044 0.007 0.002 0.001Rural-Hill-Farwestern Mean 180 0.476 147,832 0.472 0.128 0.048 -0.052S.E. mean 0.063 0.008 0.003 0.001Urban-Terai Mean 672 0.220 424,461 0.162 0.039 0.014 -1.442S.E. mean 0.035 0.020 0.006 0.002Rural-Terai-Eastern Mean 480 0.210 647,025 0.225 0.050 0.016 0.461S.E. mean 0.032 0.009 0.003 0.001Rural-Terai-Central Mean 480 0.231 713,183 0.242 0.055 0.018 0.390S.E. mean 0.027 0.006 0.002 0.001Rural-Terai-Western Mean 348 0.223 331,598 0.236 0.056 0.020 0.256S.E. mean 0.051 0.012 0.003 0.00111. It is defined as: Z = ( FGT(0) census - FGT(0) survey ) / √[ (S.E. census)2 + (S.E. census)2]. The value <strong>of</strong> Z should thus not exceed │2│for both measures to represent the samepoverty incidence.NEPAL <strong>Small</strong> <strong>Area</strong> <strong>Estimation</strong> <strong>of</strong> <strong>Poverty</strong>, 2011, Summary and Major Findings 7
Observed poverty rates NLSS IIIPredicted poverty rates at the target level# households FGT(0) # households FGT(0) FGT(1) FGT(2)Z-ValueRural-Terai-Midwestern Mean 240 0.256 240,088 0.278 0.067 0.023 0.383S.E. mean 0.056 0.012 0.004 0.002Rural-Terai-Farwestern Mean 156 0.384 171,203 0.351 0.088 0.032 -0.505S.E. mean 0.065 0.012 0.004 0.002Total Nepal Mean 5,988 0.252 5,422,620 0.235 0.055 0.019 -1.429S.E. mean 0.011 0.003 0.001 0.000Mountain Mean 408 0.423 363,698 0.398 0.104 0.039 -0.552S.E. mean 0.043 0.014 0.005 0.002Urban-Kathmandu Mean 864 0.115 273,733 0.110 0.022 0.007 -0.307S.E. mean 0.015 0.005 0.002 0.001Urban-Hill Mean 480 0.087 335,015 0.104 0.023 0.008 0.613S.E. mean 0.021 0.019 0.005 0.002Rural-Hill-Eastern Mean 384 0.159 318,511 0.186 0.037 0.011 0.860S.E. mean 0.030 0.008 0.002 0.001Rural-Hill-Central Mean 480 0.294 598,323 0.174 0.040 0.013 -2.279S.E. mean 0.052 0.009 0.003 0.001Rural-Hill-Western Mean 480 0.280 542,632 0.202 0.047 0.016 -2.125S.E. mean 0.036 0.006 0.002 0.001Rural-Hill-Midwestern Mean 336 0.316 315,318 0.315 0.074 0.025 -0.034S.E. mean 0.044 0.007 0.002 0.001Rural-Hill-Farwestern Mean 180 0.476 147,832 0.472 0.128 0.048 -0.052S.E. mean 0.063 0.008 0.003 0.001Urban-Terai Mean 672 0.220 424,461 0.162 0.039 0.014 -1.442S.E. mean 0.035 0.020 0.006 0.002Rural-Terai-Eastern Mean 480 0.210 647,025 0.225 0.050 0.016 0.461S.E. mean 0.032 0.009 0.003 0.001Rural-Terai-Central Mean 480 0.231 713,183 0.242 0.055 0.018 0.390S.E. mean 0.027 0.006 0.002 0.001Rural-Terai-Western Mean 348 0.223 331,598 0.236 0.056 0.020 0.256S.E. mean 0.051 0.012 0.003 0.001Rural-Terai-Midwestern Mean 240 0.256 240,088 0.278 0.067 0.023 0.383S.E. mean 0.056 0.012 0.004 0.002Rural-Terai-Farwestern Mean 156 0.384 171,203 0.351 0.088 0.032 -0.505S.E. mean 0.065 0.012 0.004 0.002Total Nepal Mean 5,988 0.252 5,422,620 0.235 0.055 0.019 -1.429S.E. mean 0.011 0.003 0.001 0.000Note: the standard error <strong>of</strong> the observed poverty incidence in NLSS III is calculated while taking into account population weights as wellas the survey’s stratified design. Z-value = ( FGT(0) census - FGT(0) survey ) / √[ (S.E. census)2 + (S.E. census)2]. The value <strong>of</strong> Z should thusnot exceed │2│for both measures to represent the same poverty incidence. Source: NLSS III4.2. District, ilaka, and target-level resultsTable A II 1 in Appendix II (<strong>of</strong> the main document) presents smallarea estimations <strong>of</strong> poverty on the level <strong>of</strong> the district. The eightleast poor districts are Kaski, Ilam, Lalitpur, Kathmandu, Chitawan,Jhapa, Panchthar and Syangja. Their headcount rates range between4% and 11.8%. On the other end <strong>of</strong> the distribution are districtsDarchula, Humla, Bajhang, Kalikot and Bajura with headcount rates<strong>of</strong> more than 50%. It must be stressed that comparisons <strong>of</strong> povertyacross areas should take note <strong>of</strong> the accompanying standard errorson the point estimates. For instance, although district Jumla has anestimated headcount rate <strong>of</strong> 49% and district Humla has a headcountrate <strong>of</strong> 56%; both estimates are associated with high standard errors.In fact, Humla’s point estimate <strong>of</strong> 56% falls within 1.96 standarderrors <strong>of</strong> Jumla’s point estimate; meaning that they are statisticallyindistinguishable at a 95% confidence level. The smaller the size <strong>of</strong>the target area; the more uncertainty is associated with the predictedpoverty rates. The next chapter elaborates further on the interpretation<strong>of</strong> the results and their precision.8 NEPAL <strong>Small</strong> <strong>Area</strong> <strong>Estimation</strong> <strong>of</strong> <strong>Poverty</strong>, 2011, Summary and Major Findings
With the previous poverty mapping exercise in 2006, povertyincidence at the ilaka level had been estimated to range between 1%and 82% using the 2001 Population Census (CBS et al., 2006). Thecurrent 2010/11 estimations are <strong>of</strong> similar magnitude, albeit slightlylower in line with steady poverty reduction over the past decade. Wefind poverty incidence levels ranging between 0.5% and 72.8% onthe ilaka level, with an unweighted mean/median <strong>of</strong> 26.9%/25.7%(see table A II 2 in Appendix II (<strong>of</strong> the main document)). Previousilaka-level FGT(0) estimates had an average standard error <strong>of</strong> 0.038,compared to 0.056 now. The 2006 results are likely somewhat moreprecise as they were able to select a consumption model from a muchlarger set <strong>of</strong> common variables; besides the incomparability issuediscusses above, the previous exercise had access to a larger set <strong>of</strong>data. Particularly, agricultural information on the ownership <strong>of</strong>livestock, poultry, agricultural land, and ownership <strong>of</strong> a business wasavailable then, and this information would arguably be a resourcefuladdition to the models underlying our results. In addition, asdiscussed above, the strategy for calculating standard errors takenin this study can be regarded as ‘conservative’ and may also accountfor slightly wider standard errors than the previous poverty mappingexercise.<strong>Poverty</strong> incidence on the level <strong>of</strong> target-area ranges between 0.04%and 77%, with an unweighted mean/median <strong>of</strong> 26.6%/25.3% (seeTable A II 3 in Appendix II(<strong>of</strong> the main document), and Table A II5 for a reference <strong>of</strong> which VDC’s fall into which target-area). Thestandard error is not much larger than that <strong>of</strong> ilaka’s; on average it is0.065. Table 3 shows for districts, ilaka’s and target areas the summarystatistics <strong>of</strong> small-area estimations <strong>of</strong> their poverty incidence / FGT(0),poverty gap / FGT(1), and poverty severity / FGT(2). The small-areaestimation <strong>of</strong> the headcount rate, poverty gap, and poverty severityare presented in the appendix on the level <strong>of</strong> the district, ilaka,target-area, and VDC. To underline the uncertainty <strong>of</strong> the VDC-levelestimates, due to their small size, these results are presented in TableA II 4 in Appendix II (<strong>of</strong> the main document) by their 95% confidenceinterval 12 rather than their point estimate and standard error.Table 3: Summary statistics <strong>of</strong> predicted poverty ratesTarget-areaFGT(0) S.E. FGT(0) FGT(1) S.E. FGT(1) FGT(2) S.E. FGT(2)Minimum 0.004 0.003 0.001 0.000 0.000 0.000Maximum 0.770 0.129 0.311 0.060 0.156 0.033Mean 0.266 0.065 0.063 0.021 0.022 0.009Median 0.253 0.062 0.054 0.018 0.017 0.007IlakaMinimum 0.005 0.004 0.001 0.001 0.000 0.000Maximum 0.728 0.119 0.265 0.059 0.123 0.032Mean 0.269 0.056 0.065 0.019 0.023 0.008Median 0.257 0.048 0.055 0.014 0.017 0.006DistrictMinimum 0.040 0.006 0.008 0.002 0.003 0.001Maximum 0.641 0.115 0.199 0.055 0.082 0.029Mean 0.277 0.049 0.067 0.017 0.024 0.007Median 0.260 0.031 0.058 0.009 0.019 0.004Note: Statistics are not weighted by size <strong>of</strong> the area and the mean and median should thus beinterpreted as pertaining to an average and median area (not an average / median person in thecountry).4.3 MapsMaps <strong>of</strong> the poverty incidence and number <strong>of</strong> poor atthe district, ilaka, and target level are presented belowin Figures 2-7 . Maps <strong>of</strong> average consumption level,poverty gap, and poverty severity at the district, Ilakaand target level can be found in Appendix I (<strong>of</strong> themain document)12. calculated by the standard formula: mean ± 1.96 times the standard error.NEPAL <strong>Small</strong> <strong>Area</strong> <strong>Estimation</strong> <strong>of</strong> <strong>Poverty</strong>, 2011, Summary and Major Findings 9
Figure 2: <strong>Poverty</strong> incidence on district levelWB DECCT 201 3-06<strong>Poverty</strong> incidence FGT(0)< 15.9 %15.9 - 24.4 %24.4 - 28.7 %28.7 - 37.7 %> 37.7 %Figure 3: Number <strong>of</strong> poor (FGT(0)) on district levelWB DECCT 201 3-06Number <strong>of</strong> poor people< 2481 32481 3 - 2927529275 - 31 85431 854 - 37331> 3733110 NEPAL <strong>Small</strong> <strong>Area</strong> <strong>Estimation</strong> <strong>of</strong> <strong>Poverty</strong>, 2011, Summary and Major Findings
Figure 4 : <strong>Poverty</strong> incidence on the ilaka levelWB DECCT 201 3-06<strong>Poverty</strong> incidence FGT(0)< 12.2 %12.2 - 23.0 %23.0 - 34.5 %34.5 - 48.7 %> 48.7 %Figure 5: Number <strong>of</strong> poor (FGT(0)) on the ilaka levelWB DECCT 201 3-06Number <strong>of</strong> poor people< 20942094 - 39603960 - 63886388 - 9826> 9826NEPAL <strong>Small</strong> <strong>Area</strong> <strong>Estimation</strong> <strong>of</strong> <strong>Poverty</strong>, 2011, Summary and Major Findings 11
Figure 6- <strong>Poverty</strong> incidence on target-area levelWB DECCT 201 3-06<strong>Poverty</strong> incidence FGT(0)< 13.0 %13.0 - 21.5 %21 .5 - 30.0 %30.0 - 39.3 %> 39.3 %Figure 7 - Number <strong>of</strong> poor (FGT(0)) on target-area levelWB DECCT 201 3-06Number <strong>of</strong> poor people< 744744 - 13681368 - 22322232 - 391 6> 391612 NEPAL <strong>Small</strong> <strong>Area</strong> <strong>Estimation</strong> <strong>of</strong> <strong>Poverty</strong>, 2011, Summary and Major Findings
5. How reliable are these maps?5.1 tests for over-fittingTo ascertain that the coefficients estimated with the betaand alpha models capture the general relationshipsbetween expenditure and observables, rather than beingonly relevant for a limited set <strong>of</strong> survey households,all regions are subject to over-fitting tests. They arecarried out in accordance with their description in themethodology section. Thus, estimating the modelson a 50% subsample <strong>of</strong> the region, following the ELLmethodology, and comparing the predicted results inthe other 50% subsample with observed expenditure inthat sub-sample. Meanwhile, variables that were foundinsignificant on the first subsample were excluded fromthe models. Table 4 shows the results <strong>of</strong> this exercise. Thepredicted and observed FGT(0) is presented by the threeregions for which we have separate models, as well as bystrata within those regions. Z-values for all 22 categoriesare below the absolute value <strong>of</strong> two, suggesting thatour models are not over-fitting. Note that for the subregionalcategories, these Z-values must be taken with agrain <strong>of</strong> salt as their low number <strong>of</strong> observations (abouthalf <strong>of</strong> their normal stratum size, or less) may cause theconfidence interval to be relatively wide. But regardless,just looking at the total <strong>of</strong> the three regions gives usconfidence in the estimated results with Z-values <strong>of</strong>0.002, 1.016 and 0.220 for respectively Central&Eastern,Western, and Midwestern & Farwestern.Table 4: Over-fitting test comparing observed and predicted FGT(0) in a subsample <strong>of</strong> the NLSS3 surveyObserved FGT(0) in subsample 2 (survey Predicted FGT(0) in subsample 2Strata: N Mean S.E. mean Mean S.E. mean Z-valueCentral & Eastern region:Mountain 127 0.205 0.036 0.152 0.016 -1.330Urban-Kathma 422 0.104 0.015 0.134 0.008 1.744Urban-Hill 73 0.082 0.032 0.109 0.018 0.736Rural-Hill-Eastern 192 0.130 0.024 0.180 0.015 1.727Rural-Hill-Central 239 0.188 0.025 0.154 0.014 -1.175Urban-Terai 199 0.156 0.026 0.158 0.015 0.081Rural-Terai-Eastern 233 0.180 0.025 0.164 0.014 -0.564Rural-Terai-Central 237 0.215 0.027 0.191 0.014 -0.810Total Central & Eastern region 1722 0.157 0.009 0.157 0.005 0.002Western region:Urban-Hill 116 0.009 0.009 0.020 0.005 1.139Rural-Hill-Western 246 0.211 0.026 0.233 0.016 0.689Urban-Terai 45 0.089 0.043 0.079 0.026 -0.207Rural-Terai-Western 169 0.166 0.029 0.191 0.018 0.742Total Western region 576 0.148 0.015 0.166 0.010 1.016Midwestern & Farwestern region:Mountain 82 0.451 0.055 0.505 0.029 0.856Urban-Hill 37 0.189 0.065 0.252 0.039 0.820Rural-Hill-Midwestern 181 0.293 0.034 0.325 0.018 0.839Rural-Hill-Farwestern 87 0.414 0.053 0.354 0.027 -1.000Urban-Terai 88 0.295 0.049 0.270 0.029 -0.450Rural-Terai-Midwestern 125 0.192 0.035 0.222 0.022 0.712Rural-Terai-Farwestern 78 0.372 0.055 0.298 0.029 -1.181Urban-Terai 88 0.295 0.049 0.270 0.029 -0.450Rural-Terai-Midwestern 125 0.192 0.035 0.222 0.022 0.712Rural-Terai-Farwestern 78 0.372 0.055 0.298 0.029 -1.181Total Midwestern & Farwestern region 678 0.313 0.018 0.317 0.010 0.220Presenting observed and predicted poverty in a random subsample <strong>of</strong> the survey by stratum, where the predicted poverty rate is based ona consumption model calibrated on the other half <strong>of</strong> the survey data (“subsample 1”). Z-value = ( FGT(0) census - FGT(0) survey ) / √[ (S.E.census)2 + (S.E. census)2]. The value <strong>of</strong> Z should thus not exceed │2│for both measures to represent the same poverty incidence. Source: NLSSIII.NEPAL <strong>Small</strong> <strong>Area</strong> <strong>Estimation</strong> <strong>of</strong> <strong>Poverty</strong>, 2011, Summary and Major Findings 13
5.2 Breakdown <strong>of</strong> standard errorsHow much uncertainty is associated with the results?This is an important question to address, and this canbe done straightforwardly. As both point estimates andstandard errors <strong>of</strong> the poverty indicators are displayed,precision can be judged directly from the tables inthe Appendix, since the standard error reflects theuncertainty <strong>of</strong> the estimate on its particular estimationlevel. Between the three regional models it must benoted that the Midwestern&Farwestern region hassignificantly higher levels <strong>of</strong> uncertainty, and relatedly,a higher location error. Within these regions the usermay subsequently find few statistically distinguishabletarget areas within the same ilaka, raising doubtsabout the appropriateness <strong>of</strong> the target area level.Yet, in other areas it may indeed prove meaningful tocompare sub-ilaka poverty rates, and it will indeedadd valuable information beyond ilaka-level povertyrates. Additionally, with an expanded common variablelist (either adding agricultural variables, or solvingincomparability between Survey and Census) will likelyimprove precision <strong>of</strong> small-area estimates on the targetlevel - thereby improving their usage. Figure 6 displaysthe target-level standard errors <strong>of</strong> poverty incidence bythe three regions, and by the size <strong>of</strong> the target area. Italso shows a downward-sloping relationship betweenthe size <strong>of</strong> the target area and the standard error, asexpected.The difference between the actual level <strong>of</strong> welfarein a given area and its predicted value using theELL small-area estimation methodology can beattributed to different sources (see Elbers, Lanjouwand Lanjouw, 2003 for details). First, idiosyncraticerror encompasses deviations from the actual welfarelevel due to realizations in the unobserved componentin expenditure, which decreases with the size <strong>of</strong> thearea (and its number <strong>of</strong> clusters) at which the welfareindicators are calculated. In other words, this error isdue to a small area size. Second, model error arises asthe difference between the true relationship betweenexpenditure and observables and the captured one, forinstance due to over-fitting or failing to capture a nonlinearrelationship. Both the beta model and the alphamodel contribute to this source <strong>of</strong> error. Third, there iscomputational error associated with the third stage <strong>of</strong>the ELL method, which can be kept low by increasingthe number <strong>of</strong> repetitions - in our case to 500. Thenthere is the variance in the location error, which isreduced by using the Empirical Best application.Figure 8 - Standard error <strong>of</strong> FGT(0) by target area size (number <strong>of</strong> households)14 NEPAL <strong>Small</strong> <strong>Area</strong> <strong>Estimation</strong> <strong>of</strong> <strong>Poverty</strong>, 2011, Summary and Major Findings
6. Conclusions and suggestions for follow-up workIn this exercise <strong>of</strong> small area estimation <strong>of</strong> poverty wehave been able to provide statistically reliable povertymeasures for 2344 areas <strong>of</strong> Nepal by combining theresults <strong>of</strong> NLSS III and Census 2011. When statisticalreliability is doubtful, similar VDCs have beencombined to generate reliable poverty estimates forthe select aggregate <strong>of</strong> VDCs inside a given ilaka. Theestimates are more disaggregated than the ilaka level(967 areas) estimates done in 2006. In addition, for allthe 3972 <strong>of</strong> VDCs / Municipalities considered mostuseful for development purposes confidence intervals<strong>of</strong> poverty estimates are provided.<strong>Poverty</strong> both in proportion and the absolute number<strong>of</strong> poor is high in the hilly areas <strong>of</strong> Far West and parts<strong>of</strong> Mid West. The percentage <strong>of</strong> poor varies fromnegligible in parts <strong>of</strong> Kathmandu to 75 percent in parts<strong>of</strong> Gorkha district. A comparison with the poverty map<strong>of</strong> 2006 shows that though prosperity is spreading inNepal, it has a hard time moving West and climbingHills. <strong>Poverty</strong> concentration in the East and Centralhas declined while it increased in the rest. Nearly halfthe small areas have poverty higher than the nationalaverage <strong>of</strong> 25.2 percent and contain two-thirds <strong>of</strong> thepoor in Nepal.The character <strong>of</strong> the spatial distribution <strong>of</strong> povertyin Nepal is not new but the estimates at 2344 smallareas along with their standard errors should help inbetter design <strong>of</strong> development interventions. While itis straight forward to target development activities inareas with extreme poverty, in areas where povertyis not distinctly different, randomized experimentdesigns can be used to pick appropriate interventionsthat are most effective.The poverty maps could usefully be expanded toother indicators <strong>of</strong> welfare such as nutrition and foodsecurity like in 2006. Detailed spatial distribution <strong>of</strong>poverty <strong>of</strong>fers an opportunity to explore further thecauses <strong>of</strong> poverty trends in Nepal. When combinedwith the spatial distribution <strong>of</strong> correlates <strong>of</strong> povertysuch as access to roads, schools and health facilities,and other variable <strong>of</strong> economic geography, one canfurther our understanding <strong>of</strong> the persistence <strong>of</strong> pockets<strong>of</strong> poverty in Nepal.NEPAL <strong>Small</strong> <strong>Area</strong> <strong>Estimation</strong> <strong>of</strong> <strong>Poverty</strong>, 2011, Summary and Major Findings 15
ReferencesAlderman, H., Babita, M., Demombynes, G., Makhatha, N., and Ozler, B., (2001), “How Low Can You Go?Combining Census and Survey Data for Mapping <strong>Poverty</strong> in South Africa”, Journal <strong>of</strong> African Economies, Vol.11(3).Banerjee, A., Deaton, A. (chair), Lustig, N., and Rog<strong>of</strong>f, K., (2006), “An Evaluation <strong>of</strong> World BankResearch, 1998-2005”. The report can be found at: http://siteresources.worldbank.org/DEC/Resources/84797-1109362238001/726454-1164121166494/RESEARCH-EVALUATION-2006-Main-Report.pdfBedi, T., Coudouel, Al, and Simer, S., (2007), “More than a Pretty Picture: Using <strong>Poverty</strong> Maps to Design BetterPolicies and Interventions.” Washington, DC: World Bank.Central Bureau <strong>of</strong> Statistics (CBS), The World Food Programme (WFP) and The World Bank (WB), (2006), “<strong>Small</strong><strong>Area</strong> <strong>Estimation</strong> <strong>of</strong> <strong>Poverty</strong>, Caloric Intake and Malnutrition in Nepal”. Published by: CBS, WFP and WB;September 2006. ISBN 99933-701-8-5Demombynes, G., Elbers, C., Lanjouw, J.L., and Lanjouw, P., (2006), “How Good a Map: Putting <strong>Small</strong> <strong>Area</strong><strong>Estimation</strong> to the Test”, mimeo, DECRG, the World BankElbers, C., Lanjouw, J., Lanjouw, P., and Leite, P., (2001), “<strong>Poverty</strong> and Inequality in Brazil New Estimates fromCombined PPV-PNAD Data”, mimeo, DECRG, the World Bank.Elbers, C., Lanjouw, J., and Lanjouw, P., (2002), “Micro-Level <strong>Estimation</strong> <strong>of</strong> Welfare”, World Bank Policy ResearchWorking Paper No. WPS 2911Elbers, C., Lanjouw, J., and Lanjouw, P., (2003), “Micro-level <strong>Estimation</strong> <strong>of</strong> <strong>Poverty</strong> and Inequality”, Econometrica,Vol. 71, pp. 355-364.Elbers, C., Lanjouw, P., and Leite, P., (2008), “Brazil within Brazil: Testing the <strong>Poverty</strong> Mapping Methodology inMinas Gerais” , mimeo, DECRG, the World Bank.Ferreira, F., Lanjouw, P., and Neri, M., (2003), “A New <strong>Poverty</strong> Pr<strong>of</strong>ile for Brazil using PPV, PNAD and CensusData”, Revista Brasileira de Economia, Vol. 57(1).Ghosh, M. and Rao, J., (1994), “<strong>Small</strong> <strong>Area</strong> <strong>Estimation</strong>: An Appraisal”, Statistical Science, Vol. 9, pp: 55-93Hasslett, S., and Jones, G., (2005), “Local <strong>Estimation</strong> <strong>of</strong> <strong>Poverty</strong> in the Philippines”, The National StatisticsCoordination Board <strong>of</strong> the Philippines and the World Bank.Lanjouw, P., Marra, M., and Nguyen, C., (2013), “Vietnam’s Evolving <strong>Poverty</strong> Map: Patterns and Implications forPolicy”, World Bank Policy Research Working Paper No. WPS 6355Molina, I, and Rao, J., (2010), “<strong>Small</strong> <strong>Area</strong> <strong>Estimation</strong> <strong>of</strong> <strong>Poverty</strong> Indicators”, Canadian Journal <strong>of</strong> Statistics, Vol.38,pp: 369-385.Nguyen, C., Truoung, T., and Van der Weide, R., (2010), “<strong>Poverty</strong> and Inequality Maps in Rural Vietnam: AnApplication <strong>of</strong> <strong>Small</strong> <strong>Area</strong> <strong>Estimation</strong>”, Asian Economic Journal, Vol. 24(4), pp. 355-390.Rao, J., (2003), “<strong>Small</strong> <strong>Area</strong> <strong>Estimation</strong>”, London: WileyTarozzi, A., and Deaton, A., (2009), “Using Census and Survey Data to Estimate <strong>Poverty</strong> and Inequality for <strong>Small</strong><strong>Area</strong>s”, The Review <strong>of</strong> Economics and Statistics, Vol. 91 (4), pp:773-792.16 NEPAL <strong>Small</strong> <strong>Area</strong> <strong>Estimation</strong> <strong>of</strong> <strong>Poverty</strong>, 2011, Summary and Major Findings
AppendixTables with small area estimations <strong>of</strong> poverty on the level <strong>of</strong> the district, ilaka, target level (municipality), andtarget-level (FGT0 > 0.505.A 1: SAE <strong>Poverty</strong> Rates at the District level; Average and Standard ErrorDistrict Population FGT(0) S.E. FGT(0) FGT(1) S.E. FGT(1) FGT(2) S.E. FGT(2)Taplejung 126404 0.270 0.034 0.055 0.010 0.017 0.004Panchthar 190394 0.114 0.020 0.019 0.004 0.005 0.001Ilam 287734 0.073 0.011 0.012 0.002 0.003 0.001Jhapa 807308 0.106 0.011 0.019 0.003 0.005 0.001Morang 958579 0.165 0.011 0.033 0.003 0.010 0.001Sunsari 750319 0.120 0.014 0.022 0.004 0.006 0.001Dhankuta 161288 0.159 0.019 0.029 0.005 0.008 0.002Terhathum 100805 0.146 0.020 0.025 0.005 0.007 0.002Sankhuwasabha 158139 0.210 0.031 0.041 0.008 0.012 0.003Bhojpur 181203 0.244 0.028 0.048 0.007 0.014 0.003Solukhumbu 105080 0.257 0.030 0.057 0.009 0.019 0.004Okhaldhunga 146782 0.205 0.023 0.041 0.006 0.012 0.002Khotang 205176 0.250 0.027 0.050 0.007 0.015 0.003Udayapur 315251 0.259 0.022 0.058 0.007 0.019 0.003Saptari 637071 0.395 0.019 0.100 0.008 0.036 0.004Siraha 634844 0.346 0.019 0.080 0.007 0.027 0.003Dhanusa 752253 0.231 0.018 0.046 0.005 0.014 0.002Mahottari 621023 0.162 0.029 0.035 0.009 0.011 0.004Sarlahi 765959 0.177 0.018 0.036 0.005 0.011 0.002Sindhuli 292988 0.383 0.031 0.099 0.012 0.036 0.006Ramechhap 201202 0.256 0.023 0.056 0.007 0.018 0.003Dolakha 184931 0.260 0.030 0.057 0.009 0.018 0.004Sindhupalchok 285652 0.254 0.031 0.054 0.009 0.017 0.004Kavrepalanchok 375040 0.139 0.019 0.025 0.005 0.007 0.002Lalitpur 453466 0.076 0.008 0.015 0.002 0.005 0.001Bhaktapur 296705 0.125 0.014 0.029 0.004 0.010 0.002Kathmandu 1688131 0.076 0.006 0.015 0.002 0.005 0.001Nuwakot 275344 0.203 0.019 0.042 0.005 0.013 0.002Rasuwa 42125 0.316 0.043 0.072 0.015 0.024 0.006Dhading 333978 0.188 0.018 0.038 0.005 0.012 0.002Makwanpur 414476 0.279 0.020 0.073 0.008 0.027 0.004Rautahat 680659 0.334 0.018 0.083 0.006 0.029 0.003Bara 680094 0.299 0.019 0.072 0.007 0.025 0.003Parsa 592108 0.292 0.020 0.071 0.007 0.025 0.003Chitawan 567992 0.089 0.011 0.017 0.003 0.005 0.001Gorkha 268862 0.204 0.039 0.049 0.011 0.018 0.005Lamjung 166141 0.168 0.033 0.039 0.009 0.013 0.004Tanahu 320532 0.148 0.028 0.033 0.008 0.011 0.003Syangja 288097 0.118 0.027 0.024 0.007 0.007 0.002NEPAL <strong>Small</strong> <strong>Area</strong> <strong>Estimation</strong> <strong>of</strong> <strong>Poverty</strong>, 2011, Summary and Major Findings 17
A 1: SAE <strong>Poverty</strong> Rates at the District level; Average and Standard ErrorDistrict Population FGT(0) S.E. FGT(0) FGT(1) S.E. FGT(1) FGT(2) S.E. FGT(2)Kaski 480851 0.040 0.011 0.008 0.003 0.003 0.001Manang 5827 0.369 0.056 0.099 0.020 0.038 0.009Mustang 11585 0.400 0.055 0.109 0.020 0.042 0.009Myagdi 109598 0.286 0.044 0.073 0.015 0.027 0.007Parbat 145657 0.127 0.029 0.025 0.007 0.008 0.002Baglung 266622 0.229 0.040 0.053 0.012 0.018 0.005Gulmi 279005 0.256 0.048 0.059 0.015 0.020 0.006Palpa 258842 0.216 0.038 0.052 0.012 0.018 0.005Nawalparasi 638836 0.170 0.031 0.038 0.009 0.013 0.003Rupendehai 873314 0.173 0.029 0.041 0.009 0.014 0.004Kapilbastu 568692 0.355 0.052 0.089 0.018 0.032 0.008Arghakhanchi 196873 0.288 0.050 0.069 0.016 0.024 0.007Pyuthan 226128 0.322 0.087 0.079 0.029 0.028 0.012Rolpa 221170 0.260 0.087 0.056 0.025 0.018 0.009Rukum 207279 0.263 0.092 0.058 0.026 0.019 0.010Salyan 241685 0.288 0.088 0.063 0.026 0.021 0.010Dang 547926 0.251 0.080 0.059 0.026 0.020 0.011Banke 484592 0.264 0.073 0.066 0.025 0.024 0.011Bardiya 422812 0.287 0.082 0.071 0.026 0.025 0.011Surkhet 343160 0.305 0.085 0.075 0.029 0.026 0.012Dailekh 260826 0.358 0.100 0.088 0.034 0.031 0.014Jajarkot 170090 0.377 0.104 0.090 0.035 0.031 0.014Dolpa 36110 0.428 0.106 0.110 0.039 0.040 0.017Jumla 107395 0.490 0.113 0.131 0.045 0.049 0.021Kalikot 135939 0.579 0.101 0.168 0.047 0.066 0.023Mugu 54789 0.471 0.115 0.125 0.045 0.047 0.021Humla 49914 0.560 0.103 0.166 0.048 0.067 0.024Bajura 134062 0.641 0.105 0.199 0.055 0.082 0.029Bajhang 194515 0.568 0.112 0.162 0.050 0.063 0.024Achham 256102 0.472 0.102 0.127 0.040 0.047 0.018Doti 206671 0.489 0.101 0.135 0.042 0.052 0.020Kailali 765487 0.336 0.091 0.084 0.031 0.030 0.013Kanchanpr 447645 0.314 0.080 0.080 0.028 0.029 0.012Dadeldhura 140779 0.433 0.101 0.118 0.039 0.045 0.018Baitadi 250065 0.457 0.101 0.123 0.039 0.046 0.018Darchula 132081 0.530 0.109 0.152 0.048 0.059 0.02418 NEPAL <strong>Small</strong> <strong>Area</strong> <strong>Estimation</strong> <strong>of</strong> <strong>Poverty</strong>, 2011, Summary and Major Findings
A 2: SAE <strong>Poverty</strong> Rates at the Target level (Municipality); Average and Standard ErrorMunicipality Name Population FGT(0) S.E. FGT(0) FGT(1) S.E. FGT(1) FGT(2) S.E. FGT(2)Ilam Municipality 18553 0.113 0.034 0.022 0.008 0.007 0.003Bhadrapur Municipality 18120 0.135 0.039 0.026 0.010 0.007 0.003Damak Municipality 75019 0.126 0.032 0.023 0.008 0.006 0.003Mechinagar Municipality 57512 0.222 0.061 0.045 0.017 0.014 0.006Biratnagar Sub-Metropolitan City 200596 0.175 0.019 0.039 0.006 0.013 0.002Dharan Municipality 115157 0.038 0.009 0.006 0.002 0.001 0.001Inaruwa Municipality 28215 0.168 0.040 0.036 0.011 0.011 0.004Itahari Municipality 74064 0.066 0.018 0.012 0.004 0.003 0.001Dhankuta Municipality 26381 0.103 0.034 0.020 0.008 0.006 0.003Khandbari Municipality 26219 0.046 0.016 0.006 0.003 0.001 0.001Triyuga Municipality 69886 0.163 0.035 0.034 0.009 0.010 0.003Rajbiraj Municipality 37639 0.212 0.042 0.052 0.013 0.019 0.006Lahan Municipality 33562 0.258 0.056 0.058 0.017 0.019 0.007Siraha Municipality 28417 0.421 0.069 0.112 0.027 0.041 0.012Janakpur Municipality 97642 0.150 0.029 0.031 0.008 0.010 0.003Jaleshwor Municipality 23147 0.161 0.044 0.037 0.014 0.013 0.006Malangawa Municipality 24881 0.131 0.038 0.027 0.010 0.008 0.004Kamalamai Municipality 39300 0.187 0.039 0.042 0.011 0.014 0.004Bhimeshwor Municipality 22385 0.078 0.020 0.013 0.004 0.004 0.001Banepa Municipality 24672 0.013 0.009 0.002 0.001 0.000 0.000Dhulikhel Municipality 14236 0.025 0.018 0.003 0.003 0.001 0.001Panauti Municipality 27358 0.038 0.023 0.005 0.004 0.001 0.001Lalitpur Sub-metropolitan city 220040 0.094 0.013 0.018 0.003 0.005 0.001Bhaktapur Municipality 81587 0.272 0.040 0.068 0.013 0.024 0.006Madhyapur Thimi Municipality 82618 0.124 0.022 0.027 0.006 0.009 0.002Kathmandu Metro 973559 0.109 0.009 0.021 0.002 0.007 0.001Kirtipur Municipality 65409 0.127 0.025 0.028 0.007 0.009 0.003Bidur Municipality 26438 0.060 0.022 0.010 0.005 0.003 0.001Hetauda Municipality 83715 0.061 0.012 0.012 0.003 0.004 0.001Gaur Municipality 34684 0.219 0.050 0.051 0.016 0.018 0.006Kalaiya Municipality 42353 0.280 0.077 0.072 0.027 0.027 0.012Birgunj Sub-Metropolitan City 133799 0.142 0.024 0.031 0.007 0.010 0.003Bharatpur Municipality 142598 0.023 0.008 0.003 0.001 0.001 0.000Ratnanagar Municipality 46281 0.085 0.038 0.015 0.009 0.004 0.003Gorkha Municipality 32473 0.079 0.022 0.014 0.005 0.004 0.002Byas Municipality 42899 0.064 0.016 0.013 0.004 0.004 0.001Putalibazar Municipality 30704 0.076 0.020 0.015 0.004 0.004 0.002Waling Municipality 24004 0.068 0.016 0.013 0.004 0.004 0.001Lekhnath Municipality 58811 0.034 0.011 0.006 0.003 0.002 0.001Pokhara Sub-Metropolitan City 255361 0.013 0.005 0.002 0.001 0.001 0.000Baglung Municipality 29360 0.077 0.020 0.014 0.004 0.004 0.002Tansen Municipality 29094 0.067 0.017 0.013 0.004 0.004 0.001Ramgram Municipality 25987 0.245 0.037 0.067 0.014 0.026 0.007Butwal Municipality 118311 0.035 0.011 0.008 0.003 0.003 0.001Siddharthanagar Municipality 63390 0.097 0.018 0.025 0.006 0.010 0.003NEPAL <strong>Small</strong> <strong>Area</strong> <strong>Estimation</strong> <strong>of</strong> <strong>Poverty</strong>, 2011, Summary and Major Findings 19
A 2: SAE <strong>Poverty</strong> Rates at the Target level (Municipality); Average and Standard ErrorMunicipality Name Population FGT(0) S.E. FGT(0) FGT(1) S.E. FGT(1) FGT(2) S.E. FGT(2)Kapilvastu Municipality 30410 0.319 0.042 0.090 0.017 0.036 0.008Ghorahi Municipality 62923 0.158 0.052 0.037 0.016 0.013 0.006Tulsipur Municipality 51537 0.192 0.059 0.046 0.018 0.016 0.008Nepalgunj Municipality 72407 0.097 0.034 0.022 0.009 0.007 0.004Gulariya Municipality 55516 0.496 0.082 0.159 0.041 0.068 0.022Birendranagar Municipality 47914 0.138 0.046 0.033 0.014 0.011 0.005Narayan Municipality 21069 0.377 0.081 0.105 0.032 0.041 0.015Dipayal Silgadhi Municipality 23401 0.387 0.088 0.107 0.034 0.041 0.016Dhangadhi Municipality 101887 0.228 0.063 0.058 0.021 0.021 0.009Tikapur Municipality 56089 0.339 0.084 0.089 0.030 0.033 0.014Bhimdatta Municipality 104544 0.241 0.062 0.065 0.022 0.025 0.010Amargadhi Municipality 21221 0.392 0.091 0.110 0.035 0.043 0.017Dasharathchanda Municipality 16791 0.303 0.084 0.075 0.028 0.027 0.012A 3: SAE <strong>Poverty</strong> Rates at the Ilaka level; Average and Standard ErrorDistrict Ilaka code DDII Population FGT(0) S.E. FGT(0) FGT(1) S.E. FGT(1) FGT(2) S.E. FGT(2)Taplejung 101 6310 0.249 0.057 0.050 0.016 0.015 0.006Taplejung 102 4023 0.286 0.075 0.057 0.021 0.017 0.008Taplejung 103 8325 0.269 0.060 0.053 0.016 0.016 0.006Taplejung 104 11514 0.265 0.053 0.053 0.014 0.016 0.005Taplejung 105 12627 0.288 0.057 0.058 0.016 0.017 0.006Taplejung 106 27273 0.163 0.040 0.030 0.009 0.009 0.003Taplejung 107 8996 0.337 0.064 0.073 0.019 0.023 0.008Taplejung 108 5936 0.234 0.054 0.045 0.014 0.013 0.005Taplejung 109 9992 0.293 0.056 0.060 0.016 0.018 0.006Taplejung 110 13876 0.370 0.060 0.083 0.019 0.027 0.008Taplejung 111 17532 0.314 0.057 0.066 0.017 0.020 0.006Panchthar 201 14140 0.091 0.032 0.014 0.006 0.004 0.002Panchthar 202 20159 0.126 0.033 0.020 0.007 0.005 0.002Panchthar 203 18902 0.103 0.030 0.016 0.006 0.004 0.002Panchthar 204 17899 0.107 0.034 0.017 0.007 0.004 0.002Panchthar 205 31269 0.058 0.022 0.009 0.005 0.002 0.001Panchthar 206 13947 0.145 0.042 0.024 0.009 0.006 0.003Panchthar 207 19927 0.112 0.032 0.018 0.007 0.005 0.002Panchthar 208 16118 0.162 0.044 0.028 0.010 0.007 0.003Panchthar 209 13419 0.183 0.049 0.032 0.012 0.009 0.004Panchthar 210 13432 0.125 0.034 0.022 0.008 0.006 0.003Panchthar 211 11182 0.110 0.037 0.018 0.007 0.004 0.002Ilam 301 11310 0.058 0.022 0.009 0.004 0.002 0.001Ilam 302 21506 0.062 0.019 0.010 0.004 0.002 0.001Ilam 303 36053 0.032 0.010 0.004 0.002 0.001 0.000Ilam 304 42389 0.072 0.019 0.011 0.004 0.003 0.001Ilam 305 19130 0.065 0.022 0.010 0.004 0.003 0.001Ilam 306 18854 0.102 0.027 0.017 0.006 0.005 0.002Ilam 307 21320 0.079 0.023 0.013 0.005 0.003 0.00120 NEPAL <strong>Small</strong> <strong>Area</strong> <strong>Estimation</strong> <strong>of</strong> <strong>Poverty</strong>, 2011, Summary and Major Findings
A 3: SAE <strong>Poverty</strong> Rates at the Ilaka level; Average and Standard ErrorDistrict Ilaka code DDII Population FGT(0) S.E. FGT(0) FGT(1) S.E. FGT(1) FGT(2) S.E. FGT(2)Ilam 308 17175 0.056 0.020 0.008 0.004 0.002 0.001Ilam 309 15964 0.057 0.018 0.009 0.003 0.002 0.001Ilam 310 24247 0.080 0.020 0.013 0.004 0.003 0.001Ilam 311 41233 0.099 0.030 0.017 0.006 0.004 0.002Ilam 312 18553 0.113 0.034 0.022 0.008 0.007 0.003Jhapa 401 32054 0.132 0.031 0.024 0.007 0.007 0.003Jhapa 402 36797 0.120 0.028 0.019 0.006 0.005 0.002Jhapa 403 21056 0.124 0.050 0.019 0.010 0.005 0.003Jhapa 404 64171 0.033 0.016 0.005 0.003 0.001 0.001Jhapa 405 45162 0.045 0.017 0.006 0.003 0.001 0.001Jhapa 406 56548 0.051 0.020 0.007 0.003 0.002 0.001Jhapa 407 39435 0.054 0.018 0.008 0.003 0.002 0.001Jhapa 408 33675 0.075 0.033 0.012 0.006 0.003 0.002Jhapa 409 32870 0.198 0.054 0.037 0.013 0.011 0.005Jhapa 410 37870 0.055 0.021 0.008 0.004 0.002 0.001Jhapa 411 62030 0.153 0.030 0.029 0.008 0.009 0.003Jhapa 412 40250 0.051 0.024 0.007 0.004 0.002 0.001Jhapa 413 31200 0.128 0.037 0.022 0.008 0.006 0.002Jhapa 414 29585 0.074 0.032 0.012 0.006 0.003 0.002Jhapa 415 36487 0.207 0.045 0.040 0.012 0.012 0.004Jhapa 416 37064 0.090 0.029 0.015 0.006 0.004 0.002Jhapa 417 20403 0.045 0.028 0.006 0.005 0.001 0.001Jhapa 418 18120 0.135 0.039 0.026 0.010 0.007 0.003Jhapa 419 75019 0.126 0.032 0.023 0.008 0.006 0.003Jhapa 420 57512 0.222 0.061 0.045 0.017 0.014 0.006Morang 501 54379 0.192 0.034 0.037 0.009 0.011 0.003Morang 502 58465 0.189 0.039 0.037 0.010 0.011 0.003Morang 503 49962 0.156 0.043 0.029 0.010 0.008 0.003Morang 504 72672 0.054 0.020 0.008 0.004 0.002 0.001Morang 505 42337 0.137 0.030 0.024 0.007 0.007 0.002Morang 506 50210 0.162 0.033 0.029 0.008 0.008 0.003Morang 507 49635 0.239 0.039 0.049 0.011 0.015 0.004Morang 508 32552 0.236 0.043 0.047 0.011 0.014 0.004Morang 509 75389 0.106 0.026 0.018 0.006 0.005 0.002Morang 510 34148 0.194 0.041 0.036 0.010 0.010 0.003Morang 511 80426 0.081 0.020 0.013 0.004 0.003 0.001Morang 512 20172 0.276 0.062 0.057 0.018 0.017 0.007Morang 513 24388 0.247 0.060 0.051 0.016 0.015 0.006Morang 514 38172 0.303 0.059 0.065 0.017 0.021 0.007Morang 515 11023 0.220 0.058 0.047 0.017 0.015 0.006Morang 516 22538 0.132 0.032 0.024 0.007 0.007 0.002Morang 517 41515 0.161 0.035 0.031 0.009 0.009 0.003Morang 518 200596 0.175 0.019 0.039 0.006 0.013 0.002Sunsari 601 16893 0.047 0.024 0.006 0.004 0.001 0.001Sunsari 602 4623 0.113 0.063 0.018 0.012 0.004 0.004Sunsari 603 36123 0.086 0.031 0.015 0.007 0.004 0.002NEPAL <strong>Small</strong> <strong>Area</strong> <strong>Estimation</strong> <strong>of</strong> <strong>Poverty</strong>, 2011, Summary and Major Findings 21
A 3: SAE <strong>Poverty</strong> Rates at the Ilaka level; Average and Standard ErrorDistrict Ilaka code DDII Population FGT(0) S.E. FGT(0) FGT(1) S.E. FGT(1) FGT(2) S.E. FGT(2)Sunsari 604 33363 0.084 0.030 0.013 0.006 0.003 0.002Sunsari 605 45588 0.043 0.014 0.006 0.002 0.002 0.001Sunsari 606 30564 0.133 0.034 0.025 0.008 0.007 0.003Sunsari 607 42982 0.128 0.035 0.024 0.008 0.007 0.003Sunsari 608 31153 0.169 0.039 0.032 0.009 0.009 0.003Sunsari 609 55356 0.073 0.018 0.012 0.004 0.003 0.001Sunsari 610 21171 0.154 0.043 0.028 0.010 0.008 0.003Sunsari 611 30517 0.184 0.047 0.035 0.012 0.010 0.004Sunsari 612 26000 0.165 0.041 0.030 0.010 0.008 0.003Sunsari 613 57642 0.197 0.047 0.038 0.012 0.011 0.004Sunsari 614 43544 0.229 0.050 0.045 0.013 0.013 0.005Sunsari 615 57364 0.233 0.052 0.046 0.014 0.014 0.005Sunsari 616 115157 0.038 0.009 0.006 0.002 0.001 0.001Sunsari 617 28215 0.168 0.040 0.036 0.011 0.011 0.004Sunsari 618 74064 0.066 0.018 0.012 0.004 0.003 0.001Dhankuta 701 11081 0.219 0.047 0.042 0.013 0.012 0.005Dhankuta 702 8202 0.171 0.046 0.031 0.011 0.009 0.004Dhankuta 703 10484 0.191 0.046 0.035 0.011 0.010 0.004Dhankuta 704 11049 0.152 0.046 0.027 0.011 0.007 0.003Dhankuta 705 14845 0.223 0.066 0.041 0.017 0.012 0.006Dhankuta 706 5847 0.158 0.070 0.027 0.015 0.007 0.005Dhankuta 707 12152 0.204 0.053 0.038 0.014 0.011 0.005Dhankuta 708 17645 0.124 0.026 0.021 0.006 0.006 0.002Dhankuta 709 13837 0.158 0.036 0.029 0.009 0.008 0.003Dhankuta 710 17747 0.130 0.032 0.022 0.007 0.006 0.002Dhankuta 711 12018 0.173 0.050 0.031 0.012 0.008 0.004Dhankuta 712 26381 0.103 0.034 0.020 0.008 0.006 0.003Terhathum 801 10217 0.069 0.026 0.011 0.005 0.003 0.002Terhathum 802 9415 0.085 0.027 0.014 0.005 0.003 0.002Terhathum 803 7908 0.131 0.046 0.022 0.010 0.006 0.003Terhathum 804 9026 0.083 0.030 0.014 0.006 0.003 0.002Terhathum 805 8897 0.174 0.049 0.030 0.011 0.008 0.004Terhathum 806 7817 0.155 0.048 0.027 0.011 0.007 0.004Terhathum 807 8078 0.126 0.038 0.021 0.008 0.006 0.003Terhathum 808 12606 0.193 0.051 0.034 0.012 0.009 0.004Terhathum 809 8112 0.157 0.043 0.027 0.010 0.007 0.003Terhathum 810 9064 0.198 0.057 0.035 0.013 0.010 0.004Terhathum 811 9665 0.217 0.055 0.040 0.014 0.011 0.005Sankhuwasabha 901 8187 0.206 0.066 0.038 0.017 0.011 0.006Sankhuwasabha 902 13156 0.304 0.067 0.063 0.019 0.019 0.007Sankhuwasabha 903 10611 0.271 0.063 0.053 0.017 0.015 0.006Sankhuwasabha 904 11941 0.225 0.062 0.042 0.015 0.012 0.005Sankhuwasabha 905 10492 0.325 0.075 0.070 0.023 0.022 0.009Sankhuwasabha 906 26219 0.046 0.016 0.006 0.003 0.001 0.001Sankhuwasabha 907 17521 0.284 0.068 0.057 0.018 0.017 0.007Sankhuwasabha 908 11774 0.224 0.053 0.042 0.013 0.012 0.00522 NEPAL <strong>Small</strong> <strong>Area</strong> <strong>Estimation</strong> <strong>of</strong> <strong>Poverty</strong>, 2011, Summary and Major Findings
A 3: SAE <strong>Poverty</strong> Rates at the Ilaka level; Average and Standard ErrorDistrict Ilaka code DDII Population FGT(0) S.E. FGT(0) FGT(1) S.E. FGT(1) FGT(2) S.E. FGT(2)Sankhuwasabha 909 14451 0.166 0.048 0.031 0.011 0.009 0.004Sankhuwasabha 910 17055 0.280 0.058 0.056 0.016 0.016 0.006Sankhuwasabha 911 16732 0.150 0.042 0.026 0.009 0.007 0.003Bhojpur 1001 13111 0.313 0.062 0.065 0.018 0.020 0.007Bhojpur 1002 13591 0.221 0.044 0.042 0.011 0.012 0.004Bhojpur 1003 21726 0.264 0.047 0.052 0.013 0.015 0.005Bhojpur 1004 14829 0.258 0.050 0.051 0.014 0.015 0.005Bhojpur 1005 10949 0.203 0.047 0.038 0.012 0.011 0.004Bhojpur 1006 9937 0.286 0.063 0.056 0.017 0.016 0.006Bhojpur 1007 16083 0.095 0.026 0.016 0.006 0.004 0.002Bhojpur 1008 9917 0.164 0.039 0.030 0.009 0.008 0.003Bhojpur 1009 10493 0.192 0.047 0.035 0.012 0.010 0.004Bhojpur 1010 11948 0.268 0.054 0.053 0.014 0.015 0.005Bhojpur 1011 12916 0.314 0.052 0.064 0.015 0.019 0.006Bhojpur 1012 20403 0.256 0.050 0.050 0.014 0.015 0.005Bhojpur 1013 15300 0.320 0.054 0.066 0.015 0.020 0.006Solukhumbu 1101 11374 0.117 0.038 0.021 0.008 0.006 0.003Solukhumbu 1102 10484 0.097 0.032 0.017 0.007 0.005 0.002Solukhumbu 1103 14505 0.285 0.052 0.063 0.016 0.020 0.006Solukhumbu 1104 18365 0.412 0.057 0.104 0.021 0.037 0.009Solukhumbu 1105 10901 0.374 0.060 0.088 0.020 0.029 0.008Solukhumbu 1106 10816 0.273 0.058 0.059 0.017 0.019 0.007Solukhumbu 1107 16127 0.232 0.049 0.049 0.014 0.015 0.005Solukhumbu 1108 6974 0.141 0.044 0.025 0.010 0.007 0.003Solukhumbu 1109 5534 0.211 0.056 0.042 0.014 0.012 0.005Okhaldhunga 1201 12197 0.251 0.048 0.051 0.013 0.015 0.005Okhaldhunga 1202 10770 0.246 0.053 0.052 0.016 0.016 0.006Okhaldhunga 1203 13954 0.108 0.027 0.019 0.006 0.005 0.002Okhaldhunga 1204 12462 0.150 0.033 0.028 0.008 0.008 0.003Okhaldhunga 1205 9472 0.166 0.042 0.031 0.011 0.009 0.004Okhaldhunga 1206 13250 0.146 0.036 0.026 0.008 0.007 0.003Okhaldhunga 1207 14336 0.169 0.034 0.032 0.008 0.009 0.003Okhaldhunga 1208 18613 0.267 0.043 0.056 0.012 0.017 0.005Okhaldhunga 1209 18548 0.249 0.047 0.051 0.013 0.016 0.005Okhaldhunga 1210 11062 0.244 0.051 0.049 0.014 0.015 0.005Okhaldhunga 1211 12118 0.224 0.042 0.045 0.011 0.013 0.004Khotang 1301 14455 0.236 0.044 0.045 0.011 0.013 0.004Khotang 1302 11398 0.274 0.054 0.054 0.015 0.016 0.006Khotang 1303 12087 0.270 0.052 0.053 0.014 0.015 0.005Khotang 1304 10507 0.242 0.050 0.046 0.013 0.013 0.005Khotang 1305 11597 0.200 0.042 0.037 0.011 0.010 0.004Khotang 1306 15930 0.326 0.058 0.067 0.017 0.020 0.006Khotang 1307 28270 0.112 0.026 0.019 0.006 0.005 0.002Khotang 1308 16897 0.258 0.048 0.051 0.013 0.015 0.005Khotang 1309 18053 0.191 0.037 0.036 0.009 0.010 0.003Khotang 1310 14819 0.267 0.048 0.054 0.014 0.016 0.005NEPAL <strong>Small</strong> <strong>Area</strong> <strong>Estimation</strong> <strong>of</strong> <strong>Poverty</strong>, 2011, Summary and Major Findings 23
A 3: SAE <strong>Poverty</strong> Rates at the Ilaka level; Average and Standard ErrorDistrict Ilaka code DDII Population FGT(0) S.E. FGT(0) FGT(1) S.E. FGT(1) FGT(2) S.E. FGT(2)Siraha 1614 14450 0.416 0.063 0.103 0.024 0.036 0.010Siraha 1615 45270 0.252 0.038 0.053 0.011 0.016 0.004Siraha 1616 43410 0.298 0.043 0.063 0.012 0.020 0.005Siraha 1617 39336 0.341 0.041 0.077 0.013 0.025 0.005Siraha 1618 33562 0.258 0.056 0.058 0.017 0.019 0.007Siraha 1619 28417 0.421 0.069 0.112 0.027 0.041 0.012Dhanusa 1701 33303 0.296 0.040 0.060 0.012 0.018 0.004Dhanusa 1702 52630 0.283 0.039 0.059 0.011 0.018 0.004Dhanusa 1703 42376 0.283 0.038 0.061 0.011 0.019 0.005Dhanusa 1704 32578 0.289 0.046 0.062 0.014 0.019 0.006Dhanusa 1705 30857 0.248 0.036 0.052 0.010 0.016 0.004Dhanusa 1706 47892 0.245 0.043 0.049 0.012 0.015 0.005Dhanusa 1707 34745 0.271 0.049 0.052 0.013 0.015 0.005Dhanusa 1708 62122 0.271 0.043 0.055 0.012 0.017 0.004Dhanusa 1709 39765 0.225 0.036 0.042 0.009 0.012 0.003Dhanusa 1710 44410 0.224 0.033 0.044 0.009 0.013 0.003Dhanusa 1711 25417 0.300 0.051 0.063 0.015 0.019 0.006Dhanusa 1712 29839 0.312 0.054 0.065 0.016 0.020 0.006Dhanusa 1713 13566 0.228 0.064 0.043 0.016 0.012 0.006Dhanusa 1714 17418 0.169 0.050 0.030 0.011 0.008 0.004Dhanusa 1715 45196 0.176 0.032 0.031 0.008 0.009 0.003Dhanusa 1716 56351 0.193 0.037 0.036 0.009 0.010 0.003Dhanusa 1717 46146 0.151 0.037 0.025 0.008 0.007 0.002Dhanusa 1718 97642 0.150 0.029 0.031 0.008 0.010 0.003Mahottari 1801 49503 0.077 0.025 0.014 0.006 0.004 0.002Mahottari 1802 38789 0.174 0.042 0.038 0.012 0.013 0.005Mahottari 1803 36939 0.183 0.041 0.041 0.013 0.014 0.005Mahottari 1804 41471 0.120 0.032 0.025 0.009 0.008 0.003Mahottari 1805 37629 0.146 0.037 0.032 0.011 0.010 0.004Mahottari 1806 16157 0.137 0.039 0.029 0.011 0.009 0.004Mahottari 1807 41174 0.192 0.044 0.043 0.013 0.014 0.006Mahottari 1808 35140 0.165 0.039 0.035 0.011 0.012 0.005Mahottari 1809 42409 0.177 0.039 0.039 0.012 0.013 0.005Mahottari 1810 51140 0.165 0.042 0.034 0.012 0.011 0.005Mahottari 1811 46667 0.142 0.038 0.028 0.010 0.009 0.004Mahottari 1812 36043 0.198 0.049 0.043 0.014 0.014 0.006Mahottari 1813 41897 0.208 0.045 0.046 0.014 0.015 0.006Mahottari 1814 40411 0.159 0.033 0.034 0.010 0.011 0.004Mahottari 1815 42507 0.194 0.038 0.044 0.012 0.015 0.005Mahottari 1816 23147 0.161 0.044 0.037 0.014 0.013 0.006Sarlahi 1901 45608 0.126 0.026 0.025 0.007 0.008 0.003Sarlahi 1902 66320 0.142 0.030 0.026 0.007 0.007 0.002Sarlahi 1903 49401 0.204 0.040 0.041 0.011 0.013 0.004Sarlahi 1904 52694 0.089 0.022 0.016 0.005 0.004 0.002Sarlahi 1905 46555 0.176 0.037 0.035 0.010 0.010 0.003Sarlahi 1906 42034 0.187 0.037 0.037 0.009 0.011 0.003NEPAL <strong>Small</strong> <strong>Area</strong> <strong>Estimation</strong> <strong>of</strong> <strong>Poverty</strong>, 2011, Summary and Major Findings 25
A 3: SAE <strong>Poverty</strong> Rates at the Ilaka level; Average and Standard ErrorDistrict Ilaka code DDII Population FGT(0) S.E. FGT(0) FGT(1) S.E. FGT(1) FGT(2) S.E. FGT(2)Sarlahi 1907 44602 0.156 0.031 0.030 0.007 0.009 0.003Sarlahi 1908 40780 0.170 0.035 0.033 0.009 0.010 0.003Sarlahi 1909 40360 0.199 0.033 0.042 0.009 0.013 0.003Sarlahi 1910 60843 0.127 0.023 0.024 0.005 0.007 0.002Sarlahi 1911 36977 0.180 0.036 0.035 0.009 0.011 0.003Sarlahi 1912 34719 0.239 0.038 0.050 0.011 0.016 0.004Sarlahi 1913 31913 0.203 0.032 0.043 0.009 0.013 0.003Sarlahi 1914 55169 0.209 0.042 0.044 0.012 0.014 0.005Sarlahi 1915 21675 0.289 0.046 0.067 0.015 0.022 0.006Sarlahi 1916 39387 0.250 0.042 0.054 0.012 0.017 0.005Sarlahi 1917 32041 0.229 0.037 0.051 0.011 0.017 0.004Sarlahi 1918 24881 0.131 0.038 0.027 0.010 0.008 0.004Sindhuli 2001 11650 0.582 0.064 0.168 0.031 0.065 0.016Sindhuli 2002 10384 0.499 0.061 0.138 0.026 0.052 0.013Sindhuli 2003 34986 0.385 0.049 0.098 0.017 0.036 0.008Sindhuli 2004 27597 0.374 0.045 0.094 0.017 0.033 0.008Sindhuli 2005 11010 0.606 0.067 0.178 0.033 0.070 0.017Sindhuli 2006 10124 0.360 0.057 0.091 0.022 0.033 0.010Sindhuli 2007 21294 0.378 0.059 0.093 0.021 0.033 0.009Sindhuli 2008 16591 0.258 0.054 0.057 0.016 0.018 0.007Sindhuli 2009 13296 0.376 0.076 0.093 0.027 0.032 0.012Sindhuli 2010 21469 0.381 0.053 0.096 0.019 0.034 0.009Sindhuli 2011 13761 0.547 0.055 0.151 0.024 0.057 0.012Sindhuli 2012 23256 0.383 0.057 0.094 0.020 0.033 0.009Sindhuli 2013 38270 0.443 0.057 0.118 0.023 0.043 0.011Sindhuli 2014 39300 0.187 0.039 0.042 0.011 0.014 0.004Ramechhap 2101 13409 0.176 0.037 0.034 0.009 0.010 0.003Ramechhap 2102 15163 0.247 0.043 0.052 0.012 0.016 0.005Ramechhap 2103 14986 0.212 0.043 0.044 0.011 0.014 0.004Ramechhap 2104 19574 0.235 0.041 0.049 0.011 0.015 0.004Ramechhap 2105 17426 0.325 0.048 0.076 0.016 0.025 0.007Ramechhap 2106 19192 0.276 0.046 0.062 0.014 0.020 0.006Ramechhap 2107 24492 0.222 0.035 0.049 0.011 0.016 0.005Ramechhap 2108 15579 0.280 0.040 0.062 0.012 0.020 0.005Ramechhap 2109 20882 0.227 0.040 0.047 0.011 0.014 0.004Ramechhap 2110 25683 0.279 0.041 0.063 0.013 0.021 0.005Ramechhap 2111 14816 0.334 0.047 0.079 0.016 0.027 0.007Dolakha 2201 8543 0.342 0.054 0.080 0.018 0.027 0.007Dolakha 2202 20635 0.267 0.049 0.058 0.014 0.018 0.005Dolakha 2203 15507 0.232 0.052 0.049 0.015 0.015 0.006Dolakha 2204 12559 0.255 0.054 0.055 0.015 0.017 0.006Dolakha 2205 14046 0.281 0.050 0.063 0.015 0.021 0.006Dolakha 2206 20210 0.346 0.056 0.082 0.019 0.028 0.008Dolakha 2207 17247 0.301 0.052 0.066 0.016 0.021 0.006Dolakha 2208 8962 0.235 0.055 0.048 0.015 0.015 0.006Dolakha 2209 10878 0.264 0.058 0.058 0.017 0.019 0.00726 NEPAL <strong>Small</strong> <strong>Area</strong> <strong>Estimation</strong> <strong>of</strong> <strong>Poverty</strong>, 2011, Summary and Major Findings
A 3: SAE <strong>Poverty</strong> Rates at the Ilaka level; Average and Standard ErrorDistrict Ilaka code DDII Population FGT(0) S.E. FGT(0) FGT(1) S.E. FGT(1) FGT(2) S.E. FGT(2)Dolakha 2210 19512 0.291 0.052 0.063 0.015 0.020 0.006Dolakha 2211 14447 0.297 0.052 0.065 0.015 0.021 0.006Dolakha 2212 22385 0.078 0.020 0.013 0.004 0.004 0.001Sindhupalchok 2301 24419 0.245 0.047 0.052 0.014 0.016 0.005Sindhupalchok 2302 30460 0.172 0.036 0.034 0.009 0.010 0.003Sindhupalchok 2303 13972 0.236 0.044 0.047 0.012 0.014 0.004Sindhupalchok 2304 15127 0.240 0.046 0.049 0.013 0.015 0.005Sindhupalchok 2305 17243 0.223 0.045 0.046 0.012 0.014 0.005Sindhupalchok 2306 23896 0.286 0.044 0.061 0.013 0.019 0.005Sindhupalchok 2307 19231 0.393 0.061 0.091 0.021 0.031 0.009Sindhupalchok 2308 27179 0.201 0.037 0.040 0.010 0.012 0.004Sindhupalchok 2309 30269 0.242 0.049 0.049 0.013 0.015 0.005Sindhupalchok 2310 28437 0.250 0.046 0.053 0.013 0.016 0.005Sindhupalchok 2311 22314 0.318 0.052 0.072 0.017 0.024 0.007Sindhupalchok 2312 12500 0.297 0.055 0.064 0.017 0.020 0.007Sindhupalchok 2313 20605 0.268 0.053 0.056 0.015 0.017 0.006Kavrepalanchok 2401 26396 0.406 0.057 0.085 0.019 0.026 0.007Kavrepalanchok 2402 25103 0.173 0.043 0.029 0.010 0.008 0.003Kavrepalanchok 2403 19668 0.175 0.047 0.029 0.011 0.008 0.004Kavrepalanchok 2404 18557 0.206 0.041 0.036 0.010 0.010 0.003Kavrepalanchok 2405 20422 0.127 0.037 0.020 0.008 0.005 0.002Kavrepalanchok 2406 23812 0.214 0.044 0.038 0.011 0.010 0.004Kavrepalanchok 2407 15998 0.421 0.059 0.095 0.021 0.030 0.009Kavrepalanchok 2408 18649 0.074 0.026 0.010 0.005 0.002 0.001Kavrepalanchok 2409 15054 0.071 0.034 0.010 0.006 0.002 0.002Kavrepalanchok 2410 16479 0.020 0.012 0.002 0.002 0.001 0.000Kavrepalanchok 2411 25195 0.086 0.030 0.013 0.006 0.003 0.002Kavrepalanchok 2412 30889 0.071 0.025 0.010 0.005 0.002 0.001Kavrepalanchok 2413 24647 0.090 0.029 0.013 0.005 0.003 0.002Kavrepalanchok 2414 13039 0.202 0.042 0.037 0.011 0.010 0.004Kavrepalanchok 2415 14866 0.108 0.032 0.016 0.006 0.004 0.002Kavrepalanchok 2416 24672 0.013 0.009 0.002 0.001 0.000 0.000Kavrepalanchok 2417 14236 0.025 0.018 0.003 0.003 0.001 0.001Kavrepalanchok 2418 27358 0.038 0.023 0.005 0.004 0.001 0.001Lalitpur 2501 29213 0.011 0.006 0.002 0.001 0.000 0.000Lalitpur 2502 10774 0.017 0.010 0.003 0.002 0.001 0.001Lalitpur 2503 22030 0.010 0.006 0.001 0.001 0.000 0.000Lalitpur 2504 18726 0.016 0.008 0.002 0.001 0.001 0.000Lalitpur 2505 26443 0.005 0.005 0.001 0.001 0.000 0.000Lalitpur 2506 6114 0.017 0.009 0.002 0.002 0.001 0.000Lalitpur 2507 9888 0.008 0.007 0.001 0.001 0.000 0.000Lalitpur 2508 18380 0.027 0.012 0.005 0.002 0.001 0.001Lalitpur 2509 24616 0.035 0.011 0.006 0.002 0.002 0.001Lalitpur 2510 36547 0.092 0.019 0.018 0.005 0.005 0.002Lalitpur 2511 12931 0.218 0.035 0.046 0.010 0.014 0.004Lalitpur 2512 8044 0.251 0.043 0.058 0.014 0.020 0.006NEPAL <strong>Small</strong> <strong>Area</strong> <strong>Estimation</strong> <strong>of</strong> <strong>Poverty</strong>, 2011, Summary and Major Findings 27
A 3: SAE <strong>Poverty</strong> Rates at the Ilaka level; Average and Standard ErrorDistrict Ilaka code DDII Population FGT(0) S.E. FGT(0) FGT(1) S.E. FGT(1) FGT(2) S.E. FGT(2)Lalitpur 2513 9720 0.319 0.043 0.078 0.014 0.028 0.006Lalitpur 2514 220040 0.094 0.013 0.018 0.003 0.005 0.001Bhaktapur 2601 81587 0.272 0.040 0.068 0.013 0.024 0.006Bhaktapur 2602 18008 0.025 0.012 0.004 0.002 0.001 0.001Bhaktapur 2603 14307 0.058 0.021 0.010 0.004 0.003 0.001Bhaktapur 2604 9930 0.084 0.028 0.016 0.006 0.004 0.002Bhaktapur 2605 12927 0.058 0.023 0.010 0.005 0.003 0.002Bhaktapur 2606 11077 0.041 0.018 0.007 0.004 0.002 0.001Bhaktapur 2607 9828 0.030 0.017 0.005 0.003 0.001 0.001Bhaktapur 2608 19041 0.008 0.005 0.001 0.001 0.000 0.000Bhaktapur 2609 21916 0.026 0.011 0.004 0.002 0.001 0.001Bhaktapur 2610 15466 0.011 0.008 0.002 0.001 0.000 0.000Bhaktapur 2611 82618 0.124 0.022 0.027 0.006 0.009 0.002Kathmandu 2701 25258 0.114 0.025 0.023 0.007 0.007 0.003Kathmandu 2702 100879 0.020 0.009 0.003 0.001 0.001 0.000Kathmandu 2703 28081 0.041 0.011 0.007 0.002 0.002 0.001Kathmandu 2704 54603 0.009 0.004 0.001 0.001 0.000 0.000Kathmandu 2705 51651 0.011 0.007 0.002 0.001 0.000 0.000Kathmandu 2706 36494 0.012 0.006 0.002 0.001 0.000 0.000Kathmandu 2707 7997 0.032 0.017 0.005 0.003 0.001 0.001Kathmandu 2708 35681 0.012 0.008 0.002 0.001 0.000 0.000Kathmandu 2709 53932 0.024 0.018 0.004 0.003 0.001 0.001Kathmandu 2710 64682 0.020 0.007 0.003 0.001 0.001 0.000Kathmandu 2711 68402 0.012 0.004 0.002 0.001 0.001 0.000Kathmandu 2712 25542 0.028 0.009 0.005 0.002 0.001 0.001Kathmandu 2713 3812 0.013 0.011 0.002 0.002 0.001 0.001Kathmandu 2714 68133 0.013 0.005 0.002 0.001 0.001 0.000Kathmandu 2715 24016 0.064 0.016 0.012 0.004 0.003 0.001Kathmandu 2716 973559 0.109 0.009 0.021 0.002 0.007 0.001Kathmandu 2717 65409 0.127 0.025 0.028 0.007 0.009 0.003Nuwakot 2801 12629 0.257 0.045 0.055 0.013 0.017 0.005Nuwakot 2802 17697 0.199 0.037 0.040 0.010 0.012 0.003Nuwakot 2803 31221 0.222 0.042 0.045 0.011 0.014 0.004Nuwakot 2804 34162 0.205 0.040 0.041 0.010 0.012 0.004Nuwakot 2805 14345 0.211 0.043 0.042 0.011 0.012 0.004Nuwakot 2806 17222 0.168 0.038 0.032 0.009 0.009 0.003Nuwakot 2807 13516 0.206 0.041 0.040 0.011 0.012 0.004Nuwakot 2808 20181 0.112 0.030 0.020 0.007 0.005 0.002Nuwakot 2809 24775 0.174 0.033 0.035 0.009 0.010 0.003Nuwakot 2810 20163 0.242 0.040 0.052 0.012 0.017 0.005Nuwakot 2811 13915 0.221 0.045 0.045 0.012 0.014 0.004Nuwakot 2812 14991 0.338 0.053 0.080 0.018 0.028 0.008Nuwakot 2813 14089 0.383 0.059 0.088 0.020 0.029 0.008Nuwakot 2814 26438 0.060 0.022 0.010 0.005 0.003 0.001Rasuwa 2901 4908 0.284 0.070 0.063 0.022 0.020 0.009Rasuwa 2902 7836 0.534 0.090 0.140 0.038 0.050 0.01828 NEPAL <strong>Small</strong> <strong>Area</strong> <strong>Estimation</strong> <strong>of</strong> <strong>Poverty</strong>, 2011, Summary and Major Findings
A 3: SAE <strong>Poverty</strong> Rates at the Ilaka level; Average and Standard ErrorDistrict Ilaka code DDII Population FGT(0) S.E. FGT(0) FGT(1) S.E. FGT(1) FGT(2) S.E. FGT(2)Rasuwa 2903 10496 0.263 0.073 0.054 0.021 0.016 0.008Rasuwa 2904 6790 0.276 0.068 0.063 0.021 0.021 0.009Rasuwa 2905 3542 0.345 0.082 0.077 0.027 0.025 0.011Rasuwa 2906 3183 0.272 0.070 0.053 0.018 0.016 0.007Rasuwa 2907 1291 0.270 0.080 0.056 0.023 0.017 0.009Rasuwa 2908 837 0.197 0.065 0.038 0.016 0.011 0.006Rasuwa 2909 3242 0.155 0.055 0.029 0.013 0.008 0.004Dhading 3001 16232 0.229 0.048 0.044 0.013 0.013 0.004Dhading 3002 16346 0.257 0.049 0.052 0.014 0.015 0.005Dhading 3003 14692 0.201 0.043 0.039 0.011 0.011 0.004Dhading 3004 19778 0.160 0.038 0.030 0.009 0.009 0.003Dhading 3005 17632 0.184 0.046 0.034 0.011 0.010 0.004Dhading 3006 22011 0.155 0.034 0.029 0.008 0.008 0.003Dhading 3007 39694 0.111 0.029 0.020 0.007 0.006 0.002Dhading 3008 26047 0.181 0.040 0.034 0.010 0.010 0.003Dhading 3009 32931 0.197 0.038 0.039 0.010 0.012 0.003Dhading 3010 31011 0.121 0.034 0.021 0.007 0.006 0.002Dhading 3011 25763 0.176 0.047 0.034 0.012 0.010 0.004Dhading 3012 40402 0.192 0.035 0.039 0.009 0.012 0.003Dhading 3013 31439 0.328 0.040 0.083 0.016 0.030 0.007Makwanpur 3101 36438 0.457 0.061 0.123 0.024 0.046 0.011Makwanpur 3102 33673 0.405 0.063 0.105 0.023 0.038 0.010Makwanpur 3103 33963 0.135 0.031 0.026 0.008 0.008 0.003Makwanpur 3104 25319 0.334 0.054 0.083 0.018 0.029 0.008Makwanpur 3105 14405 0.728 0.054 0.265 0.036 0.123 0.023Makwanpur 3106 28356 0.327 0.055 0.088 0.019 0.033 0.009Makwanpur 3107 17084 0.110 0.048 0.020 0.011 0.006 0.003Makwanpur 3108 35519 0.260 0.058 0.061 0.019 0.021 0.008Makwanpur 3109 20591 0.475 0.058 0.129 0.023 0.048 0.011Makwanpur 3110 28719 0.200 0.038 0.041 0.011 0.013 0.004Makwanpur 3111 24403 0.512 0.049 0.151 0.024 0.060 0.012Makwanpur 3112 13465 0.286 0.044 0.071 0.015 0.026 0.007Makwanpur 3113 18826 0.230 0.040 0.049 0.011 0.016 0.004Makwanpur 3114 83715 0.061 0.012 0.012 0.003 0.004 0.001Rautahat 3201 12494 0.340 0.050 0.090 0.019 0.034 0.009Rautahat 3202 39024 0.401 0.034 0.109 0.014 0.042 0.006Rautahat 3203 33673 0.340 0.036 0.087 0.013 0.032 0.006Rautahat 3204 32316 0.324 0.037 0.079 0.013 0.028 0.005Rautahat 3205 45689 0.358 0.040 0.090 0.014 0.032 0.006Rautahat 3206 40245 0.407 0.056 0.106 0.022 0.039 0.010Rautahat 3207 42293 0.332 0.041 0.081 0.014 0.029 0.006Rautahat 3208 44255 0.389 0.038 0.100 0.014 0.037 0.006Rautahat 3209 38368 0.370 0.041 0.092 0.015 0.033 0.006Rautahat 3210 55224 0.275 0.034 0.061 0.010 0.020 0.004Rautahat 3211 41437 0.393 0.045 0.099 0.016 0.036 0.007Rautahat 3212 42358 0.375 0.043 0.092 0.015 0.033 0.007NEPAL <strong>Small</strong> <strong>Area</strong> <strong>Estimation</strong> <strong>of</strong> <strong>Poverty</strong>, 2011, Summary and Major Findings 29
A 3: SAE <strong>Poverty</strong> Rates at the Ilaka level; Average and Standard ErrorDistrict Ilaka code DDII Population FGT(0) S.E. FGT(0) FGT(1) S.E. FGT(1) FGT(2) S.E. FGT(2)Rautahat 3213 52280 0.361 0.035 0.092 0.013 0.033 0.006Rautahat 3214 54441 0.364 0.042 0.089 0.014 0.031 0.006Rautahat 3215 71878 0.186 0.029 0.039 0.008 0.012 0.003Rautahat 3216 34684 0.219 0.050 0.051 0.016 0.018 0.006Bara 3301 61121 0.191 0.027 0.040 0.008 0.012 0.003Bara 3302 45657 0.366 0.035 0.092 0.012 0.033 0.006Bara 3303 55870 0.379 0.041 0.095 0.015 0.034 0.006Bara 3304 41772 0.306 0.044 0.069 0.014 0.023 0.006Bara 3305 42467 0.299 0.039 0.069 0.013 0.023 0.005Bara 3306 36506 0.368 0.039 0.093 0.014 0.034 0.006Bara 3307 26427 0.361 0.042 0.090 0.015 0.032 0.007Bara 3308 53857 0.226 0.039 0.049 0.011 0.016 0.004Bara 3309 13685 0.312 0.069 0.072 0.022 0.024 0.009Bara 3310 22836 0.320 0.042 0.079 0.014 0.028 0.006Bara 3311 27379 0.368 0.046 0.094 0.017 0.034 0.007Bara 3312 91811 0.209 0.027 0.046 0.008 0.015 0.003Bara 3313 45764 0.307 0.038 0.072 0.012 0.025 0.005Bara 3314 33759 0.335 0.043 0.080 0.014 0.028 0.006Bara 3315 38830 0.390 0.040 0.100 0.015 0.036 0.007Bara 3316 42353 0.280 0.077 0.072 0.027 0.027 0.012Parsa 3401 133799 0.142 0.024 0.031 0.007 0.010 0.003Parsa 3402 35079 0.264 0.038 0.060 0.012 0.020 0.005Parsa 3403 29599 0.234 0.046 0.050 0.013 0.016 0.005Parsa 3404 28545 0.355 0.039 0.088 0.014 0.031 0.006Parsa 3405 29795 0.325 0.049 0.077 0.015 0.026 0.006Parsa 3406 36825 0.366 0.046 0.093 0.017 0.033 0.007Parsa 3407 46409 0.323 0.044 0.077 0.015 0.026 0.006Parsa 3408 32331 0.337 0.039 0.085 0.013 0.031 0.006Parsa 3409 42393 0.357 0.041 0.090 0.015 0.032 0.006Parsa 3410 27057 0.356 0.043 0.090 0.015 0.032 0.007Parsa 3411 38005 0.327 0.042 0.078 0.014 0.027 0.006Parsa 3412 31371 0.401 0.043 0.107 0.017 0.040 0.008Parsa 3413 20356 0.358 0.044 0.091 0.016 0.033 0.007Parsa 3414 29766 0.362 0.042 0.092 0.015 0.033 0.007Parsa 3415 30778 0.335 0.051 0.080 0.017 0.028 0.007Chitawan 3501 15424 0.518 0.078 0.132 0.031 0.046 0.014Chitawan 3502 63241 0.071 0.022 0.011 0.005 0.003 0.001Chitawan 3503 39272 0.035 0.013 0.005 0.002 0.001 0.001Chitawan 3504 38331 0.063 0.023 0.010 0.004 0.002 0.001Chitawan 3505 29320 0.186 0.038 0.037 0.011 0.011 0.004Chitawan 3506 25173 0.253 0.047 0.053 0.015 0.017 0.006Chitawan 3507 142598 0.023 0.008 0.003 0.001 0.001 0.000Chitawan 3508 11494 0.024 0.016 0.003 0.003 0.001 0.001Chitawan 3509 30534 0.031 0.020 0.004 0.004 0.001 0.001Chitawan 3510 37536 0.088 0.033 0.014 0.007 0.004 0.002Chitawan 3511 31886 0.045 0.018 0.007 0.003 0.002 0.00130 NEPAL <strong>Small</strong> <strong>Area</strong> <strong>Estimation</strong> <strong>of</strong> <strong>Poverty</strong>, 2011, Summary and Major Findings
A 3: SAE <strong>Poverty</strong> Rates at the Ilaka level; Average and Standard ErrorDistrict Ilaka code DDII Population FGT(0) S.E. FGT(0) FGT(1) S.E. FGT(1) FGT(2) S.E. FGT(2)Chitawan 3512 19222 0.089 0.037 0.014 0.007 0.003 0.002Chitawan 3513 37680 0.199 0.044 0.039 0.012 0.011 0.004Chitawan 3514 46281 0.085 0.038 0.015 0.009 0.004 0.003Gorkha 3601 6789 0.125 0.035 0.023 0.008 0.007 0.003Gorkha 3602 22261 0.110 0.033 0.019 0.007 0.005 0.002Gorkha 3603 20547 0.163 0.037 0.032 0.009 0.010 0.003Gorkha 3604 21180 0.171 0.041 0.033 0.010 0.010 0.003Gorkha 3605 26323 0.125 0.035 0.023 0.008 0.007 0.003Gorkha 3606 26708 0.122 0.033 0.022 0.007 0.006 0.002Gorkha 3607 14285 0.189 0.044 0.037 0.011 0.011 0.004Gorkha 3608 15368 0.278 0.052 0.064 0.016 0.022 0.006Gorkha 3609 20748 0.347 0.057 0.086 0.019 0.031 0.008Gorkha 3610 18218 0.127 0.035 0.022 0.008 0.006 0.002Gorkha 3611 23876 0.260 0.047 0.062 0.014 0.022 0.006Gorkha 3612 13193 0.632 0.050 0.210 0.027 0.092 0.015Gorkha 3613 6901 0.716 0.047 0.263 0.030 0.123 0.018Gorkha 3614 32473 0.076 0.021 0.014 0.005 0.004 0.002Lamjung 3701 29100 0.064 0.016 0.013 0.004 0.004 0.001Lamjung 3702 8175 0.198 0.038 0.046 0.011 0.016 0.005Lamjung 3703 22364 0.064 0.017 0.012 0.004 0.003 0.001Lamjung 3704 10852 0.110 0.028 0.021 0.007 0.007 0.002Lamjung 3705 10524 0.127 0.031 0.025 0.008 0.007 0.003Lamjung 3706 10363 0.194 0.040 0.042 0.011 0.014 0.004Lamjung 3707 18759 0.314 0.048 0.080 0.016 0.029 0.007Lamjung 3708 16196 0.278 0.043 0.074 0.015 0.029 0.007Lamjung 3709 10315 0.213 0.044 0.048 0.013 0.016 0.005Lamjung 3710 12714 0.259 0.046 0.060 0.013 0.021 0.005Lamjung 3711 16788 0.141 0.036 0.028 0.009 0.009 0.003Tanahu 3801 8749 0.213 0.042 0.048 0.012 0.017 0.005Tanahu 3802 14010 0.148 0.035 0.031 0.009 0.010 0.003Tanahu 3803 18702 0.112 0.029 0.021 0.007 0.006 0.002Tanahu 3804 38503 0.120 0.026 0.025 0.007 0.008 0.002Tanahu 3805 23909 0.167 0.028 0.041 0.009 0.015 0.004Tanahu 3806 18079 0.259 0.046 0.061 0.014 0.021 0.006Tanahu 3807 16725 0.297 0.050 0.073 0.016 0.027 0.007Tanahu 3808 16731 0.278 0.048 0.067 0.015 0.024 0.007Tanahu 3809 19255 0.244 0.047 0.055 0.014 0.019 0.005Tanahu 3810 21891 0.162 0.032 0.035 0.009 0.012 0.003Tanahu 3811 34886 0.086 0.021 0.017 0.005 0.005 0.002Tanahu 3812 26234 0.107 0.026 0.021 0.006 0.007 0.002Tanahu 3813 19944 0.132 0.030 0.027 0.008 0.009 0.003Tanahu 3814 42899 0.065 0.015 0.013 0.004 0.004 0.001Syangja 3901 10025 0.108 0.026 0.022 0.006 0.007 0.002Syangja 3902 6329 0.135 0.031 0.028 0.008 0.009 0.003Syangja 3903 16566 0.146 0.034 0.030 0.009 0.010 0.003Syangja 3904 19660 0.114 0.025 0.023 0.006 0.007 0.002NEPAL <strong>Small</strong> <strong>Area</strong> <strong>Estimation</strong> <strong>of</strong> <strong>Poverty</strong>, 2011, Summary and Major Findings 31
A 3: SAE <strong>Poverty</strong> Rates at the Ilaka level; Average and Standard ErrorDistrict Ilaka code DDII Population FGT(0) S.E. FGT(0) FGT(1) S.E. FGT(1) FGT(2) S.E. FGT(2)Syangja 3905 10631 0.095 0.027 0.018 0.006 0.005 0.002Syangja 3906 13670 0.149 0.037 0.030 0.009 0.009 0.003Syangja 3907 10417 0.107 0.027 0.021 0.006 0.006 0.002Syangja 3908 14715 0.077 0.023 0.014 0.005 0.004 0.002Syangja 3909 13289 0.165 0.037 0.034 0.010 0.011 0.004Syangja 3910 11330 0.181 0.039 0.038 0.010 0.012 0.004Syangja 3911 10896 0.131 0.030 0.026 0.007 0.008 0.003Syangja 3912 18962 0.191 0.041 0.041 0.011 0.013 0.004Syangja 3913 27901 0.144 0.032 0.030 0.008 0.009 0.003Syangja 3914 23139 0.108 0.026 0.021 0.006 0.006 0.002Syangja 3915 25855 0.100 0.024 0.020 0.006 0.006 0.002Syangja 3916 30704 0.075 0.020 0.014 0.004 0.004 0.002Syangja 3917 23998 0.069 0.018 0.014 0.004 0.004 0.001Kaski 4001 11641 0.069 0.021 0.013 0.005 0.004 0.002Kaski 4002 9806 0.060 0.019 0.011 0.004 0.003 0.002Kaski 4003 10104 0.111 0.029 0.023 0.008 0.007 0.003Kaski 4004 6873 0.063 0.020 0.012 0.005 0.004 0.002Kaski 4005 8781 0.147 0.034 0.032 0.009 0.011 0.004Kaski 4006 16481 0.054 0.018 0.010 0.004 0.003 0.001Kaski 4007 3923 0.047 0.017 0.009 0.004 0.003 0.001Kaski 4008 13427 0.036 0.012 0.007 0.003 0.002 0.001Kaski 4009 20140 0.067 0.022 0.013 0.005 0.004 0.002Kaski 4010 15122 0.165 0.033 0.038 0.010 0.013 0.004Kaski 4011 13968 0.079 0.024 0.015 0.006 0.005 0.002Kaski 4012 22309 0.086 0.021 0.018 0.006 0.006 0.002Kaski 4013 14096 0.120 0.027 0.026 0.007 0.009 0.003Kaski 4014 58816 0.036 0.012 0.007 0.003 0.002 0.001Kaski 4015 255361 0.013 0.005 0.002 0.001 0.001 0.000Manang 4101 1129 0.406 0.057 0.119 0.022 0.049 0.011Manang 4102 652 0.347 0.065 0.090 0.021 0.034 0.010Manang 4103 306 0.305 0.072 0.064 0.022 0.020 0.009Manang 4104 630 0.294 0.065 0.071 0.020 0.025 0.009Manang 4105 257 0.382 0.087 0.095 0.029 0.034 0.014Manang 4106 377 0.313 0.071 0.074 0.022 0.026 0.010Manang 4107 538 0.487 0.082 0.127 0.031 0.046 0.015Manang 4108 926 0.418 0.065 0.120 0.024 0.049 0.012Manang 4109 1012 0.319 0.057 0.086 0.019 0.034 0.009Mustang 4201 1370 0.229 0.050 0.054 0.015 0.019 0.006Mustang 4202 1551 0.265 0.057 0.060 0.016 0.020 0.007Mustang 4203 1449 0.392 0.059 0.105 0.021 0.040 0.010Mustang 4204 1063 0.633 0.062 0.195 0.032 0.080 0.017Mustang 4205 1370 0.655 0.069 0.198 0.034 0.080 0.018Mustang 4206 889 0.585 0.065 0.167 0.030 0.065 0.015Mustang 4207 881 0.262 0.059 0.061 0.017 0.022 0.007Mustang 4208 1550 0.304 0.056 0.076 0.018 0.028 0.008Mustang 4209 1470 0.342 0.058 0.085 0.019 0.031 0.00832 NEPAL <strong>Small</strong> <strong>Area</strong> <strong>Estimation</strong> <strong>of</strong> <strong>Poverty</strong>, 2011, Summary and Major Findings
A 3: SAE <strong>Poverty</strong> Rates at the Ilaka level; Average and Standard ErrorDistrict Ilaka code DDII Population FGT(0) S.E. FGT(0) FGT(1) S.E. FGT(1) FGT(2) S.E. FGT(2)Gulmi 4611 30272 0.251 0.050 0.055 0.014 0.018 0.005Gulmi 4612 21899 0.361 0.057 0.087 0.019 0.030 0.008Gulmi 4613 23257 0.293 0.054 0.067 0.016 0.023 0.006Palpa 4701 17615 0.356 0.054 0.092 0.019 0.034 0.009Palpa 4702 36308 0.207 0.035 0.050 0.011 0.018 0.005Palpa 4703 20353 0.263 0.045 0.065 0.015 0.024 0.006Palpa 4704 16378 0.335 0.049 0.087 0.017 0.032 0.008Palpa 4705 15239 0.221 0.041 0.052 0.013 0.018 0.005Palpa 4706 20734 0.308 0.049 0.079 0.017 0.029 0.008Palpa 4707 22698 0.132 0.029 0.027 0.007 0.009 0.003Palpa 4708 20915 0.187 0.038 0.043 0.011 0.015 0.005Palpa 4709 9129 0.129 0.032 0.026 0.008 0.008 0.003Palpa 4710 13174 0.143 0.030 0.031 0.008 0.010 0.003Palpa 4711 15097 0.241 0.043 0.056 0.013 0.019 0.005Palpa 4712 9770 0.266 0.045 0.064 0.014 0.023 0.006Palpa 4713 12347 0.321 0.054 0.079 0.018 0.028 0.008Palpa 4714 29095 0.069 0.017 0.013 0.004 0.004 0.001Nawalparasi 4801 20204 0.277 0.050 0.065 0.015 0.023 0.006Nawalparasi 4802 20637 0.297 0.051 0.069 0.016 0.024 0.007Nawalparasi 4803 69929 0.054 0.014 0.011 0.003 0.003 0.001Nawalparasi 4804 62939 0.086 0.022 0.017 0.005 0.006 0.002Nawalparasi 4805 55163 0.125 0.027 0.026 0.007 0.008 0.002Nawalparasi 4806 45691 0.137 0.031 0.030 0.008 0.010 0.003Nawalparasi 4807 48760 0.178 0.035 0.039 0.010 0.013 0.004Nawalparasi 4808 36933 0.199 0.040 0.042 0.011 0.013 0.004Nawalparasi 4809 34360 0.342 0.054 0.083 0.018 0.029 0.008Nawalparasi 4810 22719 0.350 0.055 0.083 0.018 0.028 0.007Nawalparasi 4811 45001 0.146 0.030 0.031 0.008 0.010 0.003Nawalparasi 4812 34182 0.146 0.034 0.030 0.009 0.009 0.003Nawalparasi 4813 26720 0.150 0.032 0.032 0.009 0.010 0.003Nawalparasi 4814 29051 0.211 0.040 0.046 0.012 0.015 0.005Nawalparasi 4815 60531 0.169 0.034 0.037 0.010 0.012 0.004Nawalparasi 4816 25975 0.242 0.038 0.066 0.015 0.026 0.007Rupendehai 4901 93663 0.097 0.021 0.020 0.005 0.006 0.002Rupendehai 4902 37655 0.273 0.050 0.064 0.016 0.022 0.007Rupendehai 4903 41722 0.039 0.010 0.008 0.002 0.002 0.001Rupendehai 4904 28451 0.092 0.021 0.020 0.006 0.006 0.002Rupendehai 4905 23682 0.129 0.027 0.028 0.008 0.009 0.003Rupendehai 4906 5228 0.302 0.054 0.072 0.017 0.025 0.007Rupendehai 4907 10082 0.057 0.018 0.010 0.004 0.003 0.001Rupendehai 4908 44507 0.082 0.018 0.017 0.005 0.005 0.002Rupendehai 4909 25892 0.184 0.036 0.042 0.011 0.014 0.004Rupendehai 4910 23723 0.197 0.039 0.044 0.011 0.015 0.004Rupendehai 4911 63329 0.103 0.024 0.021 0.006 0.007 0.002Rupendehai 4912 53690 0.322 0.052 0.079 0.017 0.028 0.007Rupendehai 4913 41281 0.280 0.049 0.066 0.016 0.023 0.00734 NEPAL <strong>Small</strong> <strong>Area</strong> <strong>Estimation</strong> <strong>of</strong> <strong>Poverty</strong>, 2011, Summary and Major Findings
A 3: SAE <strong>Poverty</strong> Rates at the Ilaka level; Average and Standard ErrorDistrict Ilaka code DDII Population FGT(0) S.E. FGT(0) FGT(1) S.E. FGT(1) FGT(2) S.E. FGT(2)Rupendehai 4914 47758 0.325 0.052 0.080 0.017 0.029 0.008Rupendehai 4915 38792 0.356 0.054 0.088 0.019 0.031 0.008Rupendehai 4916 54213 0.344 0.052 0.084 0.018 0.030 0.008Rupendehai 4917 57873 0.287 0.051 0.068 0.016 0.024 0.007Rupendehai 4918 118355 0.035 0.010 0.008 0.003 0.003 0.001Rupendehai 4919 63412 0.096 0.019 0.025 0.006 0.010 0.003Kapilbastu 5001 42400 0.159 0.031 0.034 0.008 0.011 0.003Kapilbastu 5002 33687 0.420 0.060 0.104 0.021 0.037 0.009Kapilbastu 5003 31791 0.457 0.065 0.119 0.025 0.044 0.011Kapilbastu 5004 34538 0.403 0.062 0.098 0.021 0.034 0.009Kapilbastu 5005 44385 0.184 0.034 0.039 0.009 0.013 0.003Kapilbastu 5006 10774 0.422 0.062 0.106 0.022 0.038 0.010Kapilbastu 5007 23626 0.427 0.064 0.106 0.023 0.038 0.010Kapilbastu 5008 26084 0.426 0.064 0.108 0.023 0.039 0.010Kapilbastu 5009 32493 0.316 0.050 0.078 0.017 0.027 0.007Kapilbastu 5010 34216 0.245 0.044 0.056 0.013 0.019 0.005Kapilbastu 5011 28176 0.402 0.060 0.100 0.021 0.036 0.009Kapilbastu 5012 40800 0.406 0.059 0.103 0.021 0.037 0.009Kapilbastu 5013 46648 0.469 0.055 0.125 0.022 0.046 0.010Kapilbastu 5014 60744 0.353 0.053 0.089 0.018 0.032 0.008Kapilbastu 5015 47709 0.397 0.055 0.101 0.020 0.036 0.009Kapilbastu 5016 30371 0.315 0.042 0.089 0.017 0.035 0.008Arghakhanchi 5101 14435 0.235 0.042 0.054 0.012 0.018 0.005Arghakhanchi 5102 15531 0.238 0.048 0.052 0.013 0.017 0.005Arghakhanchi 5103 18738 0.244 0.048 0.053 0.013 0.017 0.005Arghakhanchi 5104 13198 0.189 0.039 0.040 0.010 0.013 0.004Arghakhanchi 5105 24012 0.333 0.054 0.080 0.017 0.028 0.007Arghakhanchi 5106 21900 0.345 0.059 0.084 0.020 0.030 0.008Arghakhanchi 5107 21471 0.450 0.062 0.118 0.023 0.043 0.011Arghakhanchi 5108 25857 0.188 0.033 0.044 0.010 0.015 0.004Arghakhanchi 5109 12666 0.312 0.052 0.074 0.016 0.026 0.007Arghakhanchi 5110 14221 0.302 0.055 0.072 0.017 0.025 0.007Arghakhanchi 5111 14864 0.280 0.051 0.064 0.015 0.022 0.006Pyuthan 5201 16794 0.259 0.086 0.059 0.026 0.020 0.010Pyuthan 5202 17661 0.291 0.088 0.069 0.028 0.023 0.011Pyuthan 5203 17435 0.325 0.093 0.081 0.032 0.029 0.014Pyuthan 5204 19896 0.383 0.097 0.095 0.033 0.033 0.014Pyuthan 5205 20946 0.348 0.093 0.085 0.031 0.030 0.013Pyuthan 5206 13869 0.209 0.075 0.046 0.021 0.015 0.008Pyuthan 5207 25350 0.235 0.077 0.054 0.024 0.018 0.010Pyuthan 5208 19087 0.294 0.089 0.071 0.029 0.025 0.012Pyuthan 5209 29914 0.395 0.101 0.100 0.036 0.036 0.016Pyuthan 5210 22532 0.423 0.101 0.111 0.038 0.041 0.017Pyuthan 5211 23221 0.281 0.078 0.069 0.026 0.025 0.011Rolpa 5301 27500 0.220 0.086 0.047 0.024 0.015 0.009Rolpa 5302 20673 0.270 0.102 0.059 0.030 0.019 0.012NEPAL <strong>Small</strong> <strong>Area</strong> <strong>Estimation</strong> <strong>of</strong> <strong>Poverty</strong>, 2011, Summary and Major Findings 35
A 3: SAE <strong>Poverty</strong> Rates at the Ilaka level; Average and Standard ErrorDistrict Ilaka code DDII Population FGT(0) S.E. FGT(0) FGT(1) S.E. FGT(1) FGT(2) S.E. FGT(2)Rolpa 5303 27831 0.351 0.101 0.084 0.033 0.029 0.014Rolpa 5304 16495 0.418 0.113 0.102 0.040 0.036 0.017Rolpa 5305 14883 0.331 0.099 0.075 0.030 0.025 0.012Rolpa 5306 18077 0.208 0.083 0.042 0.022 0.013 0.008Rolpa 5307 20943 0.233 0.090 0.047 0.023 0.014 0.008Rolpa 5308 20365 0.205 0.083 0.040 0.022 0.012 0.008Rolpa 5309 16737 0.187 0.080 0.037 0.020 0.011 0.007Rolpa 5310 20592 0.212 0.081 0.042 0.021 0.013 0.007Rolpa 5311 17072 0.232 0.092 0.047 0.024 0.014 0.009Rukum 5401 27335 0.165 0.073 0.033 0.018 0.010 0.006Rukum 5402 19941 0.187 0.075 0.038 0.019 0.011 0.007Rukum 5403 12115 0.249 0.087 0.053 0.024 0.017 0.009Rukum 5404 9009 0.262 0.089 0.057 0.025 0.018 0.010Rukum 5405 13616 0.322 0.104 0.074 0.032 0.025 0.013Rukum 5406 12738 0.284 0.100 0.062 0.029 0.020 0.011Rukum 5407 18273 0.258 0.091 0.054 0.025 0.017 0.009Rukum 5408 26314 0.211 0.084 0.043 0.022 0.013 0.008Rukum 5409 21149 0.271 0.092 0.057 0.026 0.018 0.010Rukum 5410 27734 0.441 0.117 0.110 0.042 0.039 0.018Rukum 5411 19058 0.264 0.092 0.055 0.026 0.017 0.010Salyan 5501 23005 0.344 0.105 0.079 0.033 0.026 0.013Salyan 5502 16624 0.258 0.094 0.055 0.027 0.018 0.010Salyan 5503 18197 0.270 0.094 0.058 0.027 0.019 0.010Salyan 5504 25527 0.287 0.094 0.064 0.028 0.021 0.011Salyan 5505 19200 0.196 0.067 0.042 0.019 0.013 0.007Salyan 5506 14582 0.417 0.114 0.101 0.039 0.035 0.016Salyan 5507 24008 0.274 0.093 0.060 0.027 0.020 0.010Salyan 5508 21465 0.332 0.104 0.075 0.033 0.025 0.013Salyan 5509 24972 0.272 0.101 0.057 0.029 0.018 0.011Salyan 5510 19966 0.389 0.115 0.092 0.038 0.031 0.016Salyan 5511 34108 0.236 0.091 0.050 0.025 0.016 0.009Dang 5601 12101 0.109 0.054 0.020 0.012 0.006 0.004Dang 5602 24796 0.367 0.092 0.092 0.033 0.033 0.014Dang 5603 26695 0.310 0.086 0.075 0.028 0.026 0.012Dang 5604 62806 0.281 0.082 0.066 0.026 0.023 0.011Dang 5605 57546 0.242 0.077 0.057 0.024 0.019 0.010Dang 5606 38303 0.434 0.101 0.117 0.040 0.044 0.018Dang 5607 48944 0.271 0.092 0.063 0.029 0.021 0.012Dang 5608 5293 0.260 0.079 0.059 0.024 0.020 0.009Dang 5609 25624 0.278 0.091 0.062 0.027 0.021 0.011Dang 5610 27469 0.297 0.095 0.068 0.029 0.023 0.012Dang 5611 24443 0.280 0.081 0.065 0.025 0.022 0.010Dang 5612 23958 0.209 0.069 0.046 0.020 0.015 0.008Dang 5613 55512 0.214 0.072 0.046 0.021 0.015 0.008Dang 5614 62921 0.159 0.048 0.037 0.014 0.013 0.006Dang 5615 51537 0.193 0.055 0.046 0.017 0.016 0.00736 NEPAL <strong>Small</strong> <strong>Area</strong> <strong>Estimation</strong> <strong>of</strong> <strong>Poverty</strong>, 2011, Summary and Major Findings
A 3: SAE <strong>Poverty</strong> Rates at the Ilaka level; Average and Standard ErrorDistrict Ilaka code DDII Population FGT(0) S.E. FGT(0) FGT(1) S.E. FGT(1) FGT(2) S.E. FGT(2)Banke 5701 20986 0.565 0.100 0.169 0.047 0.068 0.024Banke 5702 38171 0.464 0.106 0.128 0.043 0.049 0.020Banke 5703 35485 0.269 0.091 0.059 0.027 0.019 0.011Banke 5704 70634 0.141 0.052 0.030 0.014 0.010 0.005Banke 5705 27860 0.314 0.084 0.080 0.029 0.029 0.013Banke 5706 20617 0.584 0.100 0.181 0.050 0.075 0.026Banke 5707 14655 0.401 0.101 0.105 0.037 0.038 0.017Banke 5708 15725 0.153 0.051 0.034 0.014 0.011 0.006Banke 5709 18232 0.379 0.097 0.094 0.033 0.034 0.014Banke 5710 54410 0.214 0.078 0.046 0.022 0.015 0.008Banke 5711 34700 0.302 0.084 0.073 0.028 0.025 0.012Banke 5712 27843 0.327 0.085 0.084 0.031 0.031 0.014Banke 5713 32929 0.238 0.069 0.057 0.022 0.020 0.009Banke 5714 72430 0.096 0.034 0.022 0.009 0.007 0.004Bardiya 5801 41140 0.263 0.085 0.059 0.025 0.020 0.010Bardiya 5802 22287 0.205 0.069 0.044 0.019 0.014 0.007Bardiya 5803 40301 0.218 0.079 0.047 0.022 0.015 0.008Bardiya 5804 41807 0.257 0.085 0.058 0.025 0.019 0.010Bardiya 5805 26149 0.279 0.088 0.063 0.026 0.021 0.010Bardiya 5806 10875 0.435 0.098 0.116 0.037 0.043 0.017Bardiya 5807 8431 0.209 0.073 0.045 0.020 0.014 0.008Bardiya 5808 41074 0.231 0.084 0.051 0.024 0.017 0.010Bardiya 5809 31268 0.248 0.079 0.055 0.023 0.018 0.009Bardiya 5810 23331 0.265 0.087 0.059 0.026 0.019 0.010Bardiya 5811 31959 0.282 0.092 0.065 0.029 0.022 0.012Bardiya 5812 20152 0.243 0.092 0.051 0.025 0.016 0.010Bardiya 5813 28479 0.285 0.091 0.064 0.028 0.021 0.011Bardiya 5814 55494 0.496 0.082 0.159 0.040 0.068 0.021Surkhet 5901 42895 0.241 0.079 0.056 0.025 0.019 0.010Surkhet 5902 28279 0.362 0.094 0.090 0.033 0.032 0.014Surkhet 5903 23939 0.384 0.103 0.096 0.037 0.034 0.016Surkhet 5904 21181 0.235 0.076 0.053 0.022 0.018 0.009Surkhet 5905 22639 0.394 0.106 0.097 0.037 0.034 0.016Surkhet 5906 20413 0.468 0.113 0.121 0.042 0.044 0.019Surkhet 5907 22815 0.294 0.095 0.067 0.029 0.023 0.012Surkhet 5908 25841 0.127 0.048 0.027 0.012 0.008 0.005Surkhet 5909 25111 0.359 0.100 0.088 0.034 0.031 0.014Surkhet 5910 30558 0.411 0.108 0.104 0.039 0.038 0.017Surkhet 5911 31627 0.424 0.103 0.110 0.038 0.040 0.017Surkhet 5912 47914 0.135 0.045 0.032 0.013 0.011 0.005Dailekh 6001 2721 0.131 0.052 0.027 0.013 0.008 0.005Dailekh 6002 22585 0.364 0.097 0.087 0.032 0.030 0.013Dailekh 6003 20802 0.385 0.106 0.093 0.037 0.032 0.016Dailekh 6004 21723 0.234 0.087 0.049 0.025 0.016 0.009Dailekh 6005 24150 0.249 0.085 0.056 0.025 0.019 0.010Dailekh 6006 11045 0.302 0.091 0.069 0.028 0.023 0.012NEPAL <strong>Small</strong> <strong>Area</strong> <strong>Estimation</strong> <strong>of</strong> <strong>Poverty</strong>, 2011, Summary and Major Findings 37
A 3: SAE <strong>Poverty</strong> Rates at the Ilaka level; Average and Standard ErrorDistrict Ilaka code DDII Population FGT(0) S.E. FGT(0) FGT(1) S.E. FGT(1) FGT(2) S.E. FGT(2)Dailekh 6007 25041 0.373 0.105 0.091 0.036 0.032 0.015Dailekh 6008 37399 0.389 0.101 0.095 0.035 0.033 0.015Dailekh 6009 38732 0.461 0.112 0.119 0.043 0.043 0.019Dailekh 6010 13711 0.404 0.109 0.102 0.040 0.036 0.017Dailekh 6011 21811 0.397 0.108 0.097 0.037 0.034 0.016Dailekh 6012 21101 0.383 0.085 0.108 0.034 0.042 0.016Jajarkot 6101 20103 0.276 0.088 0.061 0.026 0.020 0.010Jajarkot 6102 13412 0.417 0.116 0.103 0.041 0.036 0.017Jajarkot 6103 19325 0.409 0.112 0.100 0.039 0.035 0.017Jajarkot 6104 17379 0.413 0.117 0.101 0.041 0.035 0.017Jajarkot 6105 7556 0.489 0.112 0.128 0.044 0.047 0.020Jajarkot 6106 11891 0.379 0.102 0.092 0.036 0.032 0.016Jajarkot 6107 16103 0.379 0.113 0.092 0.038 0.032 0.016Jajarkot 6108 17401 0.326 0.102 0.074 0.032 0.025 0.013Jajarkot 6109 15269 0.360 0.109 0.084 0.035 0.028 0.014Jajarkot 6110 19642 0.417 0.114 0.102 0.040 0.035 0.017Jajarkot 6111 12008 0.312 0.096 0.069 0.029 0.023 0.012Dolpa 6201 7433 0.419 0.102 0.108 0.038 0.039 0.017Dolpa 6202 6699 0.449 0.111 0.115 0.041 0.041 0.018Dolpa 6203 3405 0.559 0.118 0.154 0.052 0.058 0.025Dolpa 6204 5123 0.543 0.115 0.153 0.050 0.059 0.024Dolpa 6205 2273 0.427 0.111 0.109 0.040 0.039 0.018Dolpa 6206 1473 0.404 0.113 0.102 0.040 0.037 0.017Dolpa 6207 3752 0.242 0.098 0.049 0.027 0.015 0.010Dolpa 6208 4499 0.383 0.114 0.093 0.039 0.033 0.017Dolpa 6209 1451 0.340 0.115 0.075 0.035 0.024 0.014Jumla 6301 16861 0.346 0.100 0.083 0.033 0.029 0.014Jumla 6302 14443 0.510 0.108 0.136 0.043 0.050 0.020Jumla 6303 8707 0.387 0.112 0.092 0.037 0.032 0.015Jumla 6304 14638 0.502 0.108 0.133 0.044 0.049 0.020Jumla 6305 13593 0.573 0.111 0.161 0.050 0.062 0.024Jumla 6306 10517 0.587 0.113 0.167 0.051 0.064 0.025Jumla 6307 11980 0.505 0.113 0.135 0.044 0.050 0.020Jumla 6308 10338 0.542 0.106 0.150 0.045 0.057 0.022Jumla 6309 6322 0.490 0.117 0.127 0.045 0.046 0.020Kalikot 6401 18412 0.574 0.101 0.173 0.049 0.070 0.025Kalikot 6402 13364 0.572 0.112 0.162 0.050 0.063 0.025Kalikot 6403 16272 0.632 0.102 0.194 0.052 0.079 0.027Kalikot 6404 12798 0.584 0.107 0.169 0.048 0.066 0.024Kalikot 6405 21366 0.471 0.117 0.121 0.044 0.044 0.019Kalikot 6406 18774 0.627 0.104 0.192 0.054 0.078 0.028Kalikot 6407 12020 0.633 0.107 0.189 0.052 0.076 0.026Kalikot 6408 8119 0.534 0.109 0.148 0.046 0.056 0.022Kalikot 6409 15289 0.618 0.105 0.181 0.051 0.071 0.026Mugu 6501 11388 0.412 0.106 0.103 0.038 0.037 0.017Mugu 6502 10777 0.588 0.109 0.170 0.050 0.066 0.02438 NEPAL <strong>Small</strong> <strong>Area</strong> <strong>Estimation</strong> <strong>of</strong> <strong>Poverty</strong>, 2011, Summary and Major Findings
A 3: SAE <strong>Poverty</strong> Rates at the Ilaka level; Average and Standard ErrorDistrict Ilaka code DDII Population FGT(0) S.E. FGT(0) FGT(1) S.E. FGT(1) FGT(2) S.E. FGT(2)Mugu 6503 1993 0.323 0.109 0.071 0.033 0.023 0.013Mugu 6504 964 0.374 0.119 0.087 0.039 0.029 0.016Mugu 6505 7221 0.331 0.112 0.072 0.033 0.023 0.013Mugu 6506 5345 0.586 0.105 0.168 0.049 0.065 0.024Mugu 6507 6750 0.464 0.116 0.119 0.044 0.043 0.020Mugu 6508 5969 0.520 0.116 0.139 0.047 0.052 0.022Mugu 6509 4383 0.483 0.107 0.132 0.044 0.050 0.021Humla 6601 7423 0.350 0.096 0.087 0.033 0.031 0.014Humla 6602 5184 0.475 0.111 0.128 0.044 0.048 0.021Humla 6603 2843 0.334 0.104 0.078 0.033 0.026 0.014Humla 6604 4104 0.525 0.109 0.148 0.046 0.058 0.022Humla 6605 6110 0.580 0.117 0.170 0.053 0.067 0.026Humla 6606 4647 0.617 0.108 0.187 0.053 0.076 0.027Humla 6607 4285 0.699 0.107 0.225 0.059 0.094 0.032Humla 6608 9164 0.720 0.096 0.237 0.057 0.101 0.032Humla 6609 5944 0.622 0.106 0.187 0.052 0.075 0.026Bajura 6701 18207 0.552 0.104 0.160 0.048 0.063 0.024Bajura 6702 12818 0.696 0.096 0.229 0.056 0.097 0.031Bajura 6703 12762 0.694 0.096 0.229 0.057 0.098 0.032Bajura 6704 10689 0.644 0.109 0.201 0.055 0.083 0.029Bajura 6705 13765 0.655 0.103 0.207 0.054 0.087 0.029Bajura 6706 11376 0.566 0.110 0.164 0.049 0.065 0.024Bajura 6707 14251 0.690 0.099 0.219 0.056 0.091 0.030Bajura 6708 21520 0.645 0.107 0.200 0.056 0.082 0.029Bajura 6709 18150 0.659 0.106 0.203 0.056 0.083 0.030Bajhang 6801 13719 0.596 0.111 0.173 0.052 0.068 0.026Bajhang 6802 14932 0.555 0.119 0.153 0.051 0.058 0.024Bajhang 6803 22969 0.511 0.113 0.142 0.047 0.054 0.022Bajhang 6804 10437 0.555 0.109 0.158 0.047 0.062 0.023Bajhang 6805 16288 0.521 0.116 0.145 0.049 0.055 0.024Bajhang 6806 15847 0.539 0.114 0.152 0.049 0.059 0.023Bajhang 6807 12972 0.530 0.107 0.146 0.045 0.055 0.021Bajhang 6808 21296 0.573 0.114 0.160 0.051 0.061 0.025Bajhang 6809 15630 0.596 0.113 0.173 0.053 0.068 0.027Bajhang 6810 25682 0.572 0.108 0.161 0.049 0.062 0.024Bajhang 6811 24653 0.611 0.106 0.179 0.051 0.070 0.026Achham 6901 21773 0.463 0.093 0.130 0.040 0.050 0.019Achham 6902 14219 0.406 0.105 0.104 0.039 0.038 0.017Achham 6903 12724 0.405 0.104 0.102 0.036 0.036 0.016Achham 6904 20861 0.417 0.114 0.103 0.040 0.036 0.017Achham 6905 13967 0.329 0.092 0.080 0.031 0.028 0.013Achham 6906 22527 0.483 0.105 0.129 0.041 0.048 0.019Achham 6907 17329 0.515 0.099 0.147 0.042 0.057 0.021Achham 6908 26682 0.497 0.103 0.140 0.044 0.054 0.021Achham 6909 14037 0.492 0.107 0.133 0.043 0.050 0.020Achham 6910 25904 0.509 0.110 0.138 0.046 0.052 0.022NEPAL <strong>Small</strong> <strong>Area</strong> <strong>Estimation</strong> <strong>of</strong> <strong>Poverty</strong>, 2011, Summary and Major Findings 39
A 3: SAE <strong>Poverty</strong> Rates at the Ilaka level; Average and Standard ErrorDistrict Ilaka code DDII Population FGT(0) S.E. FGT(0) FGT(1) S.E. FGT(1) FGT(2) S.E. FGT(2)Achham 6911 19174 0.425 0.114 0.107 0.043 0.038 0.019Achham 6912 25839 0.522 0.115 0.141 0.047 0.053 0.022Achham 6913 20947 0.494 0.108 0.133 0.043 0.050 0.019Doti 7001 6898 0.579 0.108 0.170 0.050 0.067 0.025Doti 7002 19682 0.578 0.102 0.170 0.048 0.067 0.024Doti 7003 23004 0.495 0.109 0.136 0.045 0.052 0.021Doti 7004 22348 0.521 0.097 0.150 0.044 0.059 0.021Doti 7005 19296 0.486 0.101 0.133 0.041 0.050 0.019Doti 7006 10453 0.408 0.101 0.102 0.036 0.036 0.016Doti 7007 12286 0.420 0.102 0.104 0.036 0.037 0.015Doti 7008 19689 0.517 0.109 0.141 0.045 0.053 0.021Doti 7009 11757 0.477 0.110 0.128 0.044 0.048 0.020Doti 7010 39419 0.454 0.098 0.128 0.041 0.050 0.019Doti 7011 16098 0.419 0.096 0.109 0.035 0.040 0.016Doti 7012 5914 0.537 0.113 0.149 0.048 0.057 0.023Kailali 7101 19952 0.334 0.100 0.083 0.033 0.030 0.014Kailali 7102 48445 0.287 0.089 0.066 0.027 0.022 0.011Kailali 7103 46629 0.420 0.096 0.110 0.036 0.041 0.016Kailali 7104 75425 0.305 0.091 0.072 0.029 0.025 0.012Kailali 7105 48014 0.460 0.102 0.124 0.040 0.047 0.019Kailali 7106 57450 0.401 0.093 0.104 0.035 0.038 0.015Kailali 7107 33175 0.369 0.093 0.091 0.032 0.032 0.013Kailali 7108 37887 0.425 0.106 0.112 0.040 0.041 0.018Kailali 7109 50051 0.294 0.093 0.067 0.028 0.022 0.011Kailali 7110 56017 0.360 0.101 0.087 0.034 0.030 0.014Kailali 7111 65656 0.328 0.082 0.083 0.028 0.030 0.012Kailali 7112 38176 0.393 0.101 0.100 0.036 0.036 0.016Kailali 7113 30724 0.248 0.076 0.058 0.024 0.020 0.010Kailali 7114 101815 0.226 0.062 0.057 0.021 0.021 0.009Kailali 7115 56068 0.338 0.082 0.089 0.030 0.033 0.013Kanchanpr 7201 53450 0.329 0.098 0.079 0.032 0.027 0.013Kanchanpr 7202 43292 0.335 0.091 0.083 0.030 0.030 0.013Kanchanpr 7203 28516 0.381 0.087 0.103 0.034 0.039 0.016Kanchanpr 7204 35920 0.407 0.095 0.108 0.036 0.040 0.016Kanchanpr 7205 22058 0.319 0.092 0.076 0.030 0.026 0.012Kanchanpr 7206 47195 0.379 0.098 0.096 0.035 0.035 0.015Kanchanpr 7207 39253 0.365 0.087 0.098 0.033 0.037 0.015Kanchanpr 7208 104105 0.236 0.060 0.063 0.021 0.024 0.009Kanchanpr 7210 21985 0.200 0.067 0.047 0.020 0.016 0.008Kanchanpr 7211 51810 0.311 0.090 0.076 0.030 0.027 0.012Dadeldhura 7301 21175 0.388 0.087 0.107 0.033 0.042 0.015Dadeldhura 7302 9200 0.463 0.092 0.131 0.037 0.051 0.018Dadeldhura 7303 14365 0.494 0.100 0.143 0.043 0.057 0.021Dadeldhura 7304 11435 0.404 0.095 0.108 0.035 0.041 0.016Dadeldhura 7305 5050 0.455 0.106 0.118 0.040 0.043 0.01840 NEPAL <strong>Small</strong> <strong>Area</strong> <strong>Estimation</strong> <strong>of</strong> <strong>Poverty</strong>, 2011, Summary and Major Findings
A 3: SAE <strong>Poverty</strong> Rates at the Ilaka level; Average and Standard ErrorDistrict Ilaka code DDII Population FGT(0) S.E. FGT(0) FGT(1) S.E. FGT(1) FGT(2) S.E. FGT(2)Dadeldhura 7306 48386 0.447 0.108 0.119 0.043 0.044 0.020Dadeldhura 7307 14118 0.451 0.104 0.123 0.041 0.046 0.019Dadeldhura 7308 8573 0.457 0.096 0.127 0.039 0.049 0.018Dadeldhura 7309 8446 0.323 0.089 0.082 0.030 0.030 0.013Baitadi 7401 14838 0.454 0.101 0.125 0.040 0.048 0.019Baitadi 7402 19647 0.350 0.093 0.090 0.033 0.033 0.014Baitadi 7403 16388 0.403 0.099 0.104 0.036 0.038 0.016Baitadi 7404 17100 0.472 0.110 0.126 0.043 0.047 0.020Baitadi 7405 18111 0.505 0.115 0.139 0.047 0.053 0.022Baitadi 7406 16791 0.301 0.085 0.074 0.028 0.027 0.012Baitadi 7407 16450 0.369 0.093 0.094 0.032 0.034 0.014Baitadi 7408 18366 0.524 0.101 0.150 0.044 0.059 0.022Baitadi 7409 25471 0.546 0.109 0.155 0.047 0.060 0.023Baitadi 7410 16351 0.469 0.110 0.128 0.045 0.048 0.021Baitadi 7411 26621 0.420 0.111 0.106 0.040 0.038 0.018Baitadi 7412 19425 0.544 0.110 0.151 0.047 0.058 0.022Baitadi 7413 24285 0.497 0.107 0.133 0.042 0.049 0.019Darchula 7501 7753 0.567 0.113 0.162 0.052 0.063 0.025Darchula 7502 11646 0.581 0.107 0.169 0.049 0.067 0.024Darchula 7503 15866 0.380 0.079 0.107 0.032 0.042 0.015Darchula 7504 13307 0.507 0.114 0.138 0.047 0.052 0.023Darchula 7505 8562 0.474 0.105 0.132 0.043 0.051 0.020Darchula 7506 6533 0.525 0.109 0.145 0.045 0.055 0.021Darchula 7507 18176 0.542 0.112 0.149 0.048 0.056 0.023Darchula 7508 10004 0.588 0.110 0.175 0.052 0.070 0.026Darchula 7509 10969 0.547 0.108 0.149 0.046 0.056 0.021Darchula 7510 13630 0.482 0.109 0.130 0.043 0.049 0.020Darchula 7511 15864 0.704 0.093 0.229 0.055 0.097 0.030A 4: SAE <strong>Poverty</strong> Rates at the “Target <strong>Area</strong>” having FGT0 > 0.505; Average and Standard ErrorDistrict Ilaka Target VDC/ Municipality FGT(0) S.E. FGT(1) S.E. FGT(2) S.E.No No Name FGT(0) FGT(1) FGT(2)Gorkha 13 3 Lho,Samagaun 0.77 0.043 0.311 0.032 0.156 0.021Gorkha 13 1 Prok,Bihi 0.745 0.05 0.275 0.034 0.129 0.021Makwanpur 05 1 Kankada,Raksirang 0.728 0.054 0.265 0.036 0.123 0.023Myagdi 11 1 Mudi,Gurja Khani 0.725 0.053 0.259 0.034 0.118 0.021Humla 08 1 Shree Nagar,Jair,Kalika 0.721 0.097 0.238 0.059 0.101 0.033Gorkha 12 1 Laprak,Gumda 0.72 0.048 0.264 0.032 0.124 0.02Baitadi 08 1 Pancheswor 0.711 0.088 0.237 0.052 0.102 0.029Makwanpur 11 2 Kalikatar,Bharta Pundyadevi 0.703 0.075 0.228 0.046 0.095 0.026Gorkha 13 4 Sirdibas,Chumchet 0.703 0.051 0.253 0.031 0.117 0.019Humla 07 1 Mimi,Shreemastha,Darma 0.7 0.099 0.224 0.057 0.094 0.031Bajura 03 1 Jukot,Sappata,Bai 0.696 0.099 0.23 0.057 0.099 0.032Darchula 11 1 Eyarkot,Dhuligada,Khar,Sipti 0.691 0.097 0.222 0.055 0.093 0.03Bajura 02 1 Gotree,Kotila,Jagannath 0.689 0.098 0.225 0.056 0.096 0.03NEPAL <strong>Small</strong> <strong>Area</strong> <strong>Estimation</strong> <strong>of</strong> <strong>Poverty</strong>, 2011, Summary and Major Findings 41
A 4: SAE <strong>Poverty</strong> Rates at the “Target <strong>Area</strong>” having FGT0 > 0.505; Average and Standard ErrorDistrict Ilaka Target VDC/ Municipality FGT(0) S.E. FGT(1) S.E. FGT(2) S.E.No No Name FGT(0) FGT(1) FGT(2)Bajura 07 1 Jayabageswori,Dogadi,Gudukhati,Kanda 0.684 0.101 0.216 0.057 0.089 0.031Gorkha 12 3 Kerauja 0.67 0.059 0.222 0.032 0.097 0.018Banke 06 3 Holiya 0.67 0.09 0.223 0.053 0.097 0.03Mustang 05 1 Lomanthang,Chhonhup 0.661 0.067 0.201 0.034 0.082 0.018Bajura 09 1 Kailashmandau,Tolidewal,Chhatara 0.661 0.112 0.206 0.06 0.084 0.032Bajura 05 1 Pandusain,Kolti 0.659 0.098 0.209 0.052 0.087 0.028Doti 02 2 Pokhari 0.658 0.097 0.206 0.052 0.085 0.028Bajura 04 1 Bichhaiya,Baddhu,Rugin 0.651 0.101 0.204 0.052 0.085 0.028Saptari 01 2 Gobar Gada 0.649 0.103 0.19 0.056 0.073 0.029Gorkha 12 4 Uhiya 0.649 0.057 0.215 0.031 0.094 0.018Bajura 08 1 Bramhatola,Kuldeumadau,Barhabis 0.648 0.104 0.202 0.056 0.083 0.03Myagdi 09 2 Kuinemangale 0.646 0.062 0.211 0.033 0.091 0.019Baitadi 13 1 Nwadeu 0.644 0.112 0.19 0.057 0.075 0.029Achham 01 1 Siudi,Soukat 0.642 0.102 0.196 0.052 0.08 0.027Achham 13 1 Rahaph 0.637 0.111 0.19 0.055 0.076 0.028Gorkha 13 2 Chhekampar 0.636 0.063 0.205 0.034 0.088 0.019Doti 04 1 Dahakalikasthan,Mahadevsthan 0.632 0.103 0.192 0.053 0.078 0.027Makwanpur 09 1 Khairang,Dandakharka 0.631 0.078 0.189 0.04 0.075 0.021Humla 09 1 Maila,Madana 0.63 0.107 0.19 0.054 0.077 0.028Sindhuli 01 2 Mahadevdada,Ratnawati 0.628 0.083 0.186 0.042 0.073 0.022Sindhuli 11 2 Santeswori (Rampur) 0.628 0.102 0.183 0.052 0.071 0.027Mustang 04 1 Charang,Ghami 0.628 0.067 0.193 0.032 0.079 0.017Achham 08 1 Kuntibandali,Basti 0.628 0.103 0.186 0.051 0.073 0.026Kalikot 07 1 Chhapre,Chilkhaya,Odanaku 0.626 0.106 0.186 0.053 0.074 0.027Sindhuli 05 2 Tinkanya,Dudbhanjyang,Bitijor Bagaiya 0.622 0.073 0.183 0.037 0.072 0.019Kalikot 03 1 Phukot,Siuna,Sipkhana 0.622 0.106 0.189 0.052 0.077 0.027Kalikot 06 1 Mugraha,Sukataya,Marta,Gela 0.621 0.105 0.188 0.052 0.076 0.027Kailali 12 1 Khairala 0.621 0.105 0.182 0.051 0.072 0.026Doti 02 1 Gaihragau 0.619 0.105 0.185 0.052 0.074 0.027Makwanpur 06 3 Sarikhet Palase 0.617 0.072 0.191 0.038 0.079 0.02Bajhang 11 1 Syandi,Sunkuda,Deulikot,Deulekh 0.612 0.112 0.18 0.054 0.071 0.027Achham 10 1 Warla,Kalekanda 0.612 0.104 0.18 0.05 0.071 0.025Bajhang 09 1 Parakatne,Kot Bhairab,Koiralakot,Dangaji 0.61 0.109 0.18 0.052 0.071 0.026Kalikot 09 1 Dholagohe,Thirpu,Kheen 0.608 0.105 0.176 0.049 0.069 0.024Humla 06 1 Rodikot,Gothi,Melchham 0.605 0.105 0.182 0.052 0.073 0.027Achham 12 2 Mashtanamdali 0.602 0.109 0.178 0.05 0.071 0.025Achham 06 1 Santada,Sutar 0.601 0.11 0.175 0.052 0.069 0.026Jumla 06 1 Kalikakhetu,Mahabaipatharkhola,Badki 0.595 0.105 0.17 0.048 0.066 0.023Doti 02 3 Kadamadaun 0.594 0.102 0.178 0.049 0.072 0.025Darchula 08 1 Gokuleswor,Ranisikhar,Dethala 0.594 0.106 0.178 0.051 0.072 0.026Mugu 06 1 Kalai,Dhainakot,Rara 0.593 0.115 0.173 0.055 0.068 0.027Mugu 02 1 Rowa,Ruga,Mangri 0.592 0.111 0.172 0.052 0.068 0.026Dadeldhura 03 1 Belapur 0.592 0.103 0.179 0.049 0.072 0.025Baitadi 08 2 Amchaur 0.591 0.106 0.174 0.049 0.069 0.025Doti 12 1 Dhirkamandau 0.59 0.116 0.168 0.052 0.065 0.02542 NEPAL <strong>Small</strong> <strong>Area</strong> <strong>Estimation</strong> <strong>of</strong> <strong>Poverty</strong>, 2011, Summary and Major Findings
A 4: SAE <strong>Poverty</strong> Rates at the “Target <strong>Area</strong>” having FGT0 > 0.505; Average and Standard ErrorDistrict Ilaka Target VDC/ Municipality FGT(0) S.E. FGT(1) S.E. FGT(2) S.E.No No Name FGT(0) FGT(1) FGT(2)Doti 04 2 Kalikasthan,Banja Kakani 0.589 0.108 0.176 0.052 0.071 0.027Achham 08 2 Sera 0.588 0.107 0.172 0.05 0.068 0.025Darchula 02 1 Hikila,Pipalchauri,Dhari,Huti 0.588 0.112 0.173 0.051 0.069 0.026Mustang 06 1 Surkhang,Chhoser 0.587 0.068 0.169 0.032 0.066 0.016Sindhuli 02 2 Tosramkhola,Sunam Pokhari 0.585 0.083 0.171 0.04 0.066 0.02Baitadi 04 2 Dhungad 0.582 0.115 0.17 0.053 0.067 0.026Banke 06 2 Betahani 0.581 0.101 0.174 0.048 0.07 0.024Kalikot 01 1 Manma,Pakha,Dahafatgaun 0.581 0.107 0.177 0.052 0.072 0.026Kalikot 04 1 Raku,Mehal Mudi,Mumrakot 0.581 0.113 0.168 0.051 0.066 0.025Bajhang 01 1 Sunikot,Kanda,Datola,Melbisauni,Dhamena 0.581 0.112 0.166 0.051 0.065 0.025Doti 05 1 Wagalek 0.581 0.106 0.166 0.05 0.064 0.025Chitawan 01 2 Siddi,Lothar 0.58 0.083 0.157 0.038 0.057 0.019Banke 02 2 Matehiya,Gangapur 0.58 0.098 0.177 0.048 0.072 0.025Kailali 05 1 Pandaun,Mohanyal 0.579 0.109 0.163 0.049 0.063 0.024Bajhang 08 1 Bhairabanath,Rayal,Bhamchaur,Banjh 0.576 0.116 0.162 0.052 0.062 0.025Bajhang 10 1 Kaphalaseri,Khiratadi,Dahabagar,Pipalkot 0.576 0.115 0.164 0.052 0.063 0.025Doti 01 1 Kalena,Ladagada 0.575 0.106 0.168 0.049 0.067 0.024Baitadi 09 1 Udayadeb 0.575 0.116 0.161 0.051 0.062 0.025Myagdi 09 3 Malkwang 0.574 0.067 0.169 0.03 0.068 0.015Bajura 06 1 Dahakot,Atichaur,Manakot 0.573 0.107 0.167 0.048 0.066 0.024Doti 10 1 Basudevi,Tikhatar,Durgamadau 0.572 0.105 0.165 0.048 0.065 0.024Humla 05 1 Saya,Raya,Sarkeedeu,Barai 0.571 0.11 0.165 0.05 0.065 0.025Achham 07 1 Darna,Baradadivi 0.571 0.111 0.168 0.051 0.066 0.025Kailali 03 1 Sugarkhal 0.571 0.104 0.165 0.047 0.065 0.023Sindhuli 13 1 Hariharpur Gadhi 0.57 0.115 0.159 0.053 0.06 0.026Achham 09 2 Bannatoli 0.57 0.114 0.163 0.051 0.063 0.025Baitadi 12 1 Bijayapur,Talladehi 0.57 0.112 0.157 0.048 0.059 0.023Achham 03 1 Budhakot 0.568 0.116 0.164 0.052 0.064 0.026Doti 03 3 Khatiwada,Chhapali 0.568 0.11 0.164 0.049 0.064 0.024Banke 01 1 Laxmanpur,Narainapur,Jumla 05 1 Raralihi,Kudari,GhodeKatkuiya,Kalaphanta 0.565 0.102 0.169 0.047 0.068 0.024Mahadev,Malikathanta 0.565 0.114 0.158 0.05 0.06 0.024Baitadi 09 5 Bisalpur 0.563 0.115 0.169 0.052 0.068 0.026Darchula 01 1 Dhaulakot,Rapla,Sunsera,Byash 0.563 0.109 0.159 0.049 0.061 0.024Saptari 03 4 Pipra Purba 0.562 0.105 0.151 0.046 0.055 0.021Baglung 13 2 Nisi 0.562 0.058 0.174 0.027 0.074 0.014Surkhet 11 1 Betan,Lagaam 0.562 0.12 0.156 0.052 0.059 0.025Jumla 08 1 Kanakasundari,Pandawagufa,Birat 0.561 0.112 0.158 0.049 0.061 0.024Kalikot 02 1 Badalkot,Nanikot,Ramanakot 0.561 0.114 0.158 0.05 0.06 0.024Baitadi 12 2 Kataujpani,Dhikarim/Rim 0.56 0.116 0.159 0.052 0.062 0.025Bajhang 04 1 Hemantabada,Malumela,Kailash,Luyanta 0.558 0.104 0.159 0.046 0.062 0.023Myagdi 11 2 Lulang,Muna 0.554 0.063 0.165 0.028 0.067 0.014Baitadi 09 2 Sarmali 0.554 0.111 0.158 0.049 0.061 0.024NEPAL <strong>Small</strong> <strong>Area</strong> <strong>Estimation</strong> <strong>of</strong> <strong>Poverty</strong>, 2011, Summary and Major Findings 43
A 4: SAE <strong>Poverty</strong> Rates at the “Target <strong>Area</strong>” having FGT0 > 0.505; Average and Standard ErrorDistrict Ilaka Target VDC/ Municipality FGT(0) S.E. FGT(1) S.E. FGT(2) S.E.No No Name FGT(0) FGT(1) FGT(2)Baitadi 13 3 Bhatana 0.55 0.116 0.152 0.05 0.058 0.024Darchula 09 1 Sikhar,Sitaula,Tapoban,Seri 0.55 0.112 0.151 0.048 0.057 0.023Doti 08 3 Lana Kedareswor 0.549 0.109 0.153 0.05 0.058 0.024Bajhang 02 1 Masta,Rilu,Kotdewal,Bhatekhola 0.548 0.122 0.15 0.052 0.057 0.025Bajura 01 1 Martadi,Jugada,Budhiganga 0.547 0.105 0.158 0.048 0.062 0.024Achham 12 1 Walant 0.547 0.118 0.152 0.049 0.058 0.023Baitadi 05 1 Shivaling,Sigash 0.547 0.108 0.154 0.047 0.059 0.022Dolpa 03 1 Lhna,Likhu 0.546 0.117 0.149 0.05 0.056 0.024Udayapur 06 1 Baraha,Balamta 0.545 0.09 0.14 0.037 0.05 0.017Baitadi 13 2 Bumiraj 0.545 0.117 0.149 0.05 0.056 0.024Lamjung 08 4 Dhodeni 0.544 0.06 0.164 0.027 0.067 0.014Bajhang 06 1 Kalukheti,Patadewal,Gadaraya,Lamatola,Majhigau,Pauwagadhi 0.544 0.11 0.154 0.048 0.059 0.023Doti 05 2 Lamikhal 0.542 0.115 0.15 0.049 0.057 0.023Bajhang 07 1 Chaudhari,Sainpasela,Maulali 0.539 0.115 0.151 0.05 0.058 0.024Doti 06 1 Ganjari 0.539 0.112 0.148 0.047 0.056 0.022Saptari 15 2 Belhi,Mauwaha,Ramnagar,Rautahat 0.538 0.055 0.153 0.025 0.059 0.013Dolpa 04 1 Sarmi,Kalika,Narku 0.538 0.113 0.151 0.049 0.058 0.024Achham 08 3 Janalibandali 0.538 0.108 0.151 0.046 0.058 0.022Darchula 07 1 Gwani,Boharigau,Sharmauli,Rithachaupata 0.538 0.107 0.147 0.045 0.056 0.021Sindhuli 05 1 Bhuwaneshori Gwaltar 0.536 0.102 0.156 0.049 0.061 0.025Baitadi 09 3 Shibanath 0.535 0.111 0.149 0.047 0.057 0.022Baitadi 10 1 Dhikasintad/Sitad 0.535 0.112 0.147 0.047 0.055 0.022Rasuwa 02 1 Saramthali,Yarsa 0.534 0.09 0.14 0.038 0.05 0.018Dadeldhura 02 1 Manilek 0.534 0.107 0.16 0.049 0.065 0.025Doti 10 2 Ranagau 0.533 0.106 0.154 0.047 0.061 0.023Dhading 13 3 Mahadevsthan 0.532 0.102 0.149 0.048 0.056 0.024Achham 04 1 Risidaha 0.531 0.118 0.144 0.049 0.054 0.023Achham 06 2 Ramarosan 0.531 0.111 0.146 0.048 0.055 0.023Sindhuli 04 3 Ambote 0.53 0.11 0.149 0.049 0.057 0.024Makwanpur 01 2 Dhiyal,Betini,Raigaun 0.53 0.069 0.151 0.032 0.059 0.016Doti 02 5 Sanagau 0.53 0.111 0.151 0.048 0.059 0.023Baitadi 11 1 Kotpetara,Mathairaj 0.53 0.112 0.143 0.046 0.053 0.022Doti 08 4 Daud 0.529 0.107 0.148 0.045 0.056 0.022Sindhuli 11 1 Bastipur,Tamajor,Netrakali,Amale 0.527 0.06 0.143 0.025 0.053 0.012Darchula 06 1 Hunainath,Kharkada,Dadakot 0.527 0.112 0.147 0.048 0.056 0.023Achham 12 4 Dhodasain,Dhungachalna,Dhakari 0.526 0.115 0.141 0.047 0.052 0.022Doti 08 1 Satphari 0.526 0.115 0.144 0.048 0.054 0.023Baglung 10 2 Bowang 0.525 0.067 0.142 0.027 0.054 0.013Bajhang 05 1 Kadel,Matela,Byasi,Lekgau 0.525 0.114 0.146 0.049 0.056 0.024Dailekh 09 3 Bisalla 0.524 0.115 0.143 0.047 0.054 0.022Siraha 09 1 Aurahi,Harakatti,Itatar 0.523 0.065 0.14 0.028 0.051 0.013Parsa 10 1 Lakhanpur 0.523 0.094 0.153 0.044 0.061 0.023Sindhuli 04 2 Jinakhu 0.522 0.103 0.145 0.046 0.054 0.022Sindhuli 01 1 Solpathana,Khang Sang 0.521 0.078 0.144 0.034 0.054 0.017Mugu 08 1 Seri,Shreekot 0.521 0.114 0.14 0.047 0.052 0.022Humla 04 1 Chhipra,Lali,Kharpunath 0.521 0.113 0.146 0.047 0.057 0.02244 NEPAL <strong>Small</strong> <strong>Area</strong> <strong>Estimation</strong> <strong>of</strong> <strong>Poverty</strong>, 2011, Summary and Major Findings
A 4: SAE <strong>Poverty</strong> Rates at the “Target <strong>Area</strong>” having FGT0 > 0.505; Average and Standard ErrorDistrict Ilaka Target VDC/ Municipality FGT(0) S.E. FGT(1) S.E. FGT(2) S.E.No No Name FGT(0) FGT(1) FGT(2)Achham 10 2 Kalikasthan,Toli 0.521 0.112 0.141 0.045 0.052 0.021Udayapur 11 2 Shorung Chhabise,Limpatar 0.52 0.088 0.132 0.036 0.046 0.016Kavrepalanchok 07 3 Saldhara 0.52 0.125 0.122 0.049 0.04 0.021Rautahat 02 1 Rajdevi 0.52 0.087 0.158 0.043 0.064 0.023Doti 12 2 Girichauka 0.52 0.11 0.143 0.045 0.054 0.021Kalikot 08 1 Phoi Mahadev,Jubitha,Ranchuli 0.519 0.113 0.141 0.046 0.053 0.022Doti 08 2 Simchaur,Dhanglagau 0.519 0.102 0.141 0.043 0.053 0.02Doti 02 4 Gaguda 0.518 0.115 0.138 0.047 0.051 0.022Dadeldhura 07 1 Rupal 0.517 0.102 0.15 0.045 0.059 0.022Sindhuli 03 1 Kakur Thakur,Arunthakur,Mahendra jhyadi 0.515 0.061 0.142 0.026 0.054 0.012Baitadi 08 3 Giregada 0.515 0.11 0.143 0.046 0.055 0.022Udayapur 06 2 Tamlichha,Bansbote 0.514 0.089 0.127 0.035 0.044 0.015Pyuthan 09 1 Arkha 0.514 0.121 0.138 0.049 0.051 0.022Jumla 02 1 Patarasi,Guthichaur,Dillichaur,Chhumchaur 0.514 0.114 0.138 0.046 0.052 0.021Saptari 15 1 Deuri,Kachan 0.512 0.075 0.139 0.033 0.052 0.016Bajhang 03 1 Subeda,Daulichaur,Surma,Chainpur,Rithapata 0.511 0.105 0.142 0.044 0.054 0.021Saptari 02 1 Bairawa 0.51 0.094 0.145 0.045 0.056 0.023Baitadi 01 2 Melauli 0.509 0.104 0.145 0.045 0.057 0.022Surkhet 10 3 Chapre 0.508 0.117 0.133 0.046 0.049 0.021Baitadi 01 1 Maharudra 0.507 0.104 0.145 0.045 0.057 0.022Doti 09 1 Kedar Akhada 0.506 0.122 0.135 0.049 0.05 0.023Doti 09 3 Kanachaur,Bhumirajmadau 0.506 0.112 0.138 0.046 0.052 0.021A 5 : SAE <strong>of</strong> target areas( having number <strong>of</strong> poor > 10,000)DistrictIlakaNoTargetNoVDC/MunicipalityNameS.E.Population FGT(0)FGT(0)FGT(1)S.E.FGT(1)Kathmandu 16 3 Kathmandu Metro 973559 0.109 0.009 0.021 0.002 0.007 0.001 106118Morang 18 1 Biratnagar Sub-Metropolitan City 200596 0.175 0.019 0.039 0.006 0.013 0.002 35104Bardiya 14 1 Gulariya Municipality 55516 0.496 0.082 0.159 0.041 0.068 0.022 27536Kanchanp 08 1 Bhimdatta Municipality 104544 0.241 0.062 0.065 0.022 0.025 0.01 25195Kailali 14 1 Dhangadhi Municipality 101887 0.228 0.063 0.058 0.021 0.021 0.009 23230Bhaktapur 01 1 Bhaktapur Municipality 81587 0.272 0.04 0.068 0.013 0.024 0.006 22192Lalitpur 14 3 Lalitpur Sub-metropolitan city 220040 0.094 0.013 0.018 0.003 0.005 0.001 20684Kailali 15 1 Tikapur Municipality 56089 0.339 0.084 0.089 0.03 0.033 0.014 19014Parsa 01 1 Birgunj Sub-Metropolitan City 133799 0.142 0.024 0.031 0.007 0.01 0.003 18999Kailali 05 2 Masuriya,Ramsikhar Jhala 39976 0.441 0.106 0.118 0.042 0.044 0.019 17629Kailali 04 2 Baliya,Pratapapur 55534 0.299 0.091 0.072 0.029 0.025 0.012 16605Kanchanpr 11 1 Daijee,Jhalari 51828 0.307 0.091 0.074 0.03 0.026 0.012 15911Dadeldhura 06 1 Jogbuda,Alital 34777 0.454 0.103 0.12 0.04 0.044 0.018 15789Rupendehai 12 1 Jogada,Sadi,Bishnupura,Suryapura 47405 0.325 0.049 0.08 0.016 0.028 0.007 15407Bajhang 11 1 Syandi,Sunkuda,Deulikot,Deulekh 24608 0.612 0.112 0.18 0.054 0.071 0.027 15060Rupendehai 17 1 Gonaha,Maryadapur,Kamahariya,Bairghat,Sakraun Pakadi 49985 0.301 0.053 0.071 0.017 0.025 0.007 15045FGT(2)S.E.FGT(2)Number<strong>of</strong> PoorNEPAL <strong>Small</strong> <strong>Area</strong> <strong>Estimation</strong> <strong>of</strong> <strong>Poverty</strong>, 2011, Summary and Major Findings 45
A 5 : SAE <strong>of</strong> target areas( having number <strong>of</strong> poor > 10,000)DistrictIlakaNoTargetNoVDC/MunicipalityNameS.E.Population FGT(0)FGT(0)FGT(1)S.E.FGT(1)FGT(2)S.E.FGT(2)Number<strong>of</strong> PoorBajhang 10 1 Kaphalaseri,Khiratadi,Dahabagar,Pipalkot 25602 0.576 0.115 0.164 0.052 0.063 0.025 14747Dhanusa 18 1 Janakpur Municipality 97642 0.15 0.029 0.031 0.008 0.01 0.003 14646Kanchanpur 07 1 Chandani,Dodhara 39219 0.365 0.091 0.099 0.035 0.037 0.016 14315Rupendehai 16 2 Bogadi,Silautiya,Rayapur,Bagauli 41358 0.345 0.053 0.085 0.018 0.03 0.008 14269Bajura 08 1 Bramhatola,Kuldeumadau,Barhabis 21613 0.648 0.104 0.202 0.056 0.083 0.03 14005Jhapa 20 1 Mechinagar Municipality 57512 0.222 0.061 0.045 0.017 0.014 0.006 12768Bajhang 08 1 Bhairabanath,Rayal,Bhamchaur,Banjh 21307 0.576 0.116 0.162 0.052 0.062 0.025 12273Bara 03 3 Mahendra Adarsha,Laxmipur Kotwali,Golaganj,Hariharpur,ShreenagarBairiya,Dewapur 31009 0.391 0.046 0.099 0.017 0.035 0.007 12125Bajura 09 1 Kailashmandau,Tolidewal,Chhatara 18333 0.661 0.112 0.206 0.06 0.084 0.032 12118Kapilbastu 13 1 Bhagwanpur,Khurhuriya,Ramnagar,Ganeshpur 25369 0.474 0.056 0.129 0.022 0.049 0.01 12025Siraha 19 1 Siraha Municipality 28417 0.421 0.069 0.112 0.027 0.041 0.012 11964Kanchanp 06 1 Sankarpur,Dekhatbhuli 25803 0.46 0.107 0.121 0.041 0.045 0.018 11869A 5 : SAE <strong>of</strong> target areas( having number <strong>of</strong> poor > 10,000)DistrictIlakaNoTargetNoVDC/MunicipalityNameBanke 01 1 Laxmanpur,Narainapur,Katkuiya,Kalaphanta 20990 0.565 0.102 0.169 0.047 0.068 0.024 11859Bara 16 1 Kalaiya Municipality 42353 0.28 0.077 0.072 0.027 0.027 0.012 11859Bajhang 03 1 Subeda,Daulichaur,Surma,Chainpur,Rithapata 22937 0.511 0.105 0.142 0.044 0.054 0.021 11721Kalikot 06 1 Mugraha,Sukataya,Marta,Gela 18803 0.621 0.105 0.188 0.052 0.076 0.027 11677Dhanusa 08 2 Yagyabhumi,Dhanusadham,DhanushaS.E.Population FGT(0)FGT(0)FGT(1)Govindapur,Umaprempur 44981 0.259 0.051 0.051 0.014 0.015 0.005 11650Kailali 03 2 Kota Tulsipur,Dododhara 32633 0.357 0.099 0.088 0.034 0.031 0.014 11650Kailali 11 1 Godawari,Sahajpur 23842 0.488 0.107 0.136 0.045 0.052 0.021 11635Udayapur 12 1 Triyuga Municipality 69886 0.163 0.035 0.034 0.009 0.01 0.003 11391Kanchanp 01 2 Krishnapur 36640 0.308 0.093 0.072 0.03 0.025 0.012 11285Kailali 06 1 Sadepani 24853 0.453 0.107 0.122 0.042 0.046 0.02 11258Kailali 09 1 Boniya,Joshipur 36314 0.31 0.092 0.072 0.029 0.025 0.012 11257Kailali 06 2 Darakh,Pahalmanpur 32635 0.343 0.094 0.084 0.033 0.029 0.014 11194Kapilbastu 02 1 Nandanagar,Baskhore,Patariya 24805 0.45 0.063 0.114 0.023 0.041 0.01 11162Darchula 11 1 Eyarkot,Dhuligada,Khar,Sipti 15847 0.691 0.097 0.222 0.055 0.093 0.03 10950Kailali 07 1 Hasuliya,Basauti,Ratanpur 27394 0.395 0.103 0.1 0.037 0.036 0.016 10821Kalikot 01 1 Manma,Pakha,Dahafatgaun 18257 0.581 0.107 0.177 0.052 0.072 0.026 10607Makwanpur 05 1 Kankada,Raksirang 14405 0.728 0.054 0.265 0.036 0.123 0.023 10487Makwanpur 01 2 Dhiyal,Betini,Raigaun 19664 0.53 0.069 0.151 0.032 0.059 0.016 10422Saptari 07 1 Sankarpura,Barsain (Ko.),Koiladi,Rampuramalhaniya 21346 0.487 0.055 0.133 0.023 0.05 0.011 10396Saptari 05 1 Dadha,Prasabani,Goithi,Pakari 22605 0.457 0.057 0.119 0.022 0.043 0.01 10330Saptari 16 1 Dhanagadi,Malhaniya,Saraswor,Siswa Beihi 24941 0.412 0.052 0.106 0.02 0.038 0.009 10276Bhaktapur 11 2 Madhyapur Thimi Mun 82618 0.124 0.022 0.027 0.006 0.009 0.002 10245Kalikot 05 1 Malkot,Rupsa,Kumalgaun,Lalu,Kotbada 21355 0.477 0.115 0.123 0.045 0.045 0.02 10186Kalikot 03 1 Phukot,Siuna,Sipkhana 16216 0.622 0.106 0.189 0.052 0.077 0.027 10086Bara 02 1 Paterwa,Tedhakatti,Baghawan,Bhagwanpur,Inarwamal 26132 0.383 0.046 0.098 0.017 0.035 0.008 1000946 NEPAL <strong>Small</strong> <strong>Area</strong> <strong>Estimation</strong> <strong>of</strong> <strong>Poverty</strong>, 2011, Summary and Major Findings


