

Small Area Estimation of Poverty
Small Area Estimation of Poverty
Small Area Estimation of Poverty
- No tags were found...

Create successful ePaper yourself
Turn your PDF publications into a flip-book with our unique Google optimized e-Paper software.
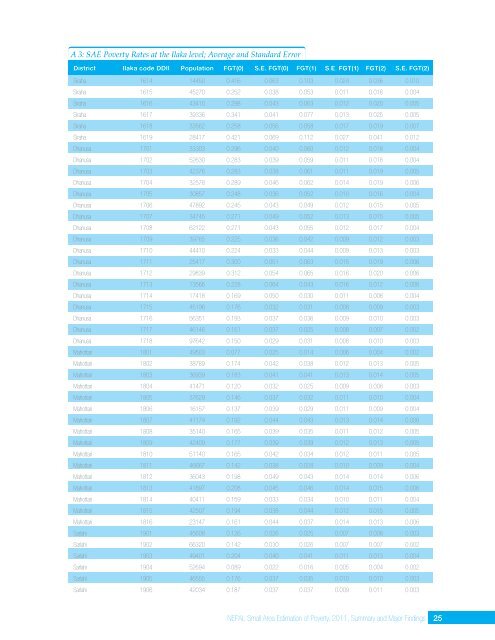
A 3: SAE <strong>Poverty</strong> Rates at the Ilaka level; Average and Standard ErrorDistrict Ilaka code DDII Population FGT(0) S.E. FGT(0) FGT(1) S.E. FGT(1) FGT(2) S.E. FGT(2)Siraha 1614 14450 0.416 0.063 0.103 0.024 0.036 0.010Siraha 1615 45270 0.252 0.038 0.053 0.011 0.016 0.004Siraha 1616 43410 0.298 0.043 0.063 0.012 0.020 0.005Siraha 1617 39336 0.341 0.041 0.077 0.013 0.025 0.005Siraha 1618 33562 0.258 0.056 0.058 0.017 0.019 0.007Siraha 1619 28417 0.421 0.069 0.112 0.027 0.041 0.012Dhanusa 1701 33303 0.296 0.040 0.060 0.012 0.018 0.004Dhanusa 1702 52630 0.283 0.039 0.059 0.011 0.018 0.004Dhanusa 1703 42376 0.283 0.038 0.061 0.011 0.019 0.005Dhanusa 1704 32578 0.289 0.046 0.062 0.014 0.019 0.006Dhanusa 1705 30857 0.248 0.036 0.052 0.010 0.016 0.004Dhanusa 1706 47892 0.245 0.043 0.049 0.012 0.015 0.005Dhanusa 1707 34745 0.271 0.049 0.052 0.013 0.015 0.005Dhanusa 1708 62122 0.271 0.043 0.055 0.012 0.017 0.004Dhanusa 1709 39765 0.225 0.036 0.042 0.009 0.012 0.003Dhanusa 1710 44410 0.224 0.033 0.044 0.009 0.013 0.003Dhanusa 1711 25417 0.300 0.051 0.063 0.015 0.019 0.006Dhanusa 1712 29839 0.312 0.054 0.065 0.016 0.020 0.006Dhanusa 1713 13566 0.228 0.064 0.043 0.016 0.012 0.006Dhanusa 1714 17418 0.169 0.050 0.030 0.011 0.008 0.004Dhanusa 1715 45196 0.176 0.032 0.031 0.008 0.009 0.003Dhanusa 1716 56351 0.193 0.037 0.036 0.009 0.010 0.003Dhanusa 1717 46146 0.151 0.037 0.025 0.008 0.007 0.002Dhanusa 1718 97642 0.150 0.029 0.031 0.008 0.010 0.003Mahottari 1801 49503 0.077 0.025 0.014 0.006 0.004 0.002Mahottari 1802 38789 0.174 0.042 0.038 0.012 0.013 0.005Mahottari 1803 36939 0.183 0.041 0.041 0.013 0.014 0.005Mahottari 1804 41471 0.120 0.032 0.025 0.009 0.008 0.003Mahottari 1805 37629 0.146 0.037 0.032 0.011 0.010 0.004Mahottari 1806 16157 0.137 0.039 0.029 0.011 0.009 0.004Mahottari 1807 41174 0.192 0.044 0.043 0.013 0.014 0.006Mahottari 1808 35140 0.165 0.039 0.035 0.011 0.012 0.005Mahottari 1809 42409 0.177 0.039 0.039 0.012 0.013 0.005Mahottari 1810 51140 0.165 0.042 0.034 0.012 0.011 0.005Mahottari 1811 46667 0.142 0.038 0.028 0.010 0.009 0.004Mahottari 1812 36043 0.198 0.049 0.043 0.014 0.014 0.006Mahottari 1813 41897 0.208 0.045 0.046 0.014 0.015 0.006Mahottari 1814 40411 0.159 0.033 0.034 0.010 0.011 0.004Mahottari 1815 42507 0.194 0.038 0.044 0.012 0.015 0.005Mahottari 1816 23147 0.161 0.044 0.037 0.014 0.013 0.006Sarlahi 1901 45608 0.126 0.026 0.025 0.007 0.008 0.003Sarlahi 1902 66320 0.142 0.030 0.026 0.007 0.007 0.002Sarlahi 1903 49401 0.204 0.040 0.041 0.011 0.013 0.004Sarlahi 1904 52694 0.089 0.022 0.016 0.005 0.004 0.002Sarlahi 1905 46555 0.176 0.037 0.035 0.010 0.010 0.003Sarlahi 1906 42034 0.187 0.037 0.037 0.009 0.011 0.003NEPAL <strong>Small</strong> <strong>Area</strong> <strong>Estimation</strong> <strong>of</strong> <strong>Poverty</strong>, 2011, Summary and Major Findings 25


