

Small Area Estimation of Poverty
Small Area Estimation of Poverty
Small Area Estimation of Poverty
- No tags were found...

Create successful ePaper yourself
Turn your PDF publications into a flip-book with our unique Google optimized e-Paper software.
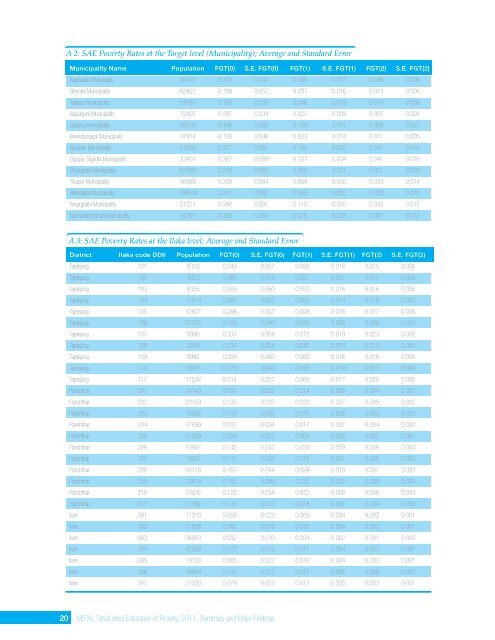
A 2: SAE <strong>Poverty</strong> Rates at the Target level (Municipality); Average and Standard ErrorMunicipality Name Population FGT(0) S.E. FGT(0) FGT(1) S.E. FGT(1) FGT(2) S.E. FGT(2)Kapilvastu Municipality 30410 0.319 0.042 0.090 0.017 0.036 0.008Ghorahi Municipality 62923 0.158 0.052 0.037 0.016 0.013 0.006Tulsipur Municipality 51537 0.192 0.059 0.046 0.018 0.016 0.008Nepalgunj Municipality 72407 0.097 0.034 0.022 0.009 0.007 0.004Gulariya Municipality 55516 0.496 0.082 0.159 0.041 0.068 0.022Birendranagar Municipality 47914 0.138 0.046 0.033 0.014 0.011 0.005Narayan Municipality 21069 0.377 0.081 0.105 0.032 0.041 0.015Dipayal Silgadhi Municipality 23401 0.387 0.088 0.107 0.034 0.041 0.016Dhangadhi Municipality 101887 0.228 0.063 0.058 0.021 0.021 0.009Tikapur Municipality 56089 0.339 0.084 0.089 0.030 0.033 0.014Bhimdatta Municipality 104544 0.241 0.062 0.065 0.022 0.025 0.010Amargadhi Municipality 21221 0.392 0.091 0.110 0.035 0.043 0.017Dasharathchanda Municipality 16791 0.303 0.084 0.075 0.028 0.027 0.012A 3: SAE <strong>Poverty</strong> Rates at the Ilaka level; Average and Standard ErrorDistrict Ilaka code DDII Population FGT(0) S.E. FGT(0) FGT(1) S.E. FGT(1) FGT(2) S.E. FGT(2)Taplejung 101 6310 0.249 0.057 0.050 0.016 0.015 0.006Taplejung 102 4023 0.286 0.075 0.057 0.021 0.017 0.008Taplejung 103 8325 0.269 0.060 0.053 0.016 0.016 0.006Taplejung 104 11514 0.265 0.053 0.053 0.014 0.016 0.005Taplejung 105 12627 0.288 0.057 0.058 0.016 0.017 0.006Taplejung 106 27273 0.163 0.040 0.030 0.009 0.009 0.003Taplejung 107 8996 0.337 0.064 0.073 0.019 0.023 0.008Taplejung 108 5936 0.234 0.054 0.045 0.014 0.013 0.005Taplejung 109 9992 0.293 0.056 0.060 0.016 0.018 0.006Taplejung 110 13876 0.370 0.060 0.083 0.019 0.027 0.008Taplejung 111 17532 0.314 0.057 0.066 0.017 0.020 0.006Panchthar 201 14140 0.091 0.032 0.014 0.006 0.004 0.002Panchthar 202 20159 0.126 0.033 0.020 0.007 0.005 0.002Panchthar 203 18902 0.103 0.030 0.016 0.006 0.004 0.002Panchthar 204 17899 0.107 0.034 0.017 0.007 0.004 0.002Panchthar 205 31269 0.058 0.022 0.009 0.005 0.002 0.001Panchthar 206 13947 0.145 0.042 0.024 0.009 0.006 0.003Panchthar 207 19927 0.112 0.032 0.018 0.007 0.005 0.002Panchthar 208 16118 0.162 0.044 0.028 0.010 0.007 0.003Panchthar 209 13419 0.183 0.049 0.032 0.012 0.009 0.004Panchthar 210 13432 0.125 0.034 0.022 0.008 0.006 0.003Panchthar 211 11182 0.110 0.037 0.018 0.007 0.004 0.002Ilam 301 11310 0.058 0.022 0.009 0.004 0.002 0.001Ilam 302 21506 0.062 0.019 0.010 0.004 0.002 0.001Ilam 303 36053 0.032 0.010 0.004 0.002 0.001 0.000Ilam 304 42389 0.072 0.019 0.011 0.004 0.003 0.001Ilam 305 19130 0.065 0.022 0.010 0.004 0.003 0.001Ilam 306 18854 0.102 0.027 0.017 0.006 0.005 0.002Ilam 307 21320 0.079 0.023 0.013 0.005 0.003 0.00120 NEPAL <strong>Small</strong> <strong>Area</strong> <strong>Estimation</strong> <strong>of</strong> <strong>Poverty</strong>, 2011, Summary and Major Findings


