

Small Area Estimation of Poverty
Small Area Estimation of Poverty
Small Area Estimation of Poverty
- No tags were found...

You also want an ePaper? Increase the reach of your titles
YUMPU automatically turns print PDFs into web optimized ePapers that Google loves.
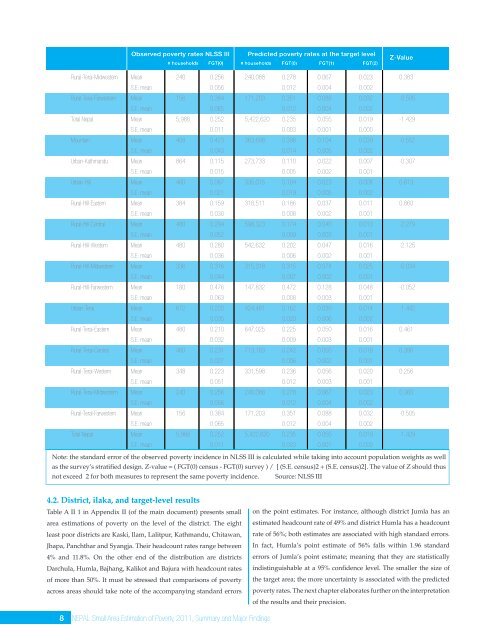
Observed poverty rates NLSS IIIPredicted poverty rates at the target level# households FGT(0) # households FGT(0) FGT(1) FGT(2)Z-ValueRural-Terai-Midwestern Mean 240 0.256 240,088 0.278 0.067 0.023 0.383S.E. mean 0.056 0.012 0.004 0.002Rural-Terai-Farwestern Mean 156 0.384 171,203 0.351 0.088 0.032 -0.505S.E. mean 0.065 0.012 0.004 0.002Total Nepal Mean 5,988 0.252 5,422,620 0.235 0.055 0.019 -1.429S.E. mean 0.011 0.003 0.001 0.000Mountain Mean 408 0.423 363,698 0.398 0.104 0.039 -0.552S.E. mean 0.043 0.014 0.005 0.002Urban-Kathmandu Mean 864 0.115 273,733 0.110 0.022 0.007 -0.307S.E. mean 0.015 0.005 0.002 0.001Urban-Hill Mean 480 0.087 335,015 0.104 0.023 0.008 0.613S.E. mean 0.021 0.019 0.005 0.002Rural-Hill-Eastern Mean 384 0.159 318,511 0.186 0.037 0.011 0.860S.E. mean 0.030 0.008 0.002 0.001Rural-Hill-Central Mean 480 0.294 598,323 0.174 0.040 0.013 -2.279S.E. mean 0.052 0.009 0.003 0.001Rural-Hill-Western Mean 480 0.280 542,632 0.202 0.047 0.016 -2.125S.E. mean 0.036 0.006 0.002 0.001Rural-Hill-Midwestern Mean 336 0.316 315,318 0.315 0.074 0.025 -0.034S.E. mean 0.044 0.007 0.002 0.001Rural-Hill-Farwestern Mean 180 0.476 147,832 0.472 0.128 0.048 -0.052S.E. mean 0.063 0.008 0.003 0.001Urban-Terai Mean 672 0.220 424,461 0.162 0.039 0.014 -1.442S.E. mean 0.035 0.020 0.006 0.002Rural-Terai-Eastern Mean 480 0.210 647,025 0.225 0.050 0.016 0.461S.E. mean 0.032 0.009 0.003 0.001Rural-Terai-Central Mean 480 0.231 713,183 0.242 0.055 0.018 0.390S.E. mean 0.027 0.006 0.002 0.001Rural-Terai-Western Mean 348 0.223 331,598 0.236 0.056 0.020 0.256S.E. mean 0.051 0.012 0.003 0.001Rural-Terai-Midwestern Mean 240 0.256 240,088 0.278 0.067 0.023 0.383S.E. mean 0.056 0.012 0.004 0.002Rural-Terai-Farwestern Mean 156 0.384 171,203 0.351 0.088 0.032 -0.505S.E. mean 0.065 0.012 0.004 0.002Total Nepal Mean 5,988 0.252 5,422,620 0.235 0.055 0.019 -1.429S.E. mean 0.011 0.003 0.001 0.000Note: the standard error <strong>of</strong> the observed poverty incidence in NLSS III is calculated while taking into account population weights as wellas the survey’s stratified design. Z-value = ( FGT(0) census - FGT(0) survey ) / √[ (S.E. census)2 + (S.E. census)2]. The value <strong>of</strong> Z should thusnot exceed │2│for both measures to represent the same poverty incidence. Source: NLSS III4.2. District, ilaka, and target-level resultsTable A II 1 in Appendix II (<strong>of</strong> the main document) presents smallarea estimations <strong>of</strong> poverty on the level <strong>of</strong> the district. The eightleast poor districts are Kaski, Ilam, Lalitpur, Kathmandu, Chitawan,Jhapa, Panchthar and Syangja. Their headcount rates range between4% and 11.8%. On the other end <strong>of</strong> the distribution are districtsDarchula, Humla, Bajhang, Kalikot and Bajura with headcount rates<strong>of</strong> more than 50%. It must be stressed that comparisons <strong>of</strong> povertyacross areas should take note <strong>of</strong> the accompanying standard errorson the point estimates. For instance, although district Jumla has anestimated headcount rate <strong>of</strong> 49% and district Humla has a headcountrate <strong>of</strong> 56%; both estimates are associated with high standard errors.In fact, Humla’s point estimate <strong>of</strong> 56% falls within 1.96 standarderrors <strong>of</strong> Jumla’s point estimate; meaning that they are statisticallyindistinguishable at a 95% confidence level. The smaller the size <strong>of</strong>the target area; the more uncertainty is associated with the predictedpoverty rates. The next chapter elaborates further on the interpretation<strong>of</strong> the results and their precision.8 NEPAL <strong>Small</strong> <strong>Area</strong> <strong>Estimation</strong> <strong>of</strong> <strong>Poverty</strong>, 2011, Summary and Major Findings


