

Small Area Estimation of Poverty
Small Area Estimation of Poverty
Small Area Estimation of Poverty
- No tags were found...

Create successful ePaper yourself
Turn your PDF publications into a flip-book with our unique Google optimized e-Paper software.
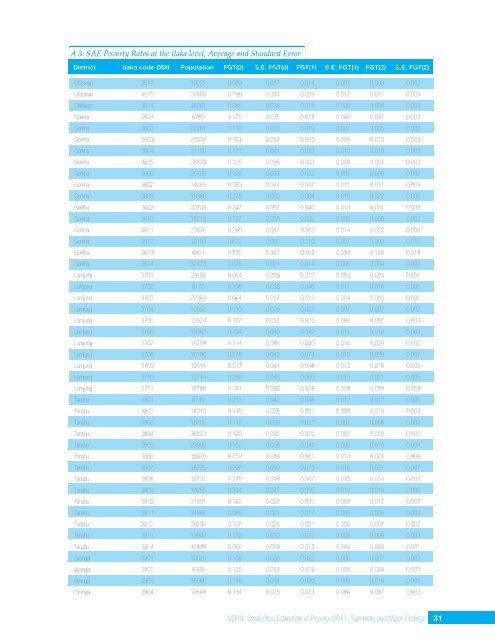
A 3: SAE <strong>Poverty</strong> Rates at the Ilaka level; Average and Standard ErrorDistrict Ilaka code DDII Population FGT(0) S.E. FGT(0) FGT(1) S.E. FGT(1) FGT(2) S.E. FGT(2)Chitawan 3512 19222 0.089 0.037 0.014 0.007 0.003 0.002Chitawan 3513 37680 0.199 0.044 0.039 0.012 0.011 0.004Chitawan 3514 46281 0.085 0.038 0.015 0.009 0.004 0.003Gorkha 3601 6789 0.125 0.035 0.023 0.008 0.007 0.003Gorkha 3602 22261 0.110 0.033 0.019 0.007 0.005 0.002Gorkha 3603 20547 0.163 0.037 0.032 0.009 0.010 0.003Gorkha 3604 21180 0.171 0.041 0.033 0.010 0.010 0.003Gorkha 3605 26323 0.125 0.035 0.023 0.008 0.007 0.003Gorkha 3606 26708 0.122 0.033 0.022 0.007 0.006 0.002Gorkha 3607 14285 0.189 0.044 0.037 0.011 0.011 0.004Gorkha 3608 15368 0.278 0.052 0.064 0.016 0.022 0.006Gorkha 3609 20748 0.347 0.057 0.086 0.019 0.031 0.008Gorkha 3610 18218 0.127 0.035 0.022 0.008 0.006 0.002Gorkha 3611 23876 0.260 0.047 0.062 0.014 0.022 0.006Gorkha 3612 13193 0.632 0.050 0.210 0.027 0.092 0.015Gorkha 3613 6901 0.716 0.047 0.263 0.030 0.123 0.018Gorkha 3614 32473 0.076 0.021 0.014 0.005 0.004 0.002Lamjung 3701 29100 0.064 0.016 0.013 0.004 0.004 0.001Lamjung 3702 8175 0.198 0.038 0.046 0.011 0.016 0.005Lamjung 3703 22364 0.064 0.017 0.012 0.004 0.003 0.001Lamjung 3704 10852 0.110 0.028 0.021 0.007 0.007 0.002Lamjung 3705 10524 0.127 0.031 0.025 0.008 0.007 0.003Lamjung 3706 10363 0.194 0.040 0.042 0.011 0.014 0.004Lamjung 3707 18759 0.314 0.048 0.080 0.016 0.029 0.007Lamjung 3708 16196 0.278 0.043 0.074 0.015 0.029 0.007Lamjung 3709 10315 0.213 0.044 0.048 0.013 0.016 0.005Lamjung 3710 12714 0.259 0.046 0.060 0.013 0.021 0.005Lamjung 3711 16788 0.141 0.036 0.028 0.009 0.009 0.003Tanahu 3801 8749 0.213 0.042 0.048 0.012 0.017 0.005Tanahu 3802 14010 0.148 0.035 0.031 0.009 0.010 0.003Tanahu 3803 18702 0.112 0.029 0.021 0.007 0.006 0.002Tanahu 3804 38503 0.120 0.026 0.025 0.007 0.008 0.002Tanahu 3805 23909 0.167 0.028 0.041 0.009 0.015 0.004Tanahu 3806 18079 0.259 0.046 0.061 0.014 0.021 0.006Tanahu 3807 16725 0.297 0.050 0.073 0.016 0.027 0.007Tanahu 3808 16731 0.278 0.048 0.067 0.015 0.024 0.007Tanahu 3809 19255 0.244 0.047 0.055 0.014 0.019 0.005Tanahu 3810 21891 0.162 0.032 0.035 0.009 0.012 0.003Tanahu 3811 34886 0.086 0.021 0.017 0.005 0.005 0.002Tanahu 3812 26234 0.107 0.026 0.021 0.006 0.007 0.002Tanahu 3813 19944 0.132 0.030 0.027 0.008 0.009 0.003Tanahu 3814 42899 0.065 0.015 0.013 0.004 0.004 0.001Syangja 3901 10025 0.108 0.026 0.022 0.006 0.007 0.002Syangja 3902 6329 0.135 0.031 0.028 0.008 0.009 0.003Syangja 3903 16566 0.146 0.034 0.030 0.009 0.010 0.003Syangja 3904 19660 0.114 0.025 0.023 0.006 0.007 0.002NEPAL <strong>Small</strong> <strong>Area</strong> <strong>Estimation</strong> <strong>of</strong> <strong>Poverty</strong>, 2011, Summary and Major Findings 31


