Create successful ePaper yourself
Turn your PDF publications into a flip-book with our unique Google optimized e-Paper software.
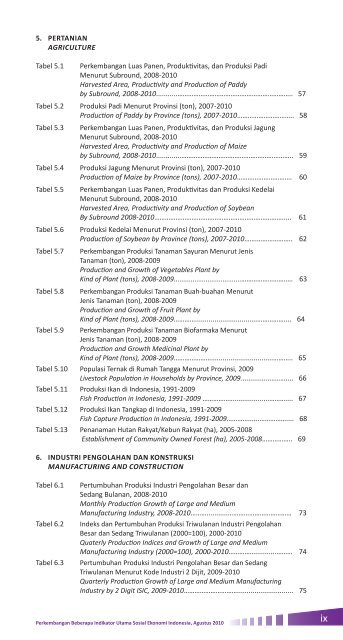
5. PertanianagricultureTabel 5.1Perkembangan Luas Panen, Produktivitas, dan Produksi PadiMenurut Subround, 2008-<strong>2010</strong>Harvested Area, Productivity and Production of Paddyby Subround, 2008-<strong>2010</strong>...........……………………………………………………….. 57Tabel 5.2 Produksi Padi Menurut Provinsi (ton), 2007-<strong>2010</strong>Production of Paddy by Province (tons), 2007-<strong>2010</strong>………………………….. 58Tabel 5.3Perkembangan Luas Panen, Produktivitas, dan Produksi JagungMenurut Subround, 2008-<strong>2010</strong>Harvested Area, Productivity and Production of Maizeby Subround, 2008-<strong>2010</strong>.............…………………………………………….……….. 59Tabel 5.4 Produksi Jagung Menurut Provinsi (ton), 2007-<strong>2010</strong>Production of Maize by Province (tons), 2007-<strong>2010</strong>…………………………. 60Tabel 5.5Perkembangan Luas Panen, Produktivitas dan Produksi KedelaiMenurut Subround, 2008-<strong>2010</strong>Harvested Area, Productivity and Production of SoybeanBy Subround 2008-<strong>2010</strong>………………………………………………………………..... 61Tabel 5.6 Produksi Kedelai Menurut Provinsi (ton), 2007-<strong>2010</strong>Production of Soybean by Province (tons), 2007-<strong>2010</strong>…….……………….. 62Tabel 5.7Perkembangan Produksi Tanaman Sayuran Menurut JenisTanaman (ton), 2008-2009Production and Growth of Vegetables Plant byKind of Plant (tons), 2008-2009....................................…………………….…. 63Tabel 5.8 Perkembangan Produksi Tanaman Buah-buahan MenurutJenis Tanaman (ton), 2008-2009Production and Growth of Fruit Plant byKind of Plant (tons), 2008-2009…………................................…………….... 64Tabel 5.9 Perkembangan Produksi Tanaman Biofarmaka MenurutJenis Tanaman (ton), 2008-2009Production and Growth Medicinal Plant byKind of Plant (tons), 2008-2009…………………................................……….. 65Tabel 5.10 Populasi Ternak di Rumah Tangga Menurut Provinsi, 2009Livestock Population in Households by Province, 2009...............……….... 66Tabel 5.11 Produksi Ikan di Indonesia, 1991-2009Fish Production in Indonesia, 1991-2009 ………………..................……….... 67Tabel 5.12 Produksi Ikan Tangkap di Indonesia, 1991-2009Fish Capture Production In Indonesia, 1991-2009…………......…………….... 68Tabel 5.13 Penanaman Hutan Rakyat/Kebun Rakyat (ha), 2005-2008Establishment of Community Owned Forest (ha), 2005-2008…………….. 696. Industri Pengolahan dan KonstruksiManufacturing and ConstructionTabel 6.1Tabel 6.2Tabel 6.3Pertumbuhan Produksi Industri Pengolahan Besar danSedang Bulanan, 2008-<strong>2010</strong>Monthly Production Growth of Large and MediumManufacturing Industry, 2008-<strong>2010</strong>………...........……………………………… 73Indeks dan Pertumbuhan Produksi Triwulanan Industri PengolahanBesar dan Sedang Triwulanan (2000=100), 2000-<strong>2010</strong>Quaterly Production Indices and Growth of Large and MediumManufacturing Industry (2000=100), 2000-<strong>2010</strong>……………...........……… 74Pertumbuhan Produksi Industri Pengolahan Besar dan SedangTriwulanan Menurut Kode Industri 2 Dijit, 2009-<strong>2010</strong>Quarterly Production Growth of Large and Medium ManufacturingIndustry by 2 Digit ISIC, 2009-<strong>2010</strong>…………………………............................. 75Perkembangan Beberapa Indikator Utama Sosial Ekonomi Indonesia, Agustus <strong>2010</strong>ix


