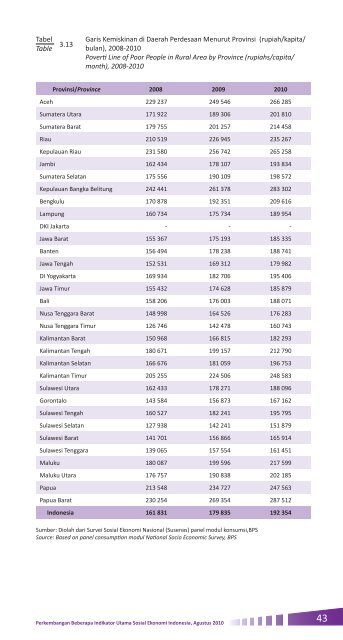
TabelTable 3.13Garis Kemiskinan di Daerah Perdesaan Menurut Provinsi (rupiah/kapita/bulan), 2008-<strong>2010</strong>Poverti Line of Poor People in Rural Area by Province (rupiahs/capita/month), 2008-<strong>2010</strong>Provinsi/Province 2008 2009 <strong>2010</strong>Aceh 229 237 249 546 266 285Sumatera Utara 171 922 189 306 201 810Sumatera Barat 179 755 201 257 214 458Riau 210 519 226 945 235 267Kepulauan Riau 231 580 256 742 265 258Jambi 162 434 178 107 193 834Sumatera Selatan 175 556 190 109 198 572Kepulauan Bangka Belitung 242 441 261 378 283 302Bengkulu 170 878 192 351 209 616Lampung 160 734 175 734 189 954DKI Jakarta - - -Jawa Barat 155 367 175 193 185 335Banten 156 494 178 238 188 741Jawa Tengah 152 531 169 312 179 982DI Yogyakarta 169 934 182 706 195 406Jawa Timur 155 432 174 628 185 879Bali 158 206 176 003 188 071Nusa Tenggara Barat 148 998 164 526 176 283Nusa Tenggara Timur 126 746 142 478 160 743Kalimantan Barat 150 968 166 815 182 293Kalimantan Tengah 180 671 199 157 212 790Kalimantan Selatan 166 676 181 059 196 753Kalimantan Timur 205 255 224 506 248 583Sulawesi Utara 162 433 178 271 188 096Gorontalo 143 584 156 873 167 162Sulawesi Tengah 160 527 182 241 195 795Sulawesi Selatan 127 938 142 241 151 879Sulawesi Barat 141 701 156 866 165 914Sulawesi Tenggara 139 065 157 554 161 451Maluku 180 087 199 596 217 599Maluku Utara 176 757 190 838 202 185Papua 213 548 234 727 247 563Papua Barat 230 254 269 354 287 512Indonesia 161 831 179 835 192 354Sumber: Diolah dari Survei Sosial Ekonomi Nasional (Susenas) panel modul konsumsi,BPSSource: Based on panel consumption modul National Socio Economic Survey, BPSPerkembangan Beberapa Indikator Utama Sosial Ekonomi Indonesia, Agustus <strong>2010</strong>43
TabelTable 3.14Indeks Kedalaman Kemiskinan dan Indeks Keparahan KemiskinanMenurut Daerah, 1999-<strong>2010</strong>Poverty Gap Index and Poverty Severity Index by Region, 1999-<strong>2010</strong>TahunYearIndeks Kedalaman KemiskinanPoverty Gap IndexKotaUrbanDesaRuralKota + DesaUrban +RuralIndeks Keparahan KemiskinanPoverty Severity IndexKotaUrbanDesaRuralKota + DesaUrban +Rural1999 3,52 4,84 4,33 0,98 1,39 1,232000 1,89 4,68 3,51 0,51 1,39 1,022001 1,74 4,68 3,42 0,45 1,36 0,972002 2,59 3,34 3,01 0,71 0,85 0,792003 2,55 3,53 3,13 0,74 0,93 0,852004 2,18 3,43 2,89 0,58 0,90 0,782005 2,05 3,34 2,78 0,60 0,89 0,762006 2,61 4,22 3,43 0,77 1,22 1,002007 2,15 3,78 2,99 0,57 1,09 0,842008 2,07 3,42 2,77 0,56 0,95 0,762009 1,91 3,05 2,50 0,52 0,82 0,68<strong>2010</strong> 1,57 2,80 2,21 0,40 0,75 0,58Sumber: Diolah dari Survei Sosial Ekonomi Nasional (Susenas) Panel, BPSSource: Based on Panel National Socio Economic Survey, BPS - Statistics IndonesiaCatatan:• Indeks Kedalaman Kemiskinan (P1) merupakan ukuran rata-rata kesenjangan pengeluaran masingmasingpenduduk miskin terhadap garis kemiskinan. Semakin tinggi nilai indeks, semakin jauh rata-ratapengeluaran penduduk dari garis kemiskinan.• Indeks Keparahan Kemiskinan (P2) memberikan gambaran mengenai penyebaran pengeluaran diantarapenduduk miskin, semakin tinggi nilai indeks, semakin tinggi ketimpangan pengeluaran diantara pendudukmiskin.Note:• Poverty Gap Index (P1) measures the extent to which individuals fall below the poverty line (the povertygaps) as a proportion of the poverty line. Higher value of the index shows that the gap between averageexpenditure of the poor and the poverty line is wider.• Poverty Severity Index (P2) describes inequality among the poor. This is simple a weighted sum of povertygaps themselves. Hence, by squaring the poverty gap index, the measure implicitly puts more weighton observations that fall well below the poverty line. Higher value of the index shows that inequalityamong the poor is higher.44Trends of the Selected Indicators Social Economic of Indonesia, August <strong>2010</strong>