


Create successful ePaper yourself
Turn your PDF publications into a flip-book with our unique Google optimized e-Paper software.
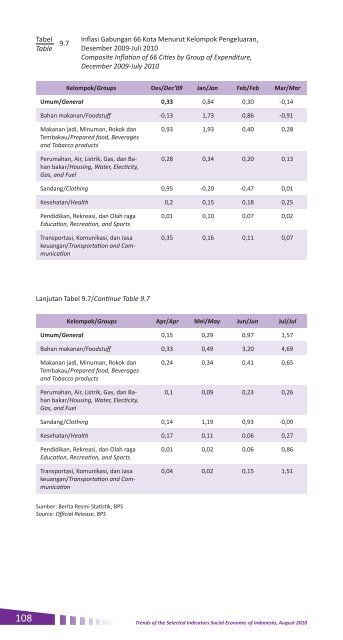
TabelInflasi Gabungan 66 Kota Menurut Kelompok Pengeluaran,Desember 2009-Juli <strong>2010</strong>Composite Inflation of 66 Cities by Group of Expenditure,December 2009-July <strong>2010</strong>Table 9.7 Kelompok/Groups Des/Dec’09 Jan/Jan Feb/Feb Mar/MarUmum/General 0,33 0,84 0,30 -0,14Bahan makanan/Foodstuff -0,13 1,73 0,86 -0,91Makanan jadi, Minuman, Rokok danTembakau/Prepared food, Beveragesand Tobacco productsPerumahan, Air, Listrik, Gas, dan Bahanbakar/Housing, Water, Electicity,Gas, and Fuel0,93 1,93 0,40 0,280,28 0,34 0,20 0,13Sandang/Clothing 0,95 -0,20 -0,47 0,01Kesehatan/Health 0,2 0,15 0,18 0,25Pendidikan, Rekreasi, dan Olah ragaEducation, Recreation, and SportsTransportasi, Komunikasi, dan Jasakeuangan/Transportation and Communication0,01 0,10 0,07 0,020,35 0,16 0,11 0,07Lanjutan Tabel 9.7/Continue Table 9.7Kelompok/Groups Apr/Apr Mei/May Jun/Jun Jul/JulUmum/General 0,15 0,29 0,97 1,57Bahan makanan/Foodstuff 0,33 0,49 3,20 4,69Makanan jadi, Minuman, Rokok danTembakau/Prepared food, Beveragesand Tobacco productsPerumahan, Air, Listrik, Gas, dan Bahanbakar/Housing, Water, Electicity,Gas, and Fuel0,24 0,34 0,41 0,650,1 0,09 0,23 0,26Sandang/Clothing 0,14 1,19 0,93 -0,09Kesehatan/Health 0,17 0,11 0,06 0,27Pendidikan, Rekreasi, dan Olah ragaEducation, Recreation, and SportsTransportasi, Komunikasi, dan Jasakeuangan/Transportation and Communication0,01 0,02 0,06 0,860,04 0,02 0,15 1,51Sumber: Berita Resmi <strong>Statistik</strong>, BPSSource: Official Release, BPS108Trends of the Selected Indicators Social Economic of Indonesia, August <strong>2010</strong>


