Effetti a breve e a lungo termine dell'inquinamento atmosferico sulla ...
Effetti a breve e a lungo termine dell'inquinamento atmosferico sulla ...
Effetti a breve e a lungo termine dell'inquinamento atmosferico sulla ...

Create successful ePaper yourself
Turn your PDF publications into a flip-book with our unique Google optimized e-Paper software.
<strong>Effetti</strong> a <strong>breve</strong> e a <strong>lungo</strong> <strong>termine</strong><br />
dell’inquinamento <strong>atmosferico</strong> <strong>sulla</strong><br />
salute umana<br />
Paolo Crosignani<br />
Unità di Epidemiologia Ambientale e Registro<br />
Tumori<br />
Istituto Nazionale per lo studio e la cura dei<br />
Tumori, Milano
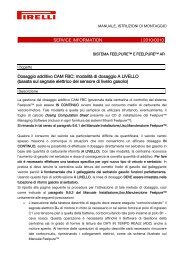
Principali fonti di emissione del<br />
particolato <strong>atmosferico</strong><br />
Emissioni in provincia di Milano<br />
Inventario delle emissioni<br />
(INEMAR 2001)<br />
PM10<br />
Produzione energia e trasform. combustibili<br />
Combustione non industriale<br />
Combustione nell'industria<br />
Processi produttivi<br />
Estrazione e distribuzione combustibili<br />
4%<br />
Uso di solventi<br />
70%<br />
12%<br />
Trasporto su strada<br />
Altre sorgenti mobili e macchinari<br />
Trattamento e smaltimento rifiuti<br />
Agricoltura<br />
1% 4%<br />
3%<br />
Altre sorgenti e assorbimenti
Distribuzione del particolato<br />
<strong>atmosferico</strong>
Frazioni dimensionali del particolato<br />
“Frazione inalabile”: la massa delle particelle aerodisperse totali<br />
che penetra attraverso il naso e la bocca e penetra nella regione<br />
toracica < 10 µm<br />
“Frazione toracica”: la massa delle particelle aerodisperse che<br />
penetra oltre la laringe 2.5 µm m < dae < 10 µm<br />
“Frazione respirabile”: la massa delle particelle aerodisperse che<br />
penetra oltre le vie respiratorie prive di cilia vibratili<br />
0.1 µm m < dae < 2.5 µm
Classificazione polveri nell’<br />
apparato respiratorio<br />
PTS<br />
PM 10<br />
PM 2.5
<strong>Effetti</strong> a <strong>breve</strong> <strong>termine</strong><br />
Serie Temporali: Misure dirette, relazione con PM 10 ed<br />
altri inquinanti<br />
(approccio “ at least ”)<br />
‣ mortalità per tutte le cause naturali<br />
‣ mortalità per cause respiratorie<br />
‣ mortalità per cause cardiache<br />
‣ ricoveri per malattie respiratorie<br />
‣ ricoveri per malattie cardiache
Parametri OMS per effetti a <strong>breve</strong><br />
<strong>termine</strong><br />
• Mortalità totale, (esclusi gli incidenti) 1.006<br />
• Mortalità per cause cardiovascolari 1.009<br />
• Mortalità per cause respiratorie 1.013<br />
• Ospedalizzazione cause cardiache 1.003<br />
• Ospedalizzazione cause respiratorie 1.006
<strong>Effetti</strong> a <strong>breve</strong> <strong>termine</strong><br />
Se esiste proporzionalità tra effetti e livelli di<br />
particolato si ha:<br />
Numero eventi “anticipati” =<br />
Incidenza di base<br />
x<br />
rischio stimato dalle “serie temporali”<br />
x<br />
livelli dell’inquinante rispetto al target
COME IL PM PUÒ DANNEGGIARE LE VIE<br />
RESPIRATORIE ED IL SISTEMA CARDIOVASCOLARE<br />
Vie nervose (sistema<br />
nervoso autonomo)<br />
Alterazioni elettrofisiologiche<br />
cardiache<br />
(alterazioni di HRV e<br />
segmenti ECG)<br />
Particelle depositate<br />
nelle vie<br />
respiratorie<br />
Attivazione delle cellule<br />
delle vie respiratorie<br />
Infiammazione<br />
Circolazione e tessuti<br />
esterni delle vie respiratorie<br />
Attivazione leucocitaria<br />
e infiammazione<br />
Alterazioni della<br />
funzione respiratoria<br />
Induzione della risposta di<br />
fase acuta (proteina C-<br />
reattiva),aumento del<br />
fibrinogeno e della<br />
coagulabilità<br />
Eventi cardiaci (infarto miocardico,<br />
aritmia, e/o morte, dipendente dallo stato<br />
del paziente)<br />
Trombosi
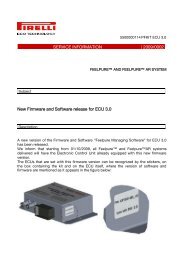
Curva dose-risposta tra la concentrazione<br />
di PM 10 e la mortalità giornaliera in 10 città<br />
degli Stati Uniti<br />
Schwartz e Zanobetti
Andamento della mortalità nel caso di anticipazione dei<br />
decessi non evitabili<br />
Numero decessi<br />
Aumento inquinanti<br />
Tempo (gg)
Titolo………………………………………….epidemiology…
<strong>Effetti</strong> a <strong>breve</strong> e <strong>lungo</strong> <strong>termine</strong> dell’inquinamento sullo stato di<br />
salute dell’uomo
Principali studi prospettici sull’inquinamento<br />
da PM 10<br />
Studio<br />
Pubblicazione<br />
Inizio<br />
Fine<br />
N°<br />
partecipanti<br />
Dockery DW, et al.<br />
6 città U.S.A.<br />
An association between air<br />
pollution and mortality in six<br />
US cities. N Engl J Med<br />
1993, 329:1753-1759.<br />
1974<br />
1991<br />
8.111<br />
Pope CA 3rd, et al.<br />
50 Stati U.S.A.<br />
Lung Cancer,<br />
Cardiopulmonary Mortality,<br />
and Long-term Exposure to<br />
fine Particulate Air Pollution.<br />
JAMA 2002, 287:1132¯1141.<br />
1982<br />
1998<br />
1.200.000<br />
Istituto Nazionale per lo Studio e<br />
la Cura dei Tumori,Milano
Tab.1 – Stima degli effetti a <strong>lungo</strong> <strong>termine</strong> causati<br />
dal particolato <strong>atmosferico</strong> PM 10<br />
C. Arden Pope III (JAMA, 2002 – Vol. 287, No. 9)
Sopravvivenza nello studio delle 6 città, da Dockery, 1993
Distribuzione della popolazione esposta al PM 10<br />
(Kunzli, et al, Lancet 2000)<br />
Classe di concentrazione Distribuzione della popolazione esposta al PM 10 totale<br />
del PM 10 (µg / m 3 )<br />
Austria Francia Svizzera<br />
0-5 0 0.2% 0<br />
>5-10 0 0.5% 1.2%<br />
>10-15 11.4% 5.2% 5.7%<br />
>15-20 14.2% 31.5% 31.8%<br />
>20-25 22.8% 33.3% 42.5%<br />
>25-30 27.7% 12.8% 14.6%<br />
>30-35 8.5% 7.8% 3.0%<br />
>35-40 4.7% 4.1% 0.9%<br />
>40 10.7% 4.6% 0.3%<br />
Media 26.0 23.5 21.4
Riepilogo dei principali effetti dell’inquinamento a Milano<br />
Rispetto a 30 ug/m 3<br />
Mortalità per cause naturali<br />
per una permanenza di 10-20 anni<br />
Tumori del polmone<br />
1575<br />
160<br />
Mortalità per cause naturali<br />
effetti immediati<br />
193<br />
Ricoveri / anno per cause<br />
respiratorie 440<br />
Ricoveri / anno per cause<br />
cardiache<br />
Nuovi casi / anno di bronchite<br />
cronica<br />
Episodi di bronchite acuta nei<br />
bambini<br />
710<br />
155<br />
6100<br />
Attacchi di asma nei bambini 5537<br />
Attacchi di asma negli adulti<br />
Giorni di attività lavorativa<br />
persi<br />
2785<br />
675957
Tumori respiratori: effetti a <strong>lungo</strong> <strong>termine</strong><br />
‣ etiologia multifattoriale (fumo, esp. Professionale, Rn)<br />
‣ lunga latenza<br />
‣ esposizione cumulativa
Tumore del Polmone in Lombardia: Popolazione<br />
maschile<br />
Istituto Nazionale per lo Studio e<br />
la Cura dei Tumori,Milano
Tumore del Polmone in Lombardia: Popolazione<br />
femminile<br />
Istituto Nazionale per lo Studio e<br />
la Cura dei Tumori,Milano
Inquinamento <strong>atmosferico</strong>:<br />
Quanti tumori al polmone a Milano?<br />
1) I livello medio annuo di PM10 è stato calcolato in 60 µg/m³ a<br />
Milano nel 2002 (Progetto PUMI ARPA LOMBARDIA – FLA,<br />
Marzo 2003); PM 2.5= 60*0.8= 48<br />
2) Il totale dei tumori al polmone nella città di Milano è in media di<br />
997 l’annol<br />
anno.<br />
3) Si considera come TARGET un livello di PM 10<br />
corrispondente a un livello di PM 2.5<br />
= 30 µg/m³<br />
= 24 µg/m³<br />
4) rischio relativo (RR) PM 2.5<br />
RR = (48-24)/10 * (1.08-1) + 1 = 1.19<br />
rischio attribuibile (RA) PM 2.5<br />
RA = (RR-1)/RR*100 = 16% totale = 160 morti
Studi prospettici europei<br />
Hoek et al.,<br />
2002, EPIC<br />
cohort, the<br />
Netherlands<br />
MF, 55-69<br />
60<br />
BS, 10 µg/m3<br />
1.06 (0.43-2.63)<br />
Filleul et al.,<br />
2005, PAARC<br />
cohort, France<br />
MF, 25-59<br />
175<br />
BS, 10 µg/m3<br />
(24 areas)<br />
0.97 (0.93-1.01)<br />
Vineis et al.,<br />
2006, casecontrol<br />
nested<br />
in the EPIC<br />
cohort, 7<br />
European<br />
countries<br />
MF, 35-74<br />
Non- or exsmokers<br />
113<br />
PM10, 10<br />
µg/m3<br />
0.91 (0.70-1.18)<br />
Naess et al.,<br />
2007, cohort,<br />
Norway<br />
M, 51-70<br />
449<br />
PM2.5, quartile<br />
increase<br />
1.07 (0.97-1.18)<br />
F, 51-70<br />
295<br />
1.27 (1.13-1.43)
Risultati<br />
BENZENE<br />
(µg/m 3 )<br />
CASI CONTR. OR 95% CI<br />
< 0.1 88 399 1<br />
0.1 – 10 25 73 1.51 0.91 – 2.51<br />
> 10 7 8 3.91 1.36 – 11.27<br />
TOT 120 480<br />
p per il trend = 0.005<br />
Odds Ratio calcolati usando un modello di regressione<br />
logistica ed un’analisi matched per sesso ed età
TABLE 2 – Associations Between Pollutants and Respiratory<br />
Health Outcomes the Children’s Health Study<br />
Respiratory Health<br />
Outcome<br />
Associated<br />
Pollutants a<br />
Study<br />
Slowed lung growth<br />
Asthma causation<br />
Asthma exacerbation<br />
Acute respiratory illness<br />
NO 2 , PM 10 , PM 2.5 , HNO 3<br />
O 3<br />
NO 2 , PM 10<br />
O 3<br />
Gauderman et al. 10,15 ;<br />
Avol et al. 18<br />
McConnell et al. 21<br />
McConnell et al. 19<br />
Gilliland et al. 12<br />
a<br />
Main pollutants provided in the analyses. Pollutants were usually highly correlated;<br />
Thus, effects may be due to mixtures.<br />
(Kuenzli et al. 2003 AJPH 93,1494)
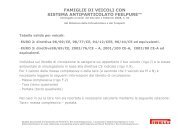
COPERT III – Stima dell’ emissione di PM 10 di<br />
autovetture a motore diesel in base alla velocità<br />
grammi<br />
0.6<br />
0.5<br />
0.4<br />
0.3<br />
0.2<br />
0.1<br />
0.0<br />
5 Km/h (coda)<br />
15 Km/h<br />
DIESEL CARS PM 10 g/Km/h<br />
25 Km/h<br />
40 Km/h<br />
60 Km/h<br />
80 Km/h<br />
Velocità Km/h<br />
100 Km/h<br />
120 Km/h<br />
140 Km/h<br />
Diesel cars Pre-Euro I < 2.0 l<br />
Diesel cars Pre-Euro I > 2.0 l<br />
Diesel cars Pre-Euro I > 2.0 l<br />
Diesel cars Euro I < 2.0 l<br />
Diesel cars Euro I > 2.0 l<br />
Diesel cars Euro I > 2.0 l<br />
Diesel cars Euro II < 2.0 l<br />
Diesel cars Euro II > 2.0 l<br />
Diesel cars Euro II > 2.0 l<br />
Diesel cars Euro III < 2.0 l<br />
Diesel cars Euro III > 2.0 l<br />
Diesel cars Euro III > 2.0 l<br />
Diesel cars Euro III + trap < 2.0 l<br />
Diesel cars Euro III + trap > 2.0 l<br />
Diesel cars Euro III + trap > 2.0 l<br />
Diesel cars Euro IV < 2.0 l<br />
Diesel cars Euro IV > 2.0 l<br />
Diesel cars Euro IV > 2.0 l<br />
Diesel cars Euro IV+trap < 2.0 l<br />
Diesel cars Euro IV+trap > 2.0 l