La correlazione e la regressione - Scienze Politiche
La correlazione e la regressione - Scienze Politiche
La correlazione e la regressione - Scienze Politiche

Create successful ePaper yourself
Turn your PDF publications into a flip-book with our unique Google optimized e-Paper software.
Corre<strong>la</strong>zione<br />
Regressione<br />
<strong>La</strong> <strong>corre<strong>la</strong>zione</strong> e <strong>la</strong> <strong>regressione</strong><br />
Antonello Maruotti<br />
. . . . . .<br />
A. Maruotti
. . . . . .<br />
Outline<br />
1 Corre<strong>la</strong>zione<br />
2 Regressione
Corre<strong>la</strong>zione<br />
Regressione<br />
Associazione tra caratteri quantitativi<br />
Date due distribuzioni unitarie secondo caratteri quantitativi X e Y<br />
x 1 x 2 · · · x n<br />
y 1 y 2 · · · y n<br />
associate in modeo che nell’unità i-esima il carattere X è presente<br />
con <strong>la</strong> modalità x i ed il carattere Y con <strong>la</strong> modalità y i , per<br />
valutare l’associazione fra i due caratteri X e Y ricorriamo<br />
al<strong>la</strong> coviarianza<br />
al<strong>la</strong> <strong>corre<strong>la</strong>zione</strong><br />
A. Maruotti<br />
. . . . . .
Corre<strong>la</strong>zione<br />
Regressione<br />
<strong>La</strong> covarianza<br />
Definizione<br />
<strong>La</strong> covarianza è una misura del legame lineare tra due caratteri<br />
quantitativi X e Y . E’ data dal<strong>la</strong> media aritmetica del prodotto<br />
degli scarti di due caratteri dalle loro rispettive medie.<br />
σ XY = 1 n∑<br />
(x i − µ X )(y i − µ Y ) = 1 n∑<br />
x i y i − µ X µ Y<br />
n<br />
n<br />
i=1<br />
i=1<br />
. . . . . .<br />
A. Maruotti
Corre<strong>la</strong>zione<br />
Regressione<br />
<strong>La</strong> covarianza: osservazioni<br />
Osservazioni: quando scarti positivi (negativi) del carattere X<br />
tendono ad associarsi a scarti positivi (negativi) del<br />
carattere Y , allora i loro prodotti saranno positivi e <strong>la</strong><br />
covarianza risulterà positiva; quando scarti positivi<br />
del carattere X tendono ad associarsi a scarti negativi<br />
del carattere Y (o viceversa), allora i loro prodotti<br />
saranno negativi e <strong>la</strong> covarianza risulterà negativa.<br />
Minimo e massimo: non è un indice re<strong>la</strong>tivo<br />
−σ X σ Y ≤ σ XY ≤ σ X σ Y<br />
. . . . . .<br />
A. Maruotti
Corre<strong>la</strong>zione<br />
Regressione<br />
<strong>La</strong> <strong>corre<strong>la</strong>zione</strong><br />
Definizione<br />
Il coefficiente di <strong>corre<strong>la</strong>zione</strong> lineare è un indice che misura <strong>la</strong><br />
re<strong>la</strong>zione lineare tra due caratteri quantitativi X e Y . E’ espresso<br />
dal rapporto tra <strong>la</strong> covariaza tra i due caratteri X e Y ed il<br />
prodotto dei rispettivi scarti quadratici medi.<br />
r XY = σ XY<br />
σ X σ Y<br />
=<br />
√ 1<br />
n<br />
1<br />
∑ ni=1<br />
n<br />
(x i − µ X )(y i − µ Y )<br />
∑<br />
√ ni=1<br />
(x i − µ X ) 2 1 ∑ ni=1<br />
n<br />
(y i − µ Y ) 2<br />
. . . . . .<br />
A. Maruotti
Corre<strong>la</strong>zione<br />
Regressione<br />
<strong>La</strong> <strong>corre<strong>la</strong>zione</strong>: proprietà<br />
Il coefficiente di <strong>corre<strong>la</strong>zione</strong> è compreso tra -1 e 1.<br />
−1 ≤ r XY ≤ 1<br />
Se r XY = 0, allora non vi è re<strong>la</strong>zione di tipo lineare tra i due<br />
caratteri. Si noti che l’in<strong>corre<strong>la</strong>zione</strong> tra due caratteri implica<br />
<strong>corre<strong>la</strong>zione</strong> nul<strong>la</strong>, ma non è vero il contrario.<br />
Se r XY = ±1, allora esiste un legame lineare perfetto positivo<br />
(r XY = 1) o negativo r XY = −1<br />
Il coefficiente di <strong>corre<strong>la</strong>zione</strong> è invariante per trasformazioni<br />
lineari, a meno del segno.<br />
. . . . . .<br />
A. Maruotti
Corre<strong>la</strong>zione<br />
Regressione<br />
<strong>La</strong> <strong>corre<strong>la</strong>zione</strong>: fissiamo le idee<br />
Date due variabili quantitative, diremo che sono<br />
corre<strong>la</strong>te positivamente se variano in modo concorde, ossia<br />
all’aumentare [diminuire] dell’una aumenta<br />
[diminuisce] anche l’altra;<br />
corre<strong>la</strong>te negativamente se variano in modo discorde, ossia<br />
all’aumentare [diminuire] dell’una, l’altra diminuisce<br />
[aumenta]<br />
Osserviamo che due caratteri risultano concordi se gli scarti dal<strong>la</strong><br />
media tendono ad essere dello stesso segno mentre risultano<br />
discordi se tali scarti tendono ad essere di segno opposto.<br />
A. Maruotti<br />
. . . . . .
Corre<strong>la</strong>zione<br />
Regressione<br />
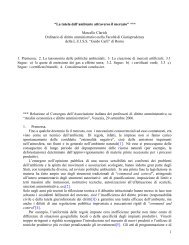
Obiettivo del<strong>la</strong> <strong>regressione</strong><br />
Obiettivo dell’analisi di <strong>regressione</strong> è studiare il legame che<br />
intercorre tra due variabili quantitative X e Y .<br />
Corre<strong>la</strong>zione =<br />
0.494<br />
Consumo<br />
1 2 3 4 5 6 7 8<br />
4 6 8 10 12<br />
Reddito<br />
. . . . . .<br />
A. Maruotti
Corre<strong>la</strong>zione<br />
Regressione<br />
Funzioni lineari<br />
Il legame tra due variabili viene espresso mediante una funzione del<br />
tipo<br />
y = f (x)<br />
Una delle funzioni più semplici è quel<strong>la</strong> lineare<br />
y = β 0 + β 1 x<br />
β 0 : valore di y per x = 0<br />
β 1 : variazione di y per un aumento unitario di x<br />
A. Maruotti<br />
. . . . . .
Corre<strong>la</strong>zione<br />
Regressione<br />
Modello di <strong>regressione</strong> lineare semplice<br />
Nel<strong>la</strong> realtà difficilmente due variabili sono legate da una re<strong>la</strong>zione<br />
esatta. Per ovviare a questo inconveniente adottiamo il modello<br />
y i = β 0 + β 1 x i + ϵ i<br />
dove<br />
β 0 = interecetta<br />
β 1 = coefficiente di regression (pendenza)<br />
y i = variabile risposta (dipendente)<br />
x i = variabile esplicativa (indipendente)<br />
ϵ i = residuo o errore (riflette le imperfezioni del<strong>la</strong> re<strong>la</strong>zione<br />
lineare ed eventuali variabili esplicative omesse)<br />
A. Maruotti<br />
. . . . . .
Corre<strong>la</strong>zione<br />
Regressione<br />
Stima dei parametri: metodo dei minimi quadrati<br />
Ipotizziamo che il termine residuale sia di minima entità.<br />
Determiniamo quindi <strong>la</strong> retta (ossia β 0 e β 1 ) in modo da rendere<br />
minima <strong>la</strong> somma<br />
n∑<br />
(y i − β o − β 1 x i ) 2<br />
i=1<br />
A. Maruotti<br />
. . . . . .
Corre<strong>la</strong>zione<br />
Regressione<br />
Soluzione del problema dei minimi quadrati<br />
Coefficiente di <strong>regressione</strong><br />
b 1 =<br />
∑ ni=1<br />
(x i − µ x )(y i − µ y )<br />
∑ ni=1<br />
(x i − µ x ) 2<br />
Intercetta<br />
b 0 = µ y − b 1 µ x<br />
<strong>La</strong> retta dei minimi quadrati passa per il baricentro (al<strong>la</strong><br />
media di x corrisponde <strong>la</strong> media di y)<br />
ŷ i = b 0 + b 1 x i<br />
. . . . . .<br />
A. Maruotti
Corre<strong>la</strong>zione<br />
Regressione<br />
Adattamento del modello ai dati<br />
Varianza totale<br />
Varianza spiegata<br />
Varianza residua<br />
1<br />
n<br />
1<br />
n<br />
1<br />
n<br />
Scomposizione del<strong>la</strong> varianza totale<br />
n∑<br />
(y i − µ y ) 2 = σy<br />
2<br />
i=1<br />
n∑<br />
(ŷ i − µ y ) 2 = σŷ<br />
2<br />
i=1<br />
n∑<br />
(y i − ŷ i ) 2 = 1 n∑<br />
ˆϵ 2 i = σ 2ˆϵ<br />
n<br />
i=1<br />
i=1<br />
σ 2 y = σ 2 ŷ + σ 2ˆϵ<br />
. . . . . .<br />
A. Maruotti
Corre<strong>la</strong>zione<br />
Regressione<br />
Coefficiente di determinazione<br />
Per avere un indice del<strong>la</strong> bontà di adattamento del modello ai dati<br />
calcoliamo il rapporto tra variabilità spiegata dal<strong>la</strong> <strong>regressione</strong> e<br />
variabilità totale<br />
r 2 =<br />
1<br />
n<br />
1<br />
n<br />
∑ ni=1<br />
(ŷ i − µ y ) 2<br />
∑ ni=1<br />
(y i − µ y ) = σ2 ŷ<br />
2 σy<br />
2<br />
<strong>La</strong> decomposizione del<strong>la</strong> devianza totale garantisce che r 2 varia tra<br />
0 (pessimo adattamento) e 1 (ottimo adattamento, <strong>la</strong> re<strong>la</strong>zione è<br />
perfettamente lineare).<br />
A. Maruotti<br />
. . . . . .