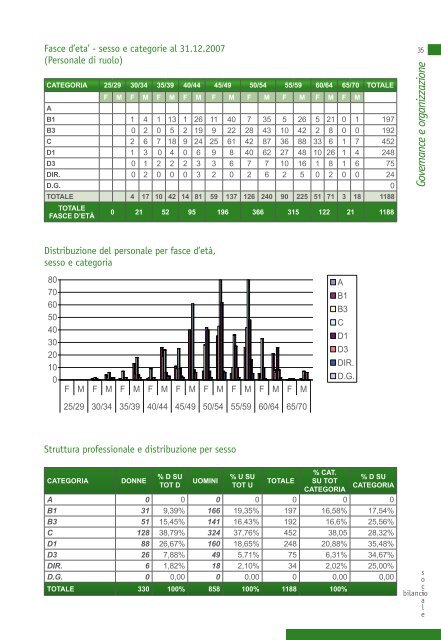
Fasce d’eta’ - sesso e categorie al 31.12.2007(Personale <strong>di</strong> ruolo)CATEGORIA 25/29 30/34 35/39 40/44 45/49 50/54 55/59 60/64 65/70 TOTALEAF M F M F M F M F M F M F M F M F MB1 1 4 1 13 1 26 11 40 7 35 5 26 5 21 0 1 197B3 0 2 0 5 2 19 9 22 28 43 10 42 2 8 0 0 192C 2 6 7 18 9 24 25 61 42 87 36 88 33 6 1 7 452D1 1 3 0 4 0 6 9 8 40 62 27 48 10 26 1 4 248D3 0 1 2 2 2 3 3 6 7 7 10 16 1 8 1 6 75DIR. 0 2 0 0 0 3 2 0 2 6 2 5 0 2 0 0 24D.G. 0TOTALE 4 17 10 42 14 81 59 137 126 240 90 225 51 71 3 18 1188TOTALEFASCE D’ETÀ0 21 52 95 196 366 315 122 21 118835<strong>Governance</strong> e <strong>organizzazione</strong>Distribuzione del personale per fasce d’età,sesso e categoria80706050403020100F M F M F M F M F M F M F M F M F M25/29 30/34 35/39 40/44 45/49 50/54 55/59 60/64 65/70AB1B3CD1D3DIR.D.G.Struttura professionale e <strong>di</strong>stribuzione per sessoCATEGORIADONNE% D SUTOT DUOMINI% U SUTOT UTOTALE% CAT.SU TOTCATEGORIA% D SUCATEGORIAA 0 0 0 0 0 0 0B1 31 9,39% 166 19,35% 197 16,58% 17,54%B3 51 15,45% 141 16,43% 192 16,6% 25,56%C 128 38,79% 324 37,76% 452 38,05 28,32%D1 88 26,67% 160 18,65% 248 20,88% 35,48%D3 26 7,88% 49 5,71% 75 6,31% 34,67%DIR. 6 1,82% 18 2,10% 34 2,02% 25,00%D.G. 0 0,00 0 0,00 0 0,00 0,00TOTALE 330 100% 858 100% 1188 100%socialebilancio
<strong>Governance</strong> e <strong>organizzazione</strong>36socialebilancio40,0035,0030,0025,0020,0015,0010,005,000,000,00 0,009,3919,35COLLABORAZIONI COORDINATECONTINUATIVENella struttura professionale, tuttavia, non esiste alcuna <strong>di</strong>scriminazioneprofessionale. Nelle posizioni apicali - D1, D3 e DIR. - la percentualedelle donne in relazione al totale delle stesse si equivaleal medesimo dato <strong>di</strong> genere maschile con lievi punti <strong>di</strong> vantaggio afavore del genere femminile.La maggiore concentrazione delle donne si ha nelle categorie C e D1.Gli uomini, ad eccezione della categoria C che registra quasi il 39%sono <strong>di</strong>stribuiti abbastanza omogeneamente nelle rimanenti categorie(B1, B3, D1).15,45 16,43 38,79La seguente tabella ha il fine <strong>di</strong> verificare se vi sia sproporzione <strong>di</strong>genere sfavorevole alle donne in funzione delle tipologie contrattuali“deboli”, quali le collaborazioni coor<strong>di</strong>nate e continuative ed i contrattia termine. Nel caso della <strong>Provincia</strong> <strong>di</strong> <strong>Cosenza</strong> il dato mostra una percentuale<strong>di</strong> donne leggermente superiore rispetto agli uomini. Tuttaviaè utile considerare che, vista la <strong>di</strong>fficoltà degli enti locali <strong>di</strong> effettuarenuove assunzioni a causa dei vincoli annualmente imposti dalle leggifinanziarie e visto che i contratti <strong>di</strong> lavoro atipico costituiscono una tipologia<strong>di</strong> lavoro relativamente recente, l’Amministrazione <strong>Provincia</strong>lespinge verso un sostanziale equilibrio tra generi all’interno del proprioorganico <strong>di</strong> personale.Distribuzione per sesso del personale con contratto <strong>di</strong>lavoro a termine (2007)D U TOT. % D % U TOT1 2 3 33,33% 66,67% 100CONTRATTO A TERMINE 68 39 107 63,55% 36,45% 100TOTALE 69 41 110 62,73% 37,27% 10037,7626,6718,657,885,711,82 2,10A B1 B3 C D1 D3 DIR. D.G.% D SU TOT D % U SU TOT U0,00 0,00


